| | Report Name | Report Description | Report Preview |
|
|
Advanced Placement Download - Level 0 Extract
|
CSV extract with students and their overall score on the Advanced Placement (AP) exams. The extract is in the eScholar Assessment Fact layout and may be imported into Level 0.
|
|
|
|
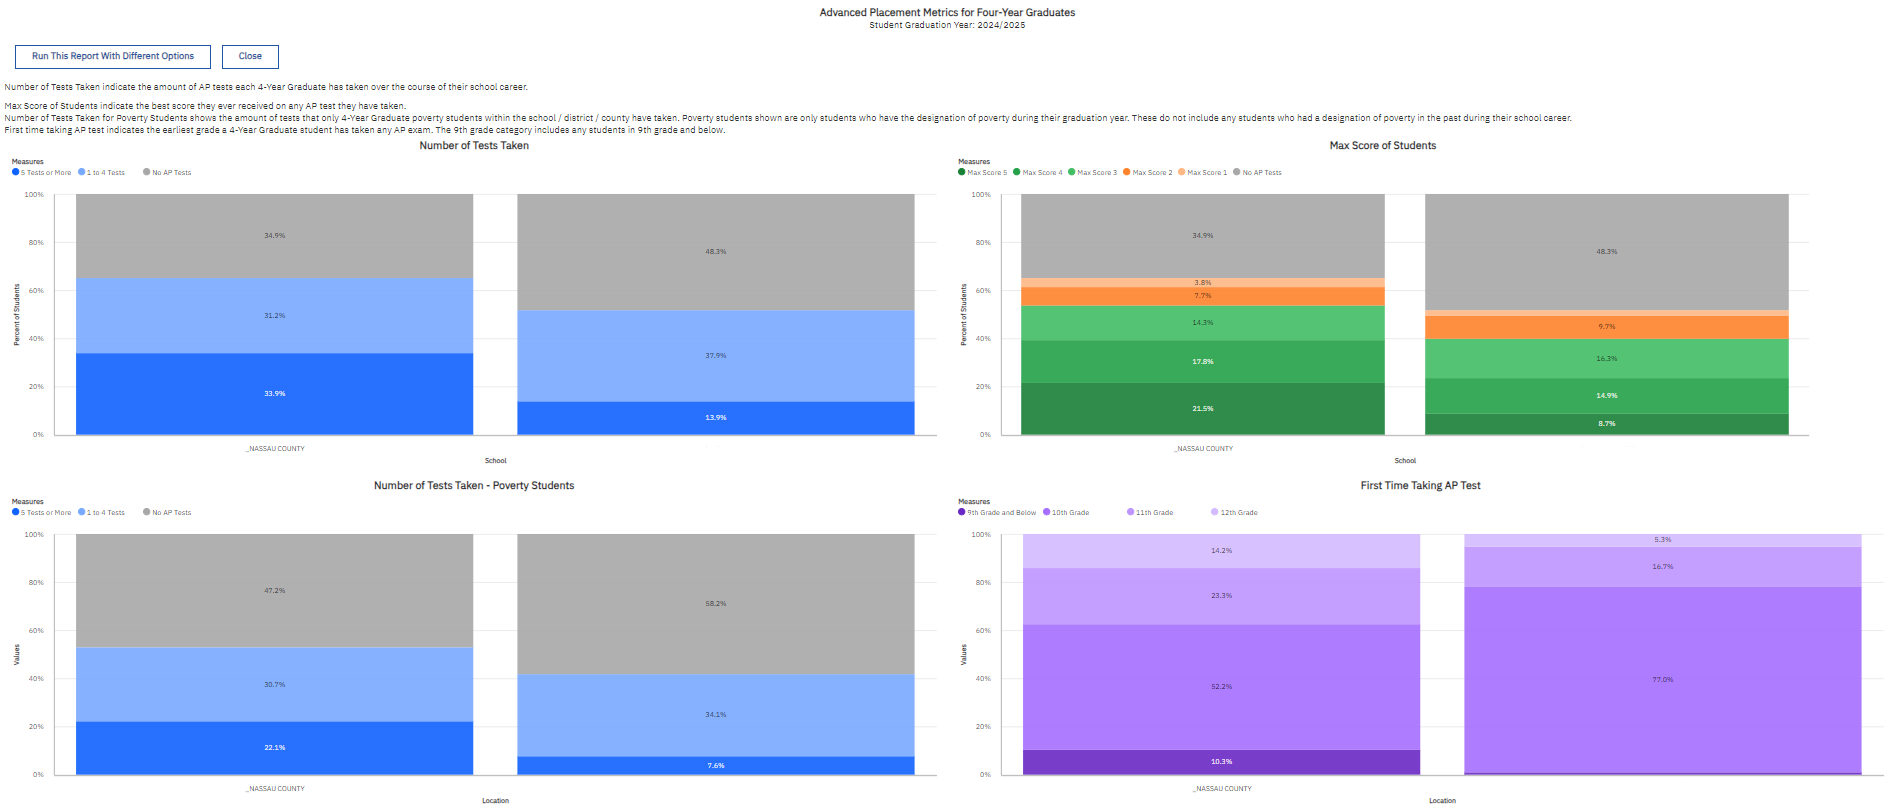
Advanced Placement Metrics for Four-Year Graduates
|
This report provides summary statistics for AP assessments in comparison with county wide statistics. The report comprises students who took an AP test, the number of AP tests, and best score they received on their AP test. This report reflects students identified in Assessment Fact as having taken each AP examination. Data are filtered by the school year of the 4-year graduating cohort of students, and can be additionally filtered or sorted through the interactive features of the report.
|
|
|
|
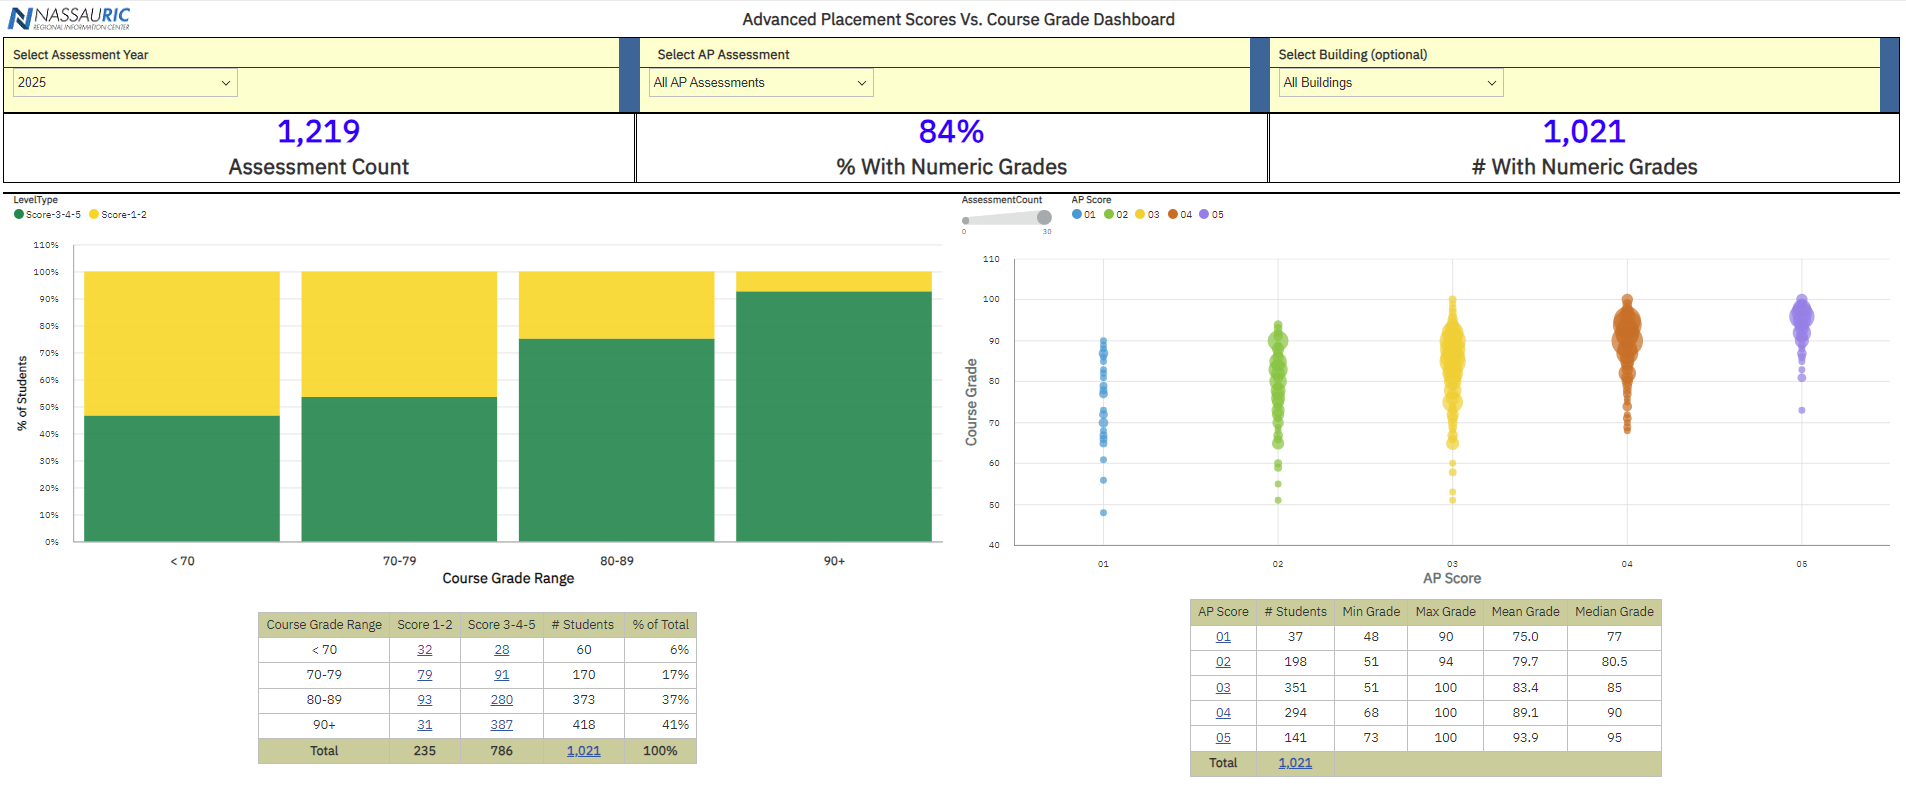
Advanced Placement Scores Vs. Course Grade Dashboard
|
Shows the grades in AP exams and courses by plotting the scores of each category in both a bar plot and a violin plot. Tables for each category are included to show score totals by students.
|
|
|
|
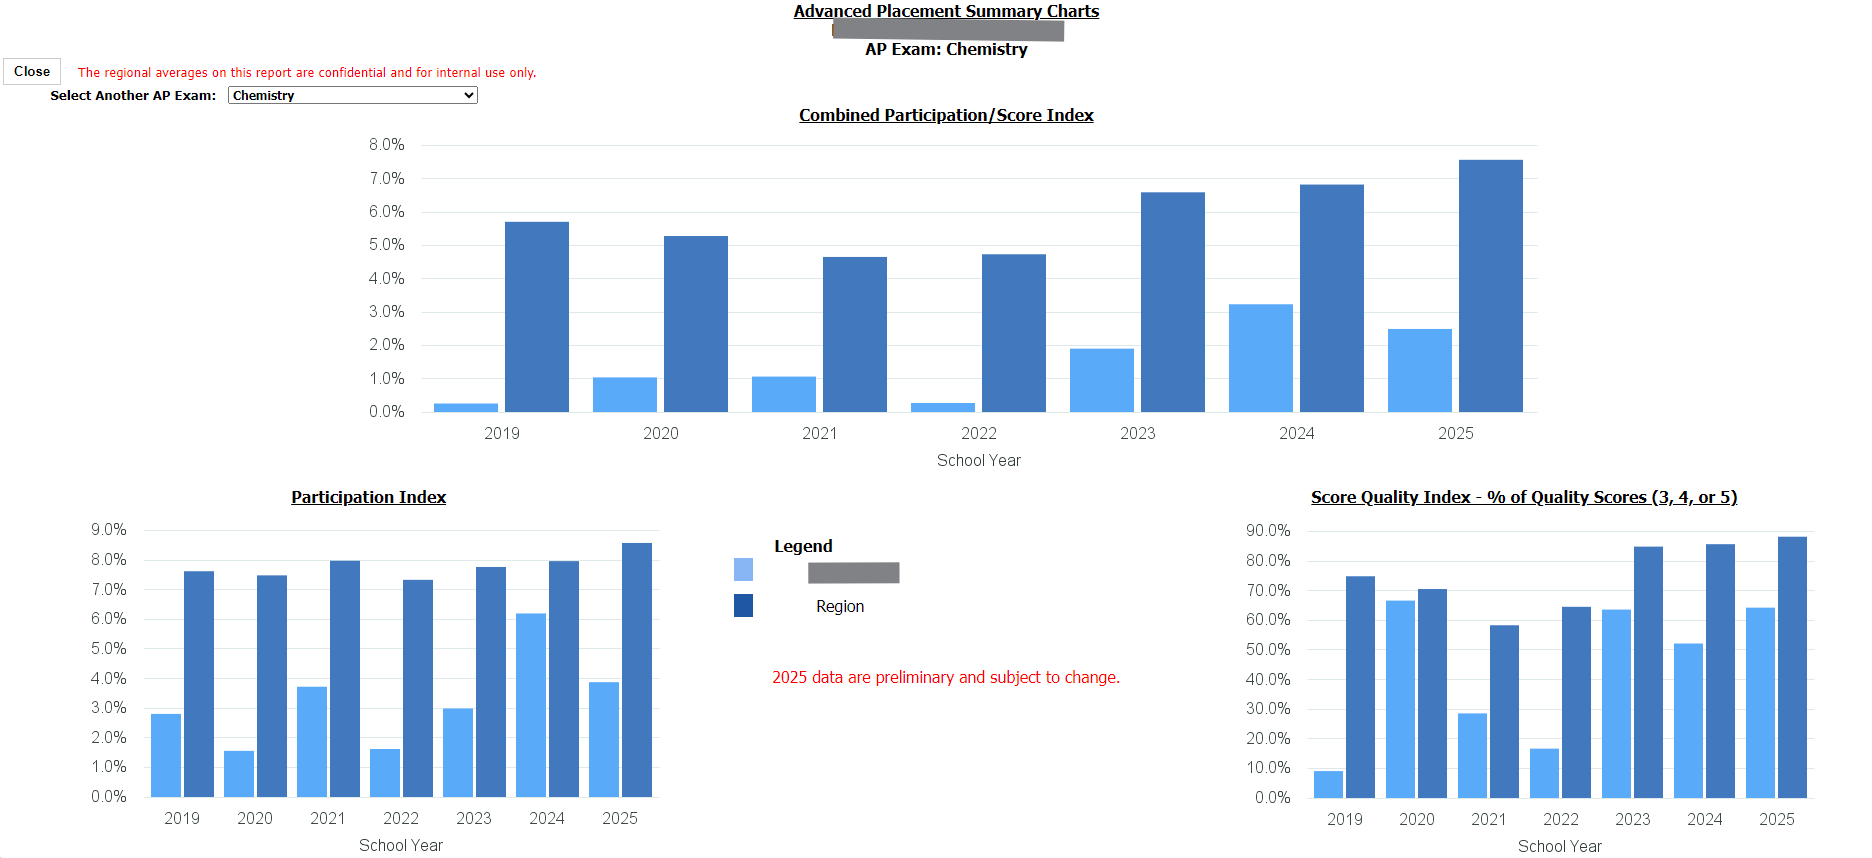
Advanced Placement Summary Charts
|
The Advanced Placement Summary Charts compares AP scores for the school with the mean of all participating Nassau County schools ("Region").
|
|
|
|
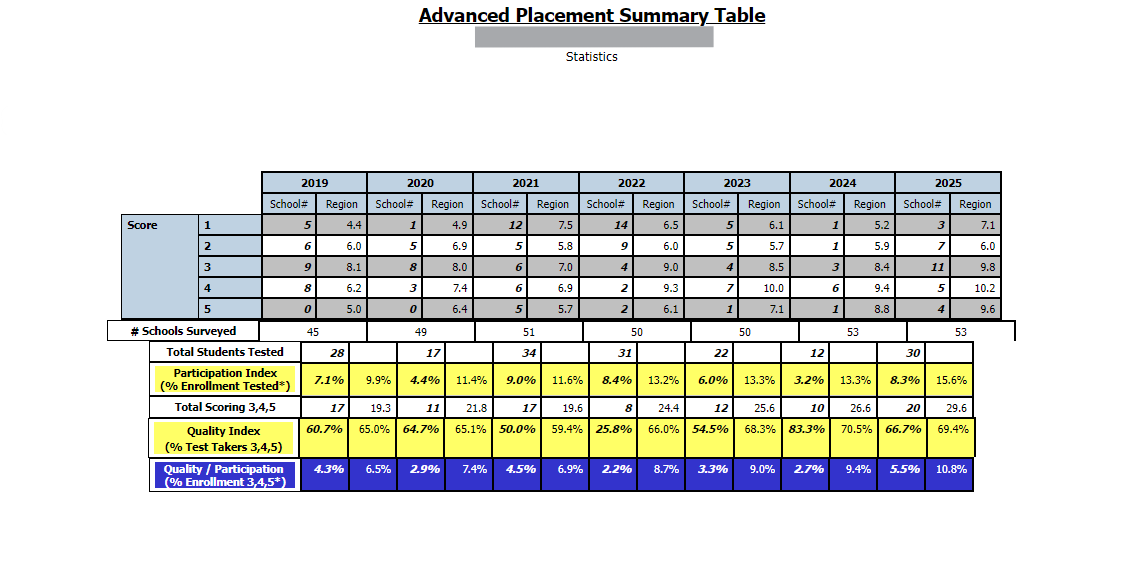
Advanced Placement Summary Table
|
Number and percent of student scoring at each level on AP Exams. Scores aggregated to building. Comparison to DW mean.
|
|
|
|
Annual Student Assessment Summary Download
|
CSV download to Excel lists all students taking assessments in a selected year or years
|
|
|
|
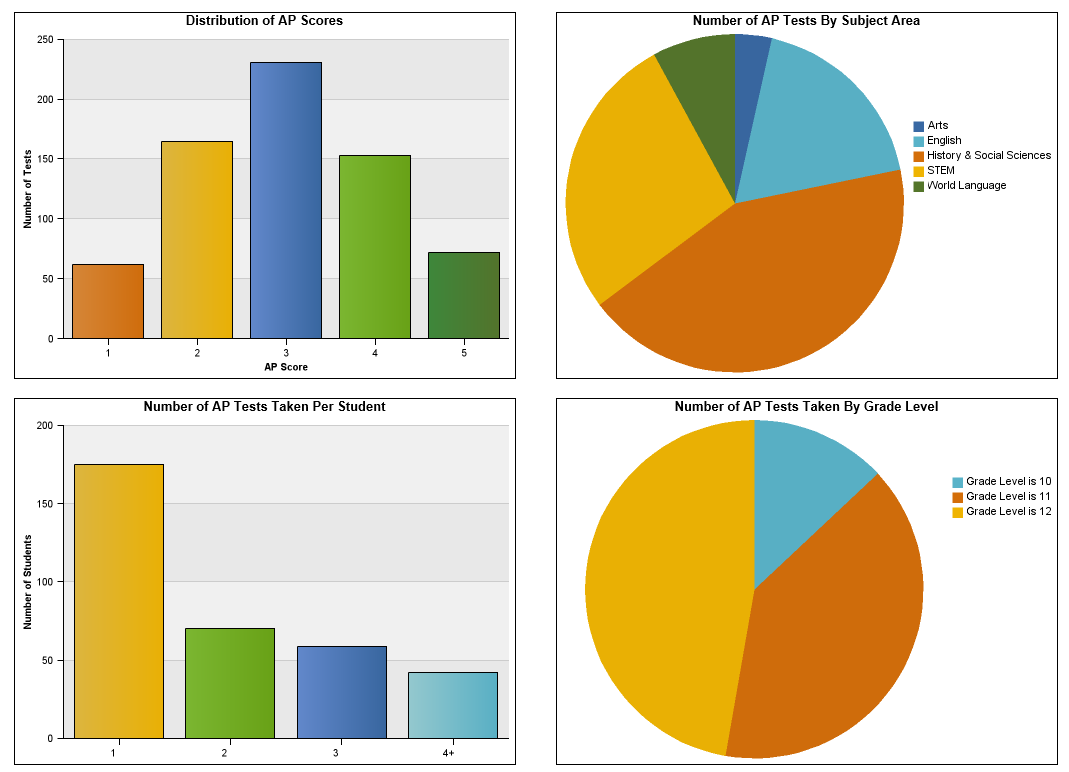
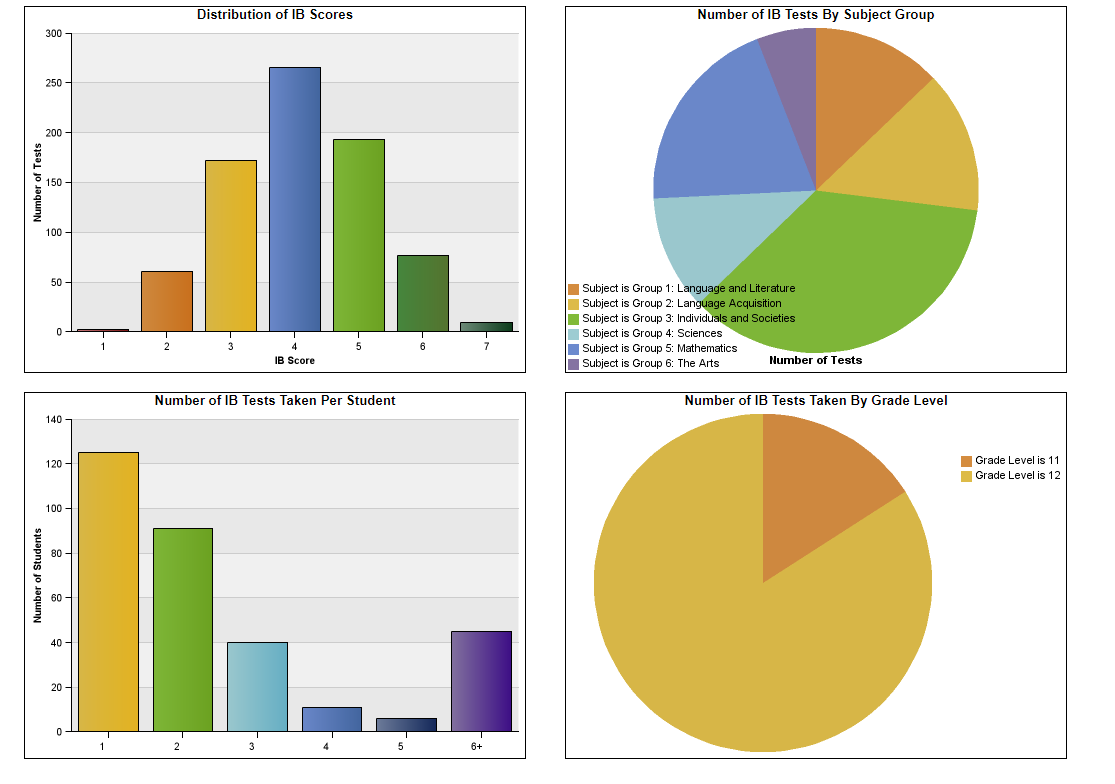
AP Dashboard
|
Various visualizations depicting AP Score, test taken numbers by subject or grade level. Includes demographic filters.
|
|
|
|
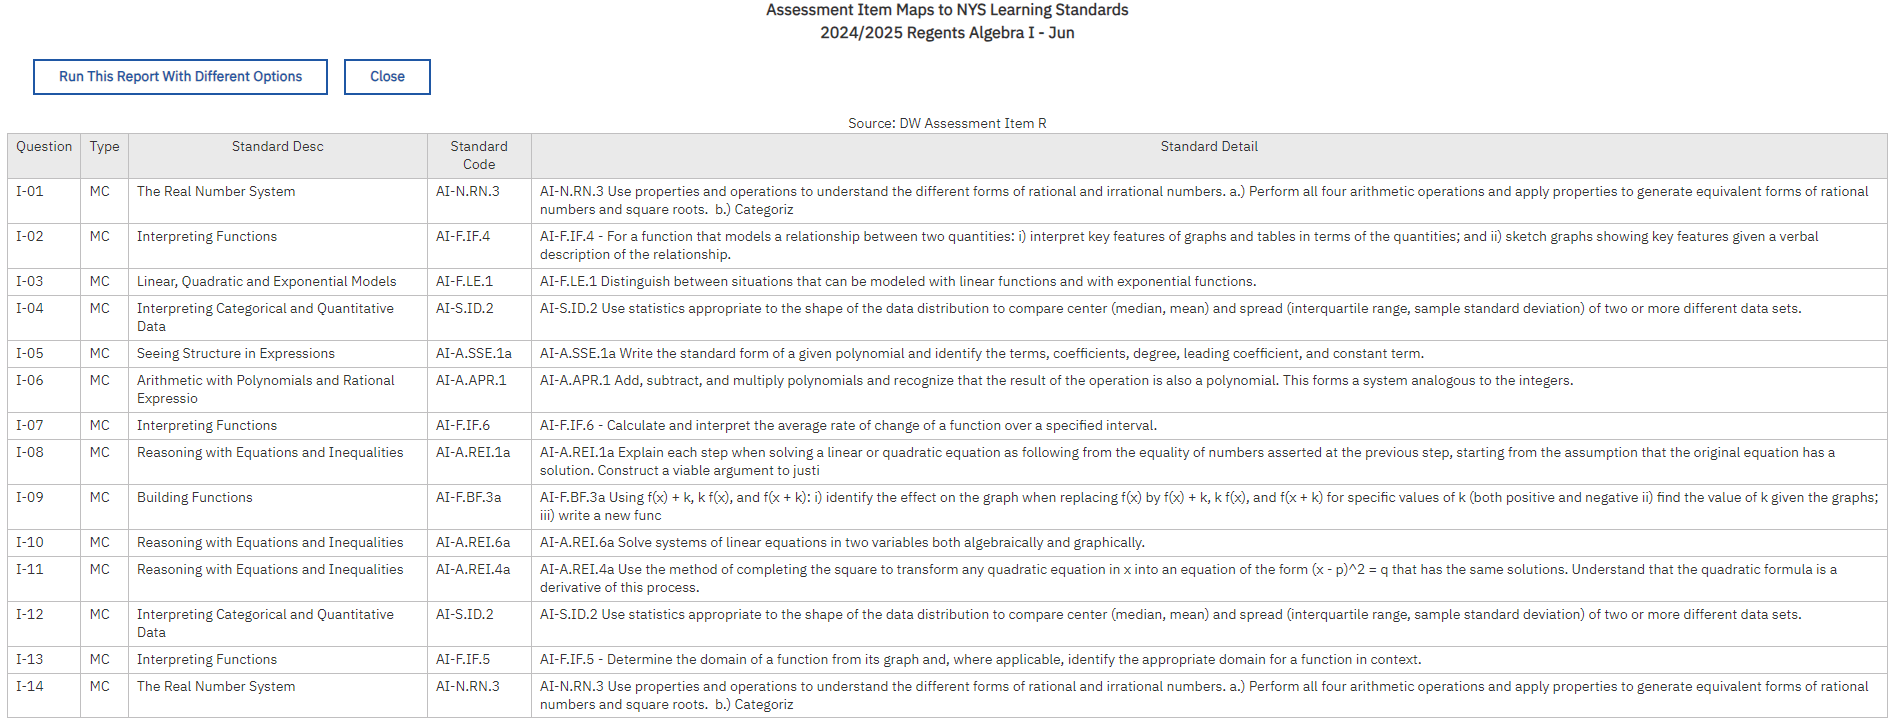
Assessment Item Maps to NYS Learning Standards
|
This report identifies the primary skills necessary to successfully answer each question on the selected NYS assessment. NYS 3-8 assessments will have more detailed learning standards than high school Regents exams.
|
|

|
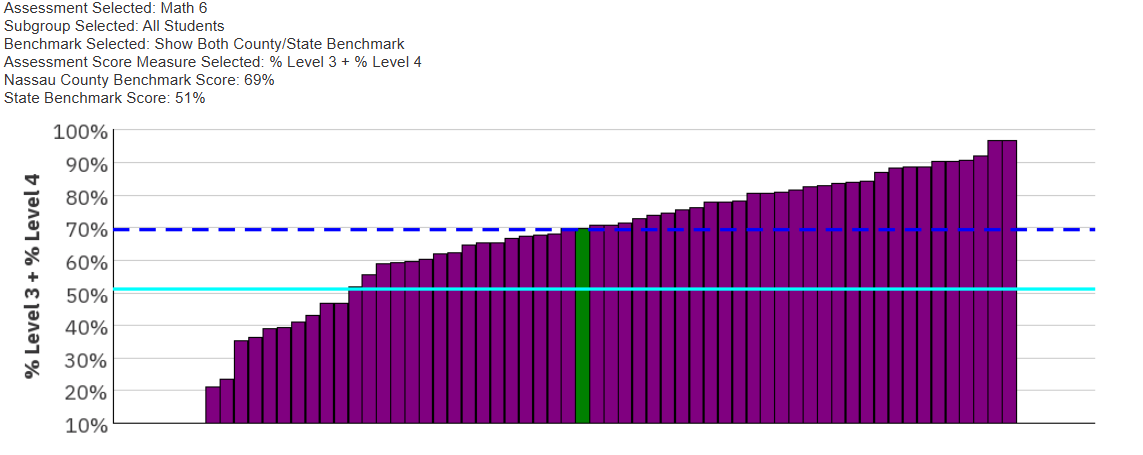
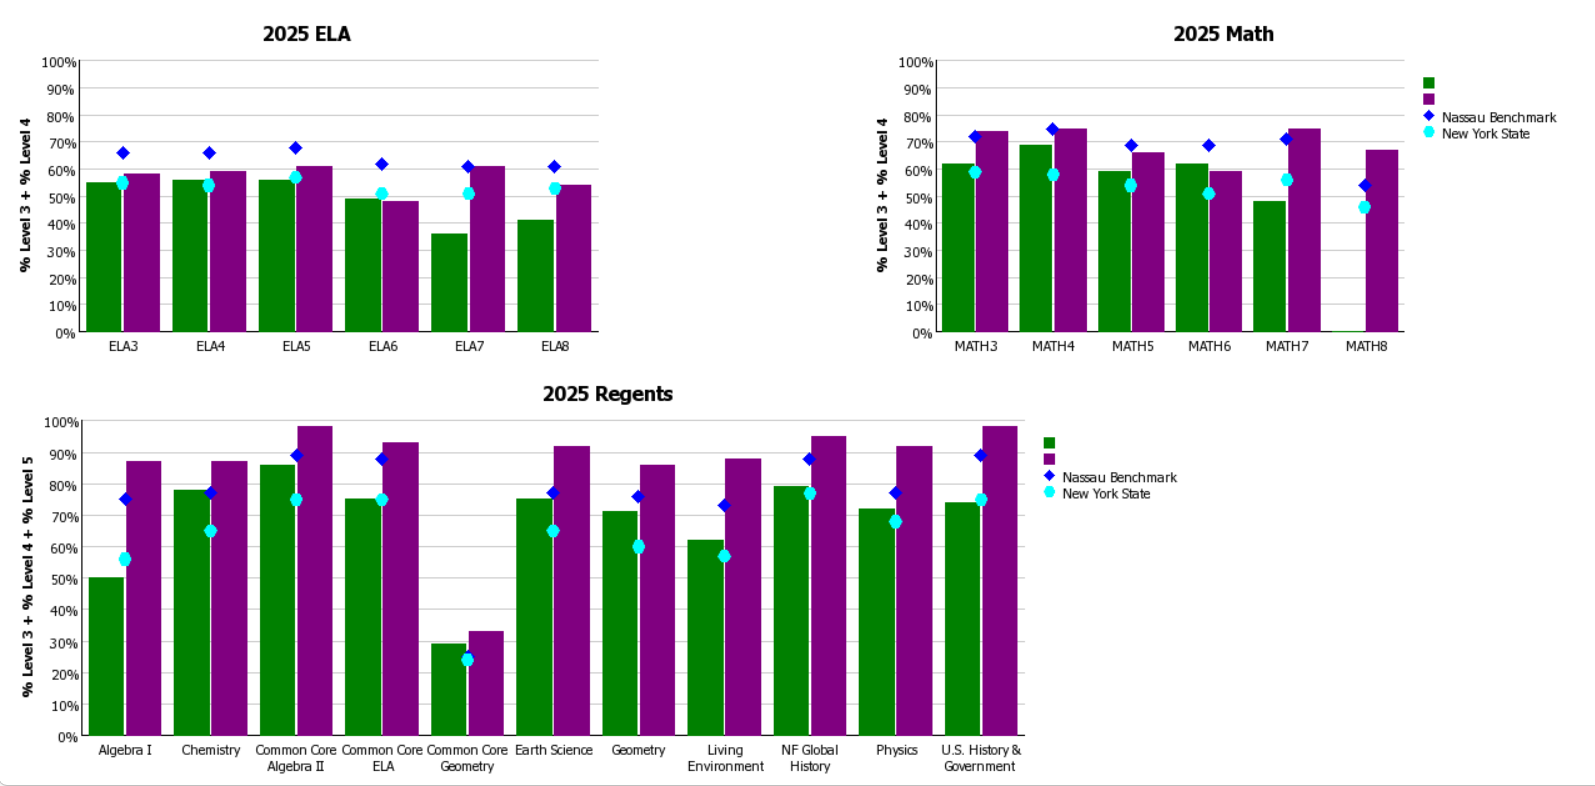
Assessment Performance Report
|
Compare assessment performance across all major state exams and many 3rd party assessments within district, or to the county or state benchmarks.
|
|
|
|
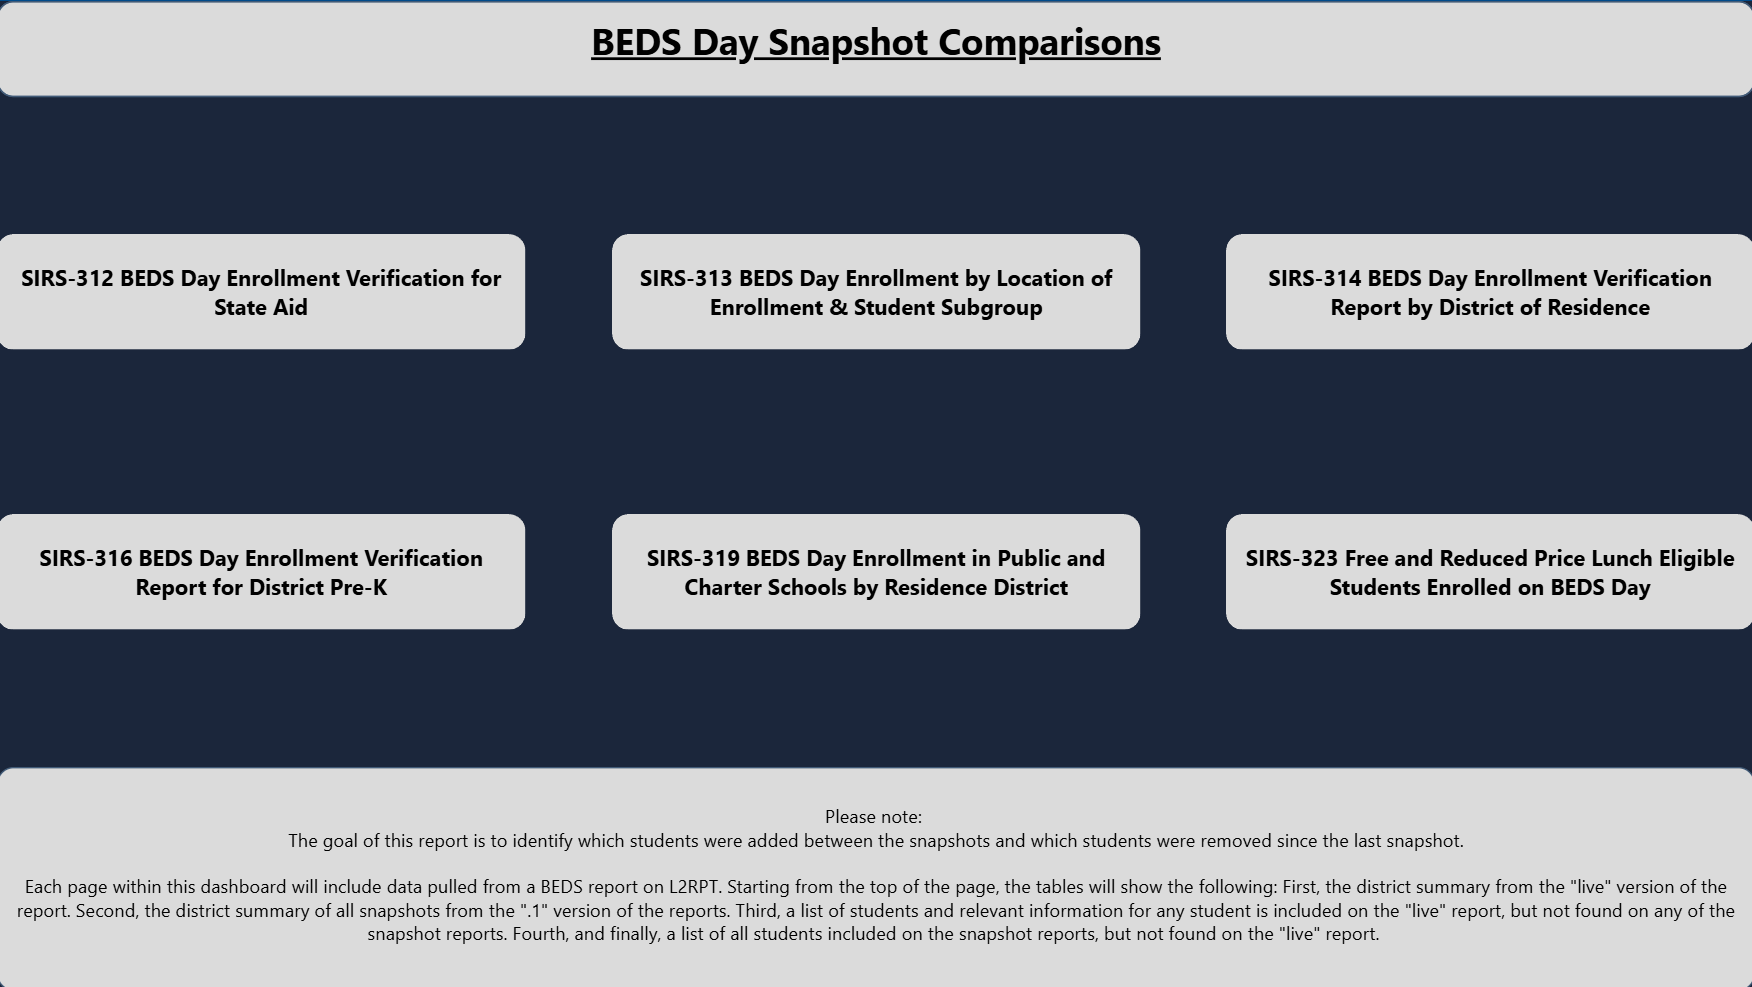
BEDS Day Report Comparison
|
Compare BEDS report snapshots to the weekly updated versions to easily identify additions and/or removals.
|
|
|
|
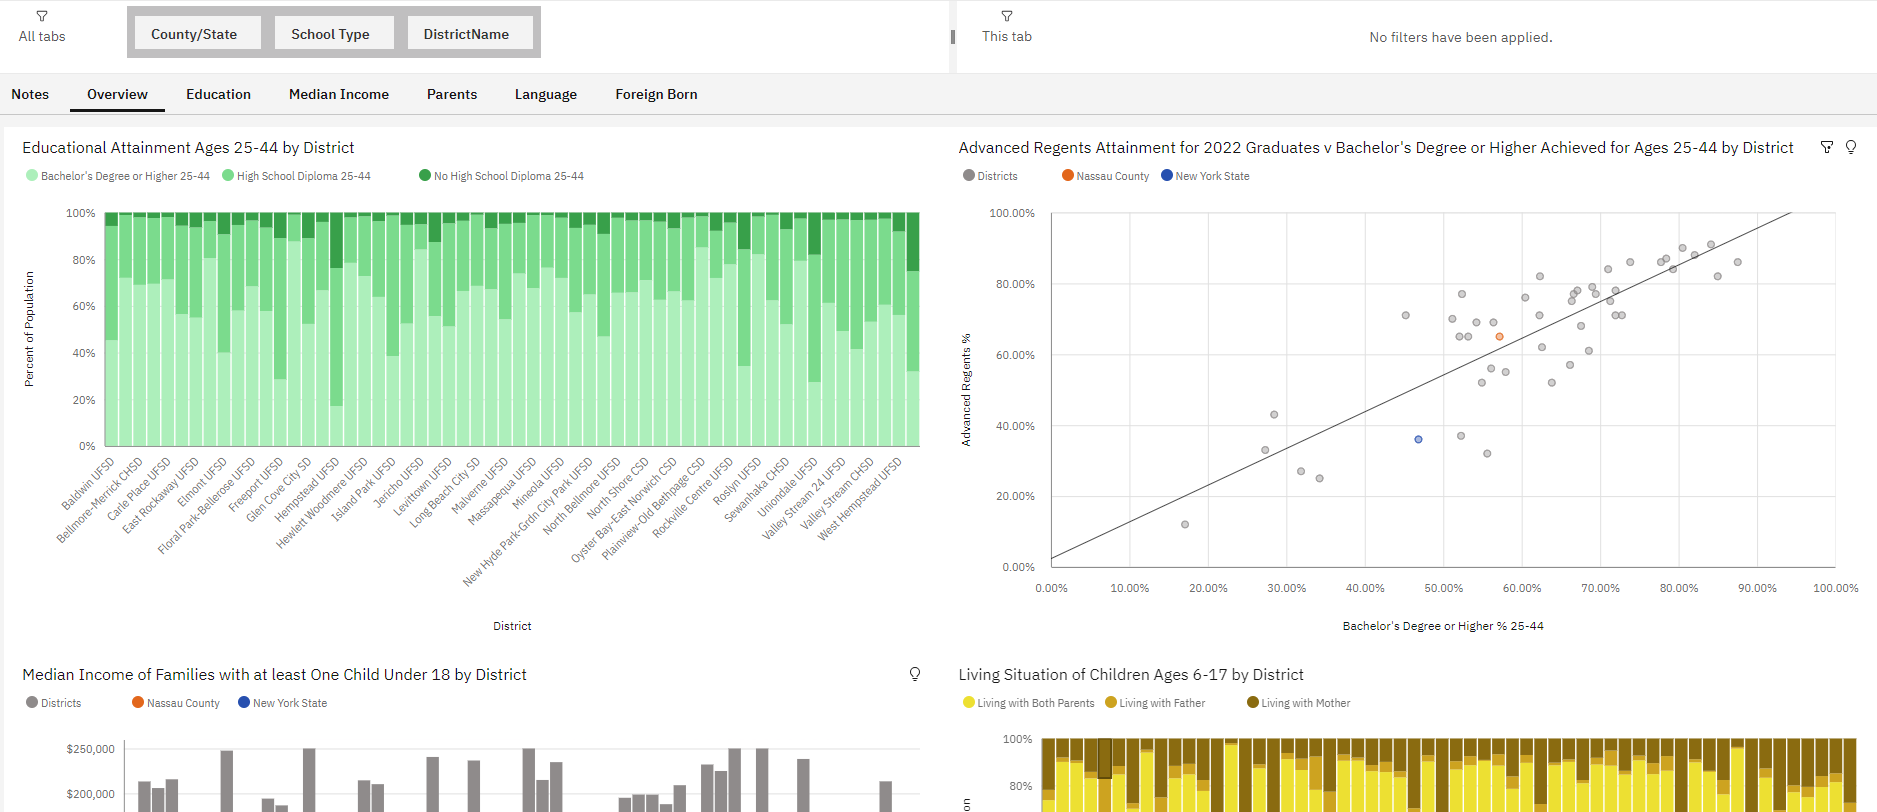
Census Population Characteristics and NYSED Advanced Regents Diploma Dashboard
|
This dashboard displays general population characteristics from the United States Census Bureau along with the percent of students receiving an advanced Regents diploma from the NYSED Report Card. Users can explore various categories of Census data, including educational attainment, median income, parental living arrangements, language spoken at home, and foreign born population.
|
|
|
|
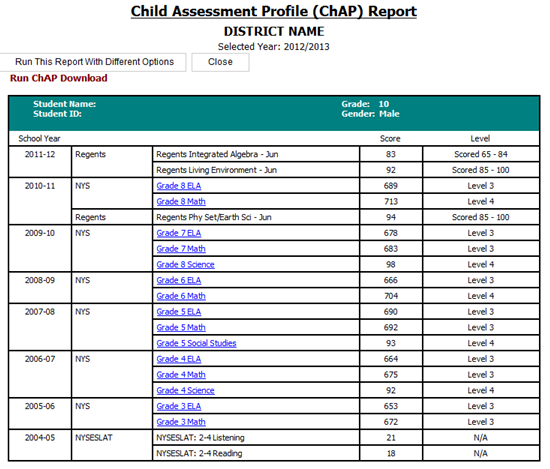
Child Assessment Profile (ChAP)
|
Displays a student's complete assessment history while enrolled in the district. Includes all assessments loaded into Level 1.
|
|
|
|
Child Assessment Profile (ChAP) Download
|
Downloads a csv file with students' complete assessment histories while enrolled in the district.
|
|
|
|
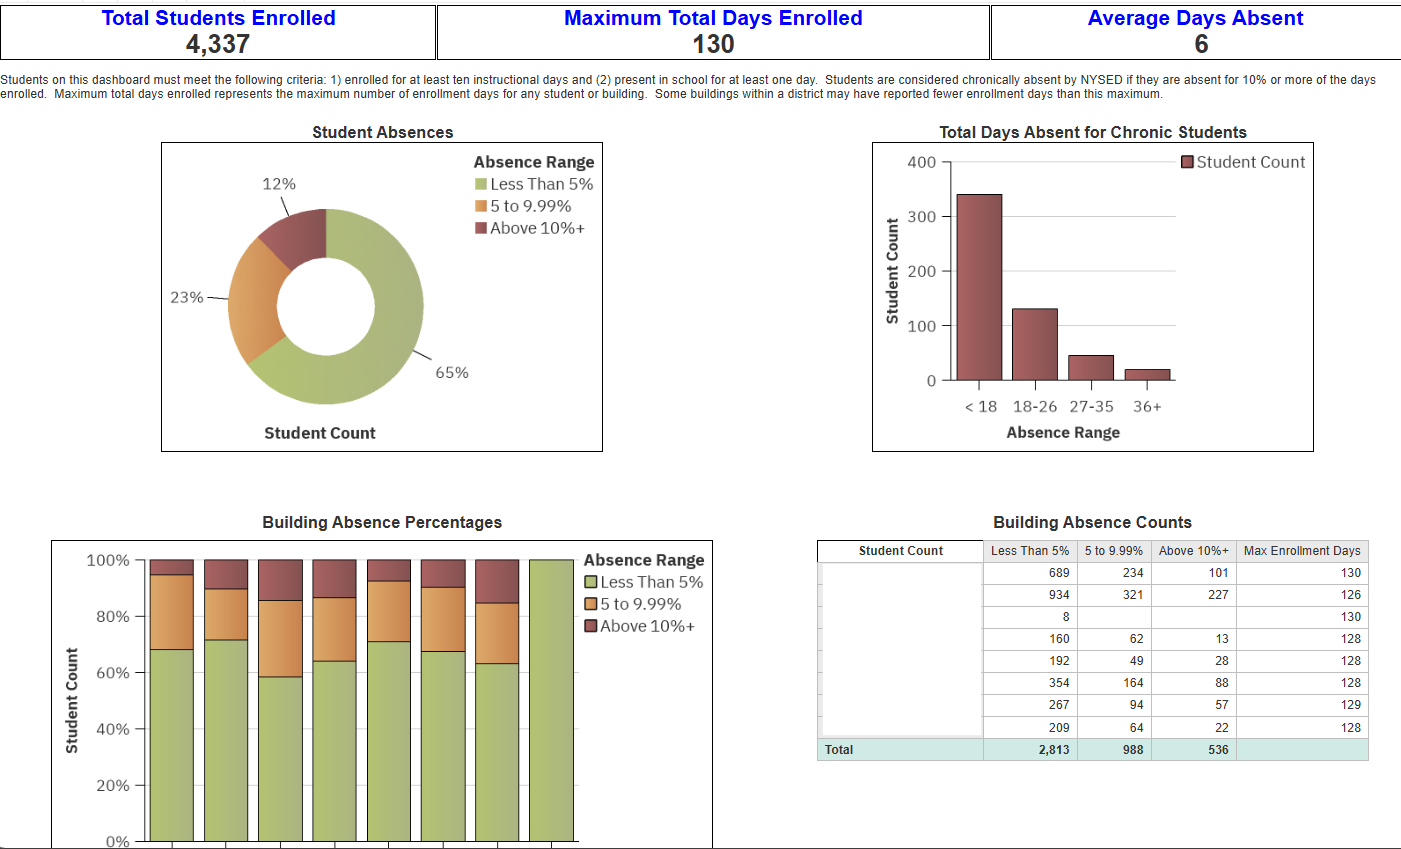
Chronic Absence Dashboard
|
Various visualizations depicting student absenses. Includes demographic filters.
|
|
|
|
Classroom 3-8 Assessment Longitudinal Report
|
Teacher Interface report with grades 3-8 NYS Assessment for all students in a selected classroom over multiple years.
|
|
|
|
Classroom Assessment Snapshot
|
Teacher Interface aggregated assessment snapshot for students in a selected classroom. Displays all assessments for students in the selected assessment year.
|
|
|
|
Classroom Child Assessment Profile (ChAP) Report
|
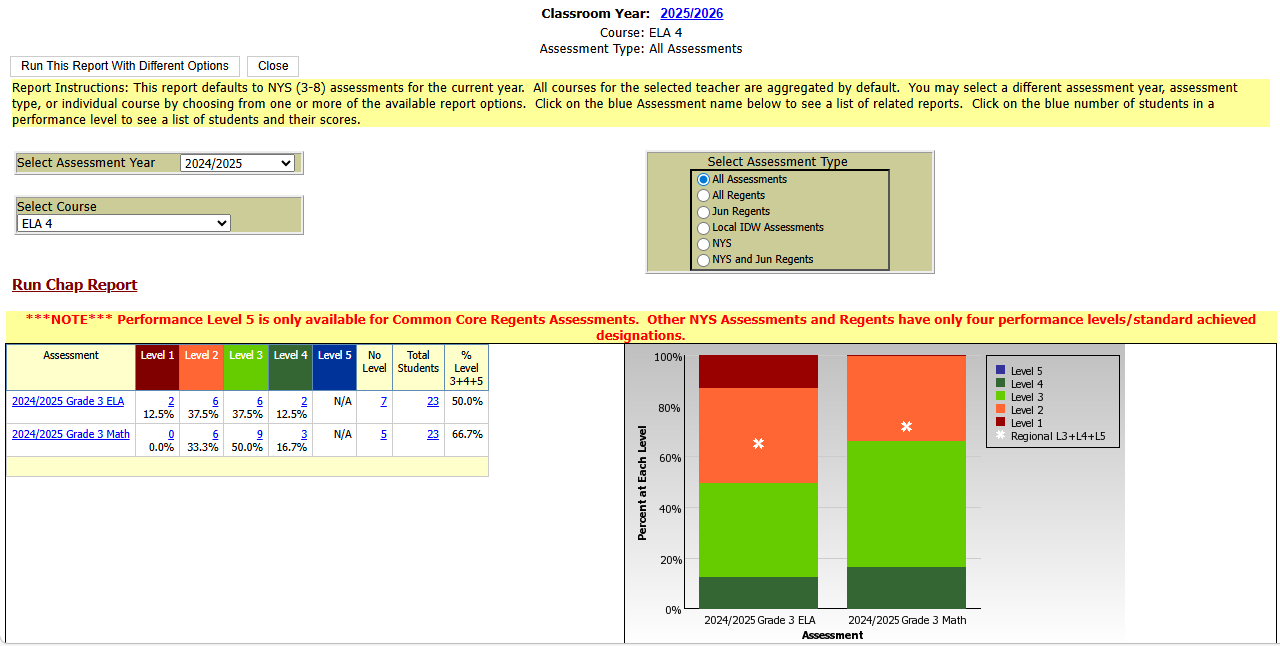
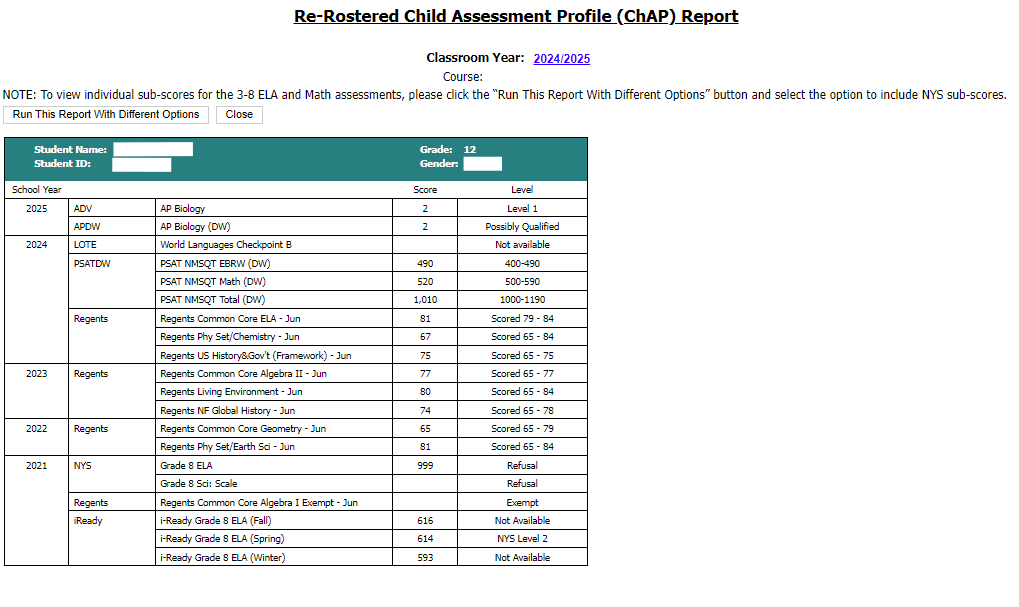
The Child Assessment Profile provides a complete assessment history for each student. Assessments are grouped by year and assessment type. Only assessments that have been loaded into the IDW are included on this report.
|
|
|
|
Classroom Chronic Absence Report
|
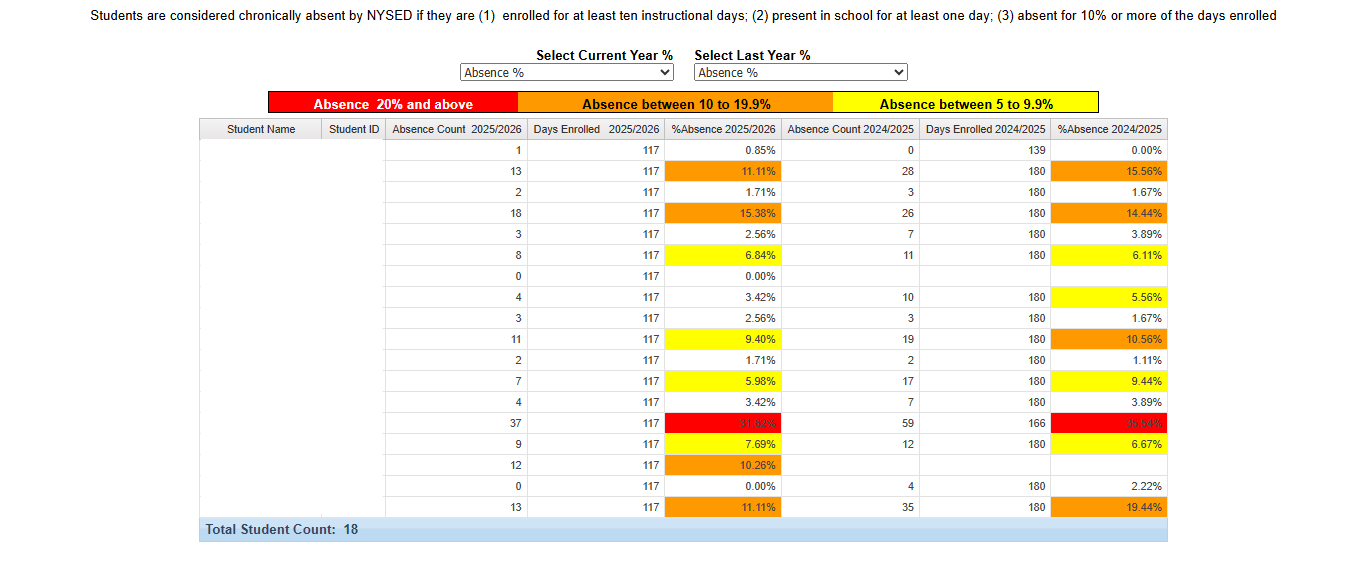
Teacher Interface report displaying aggregated daily attendance/absences for individual students in a selected classroom. Comparison of this year's current attendance vs. last year's attendance.
|
|
|
|
Classroom Constructed Response Analysis
|
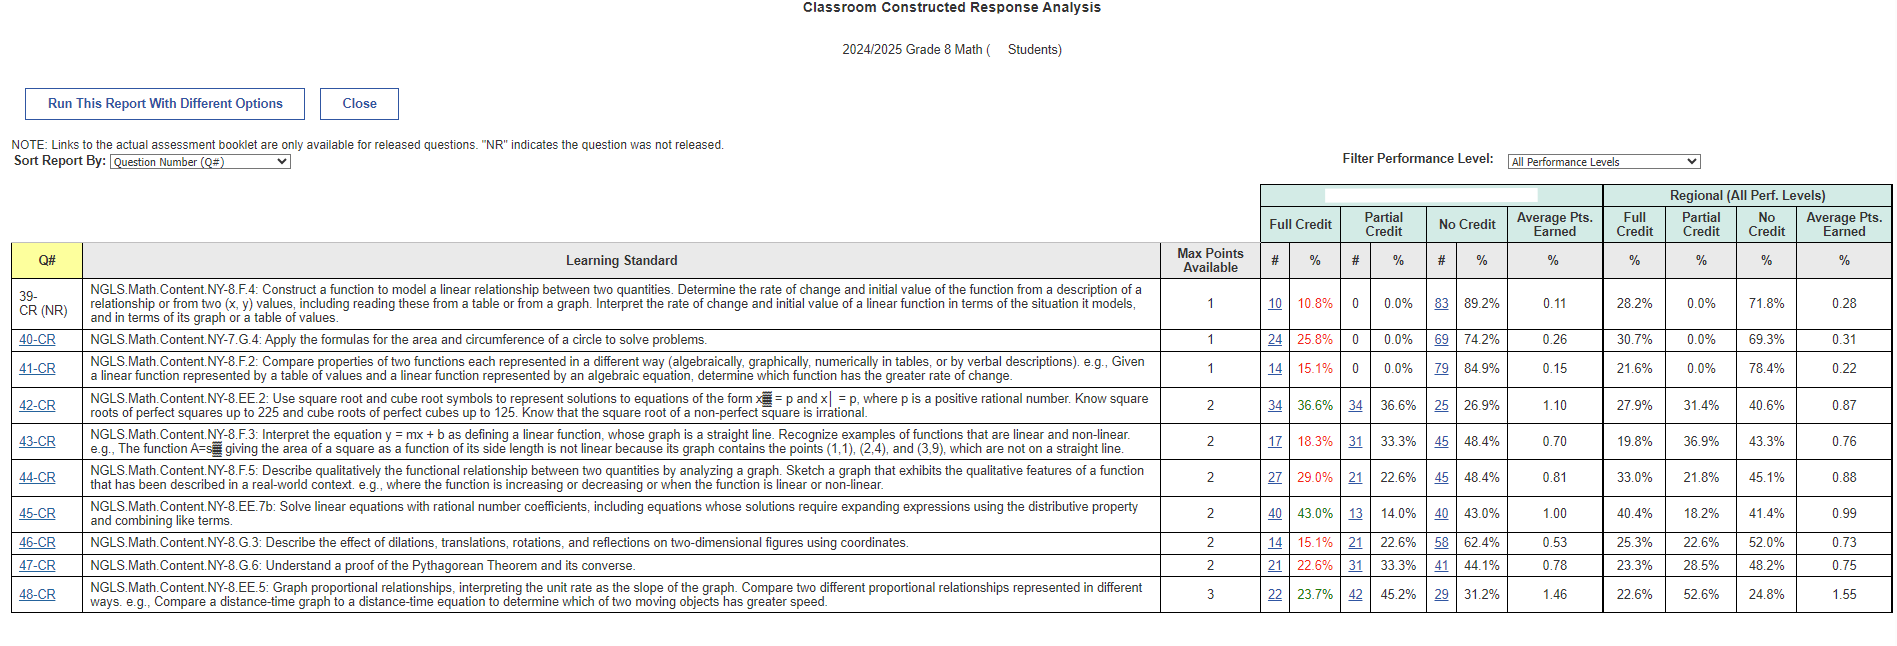
This report examines the number and percent of students receiving full credit, partial credit and no credit on all constructed response questions for the selected assessment. Comparisons to the region (if available) are included
|
|
|
|
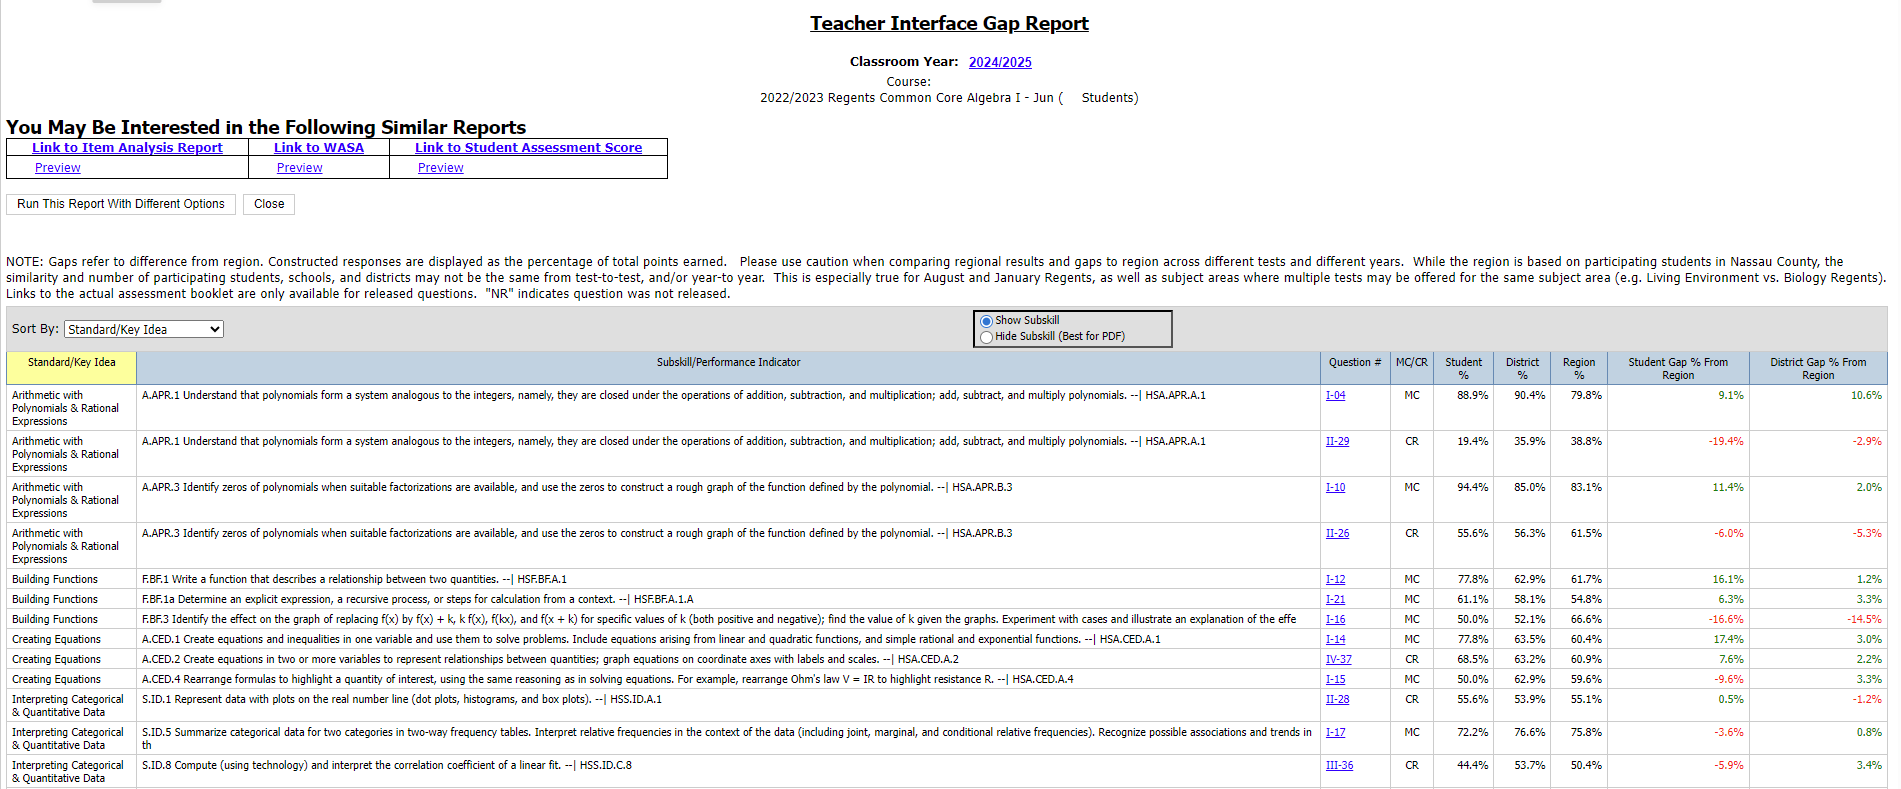
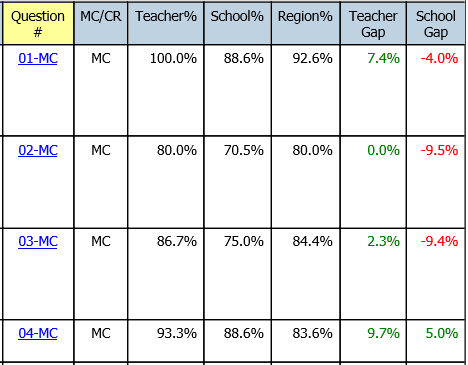
Classroom Gap Report
|
The Gap Report compares how students in a teacher's classroom performed on specific assessment questions compared to the school and Nassau County. Assessments from prior years have been "re-rostered" and aggregated for students in a teacher's selected class.
|
|
|
|
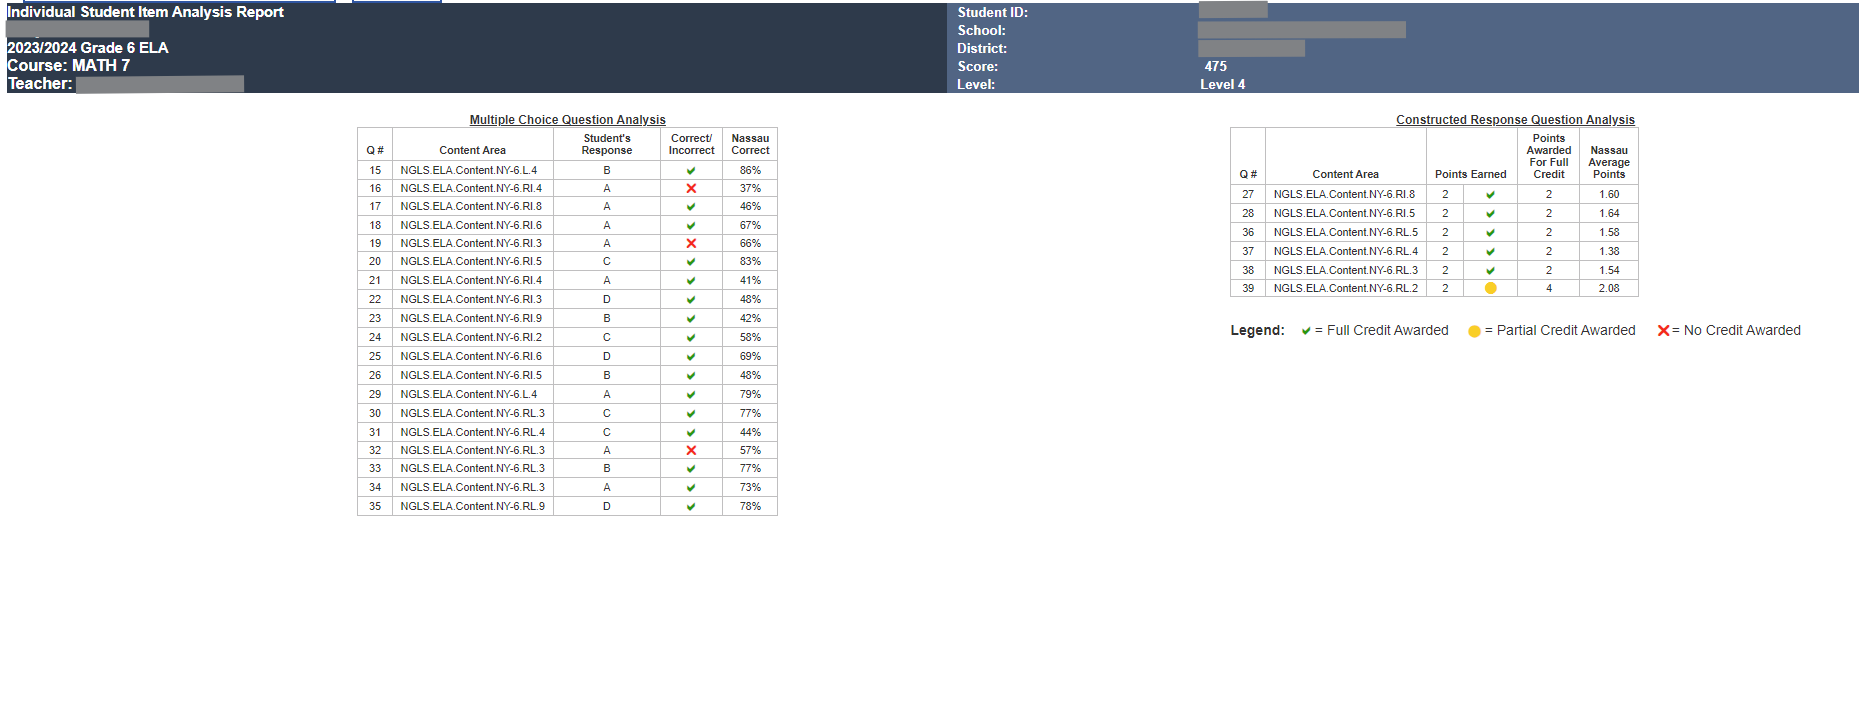
Classroom Individual Student Item Analysis Report
|
This pdf report will break down each student's scores and assessment responses for a selected assessment. This report is ideal for printing student's responses for distribution.
|
|
|
|
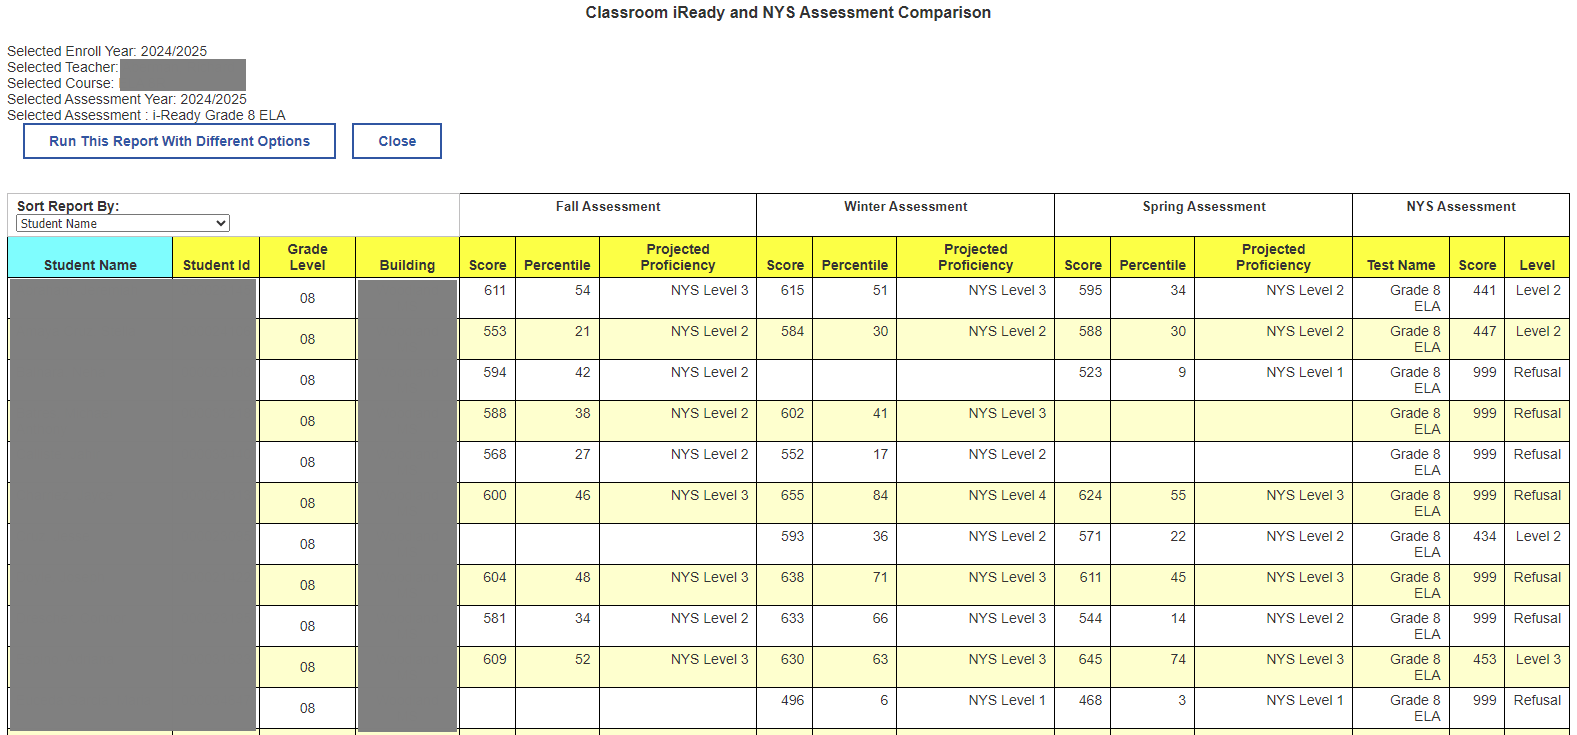
Classroom iReady and NYS Assessment Comparison
|
This report compares NYS projected proficiency levels for all students for each seasonal iReady assessment (Fall, Winter, Spring) along with the actual results of the official NYS 3-8 examination. Assessments from prior years have been "re-rostered" for a teacher's selected classroom.
|
|
|
|
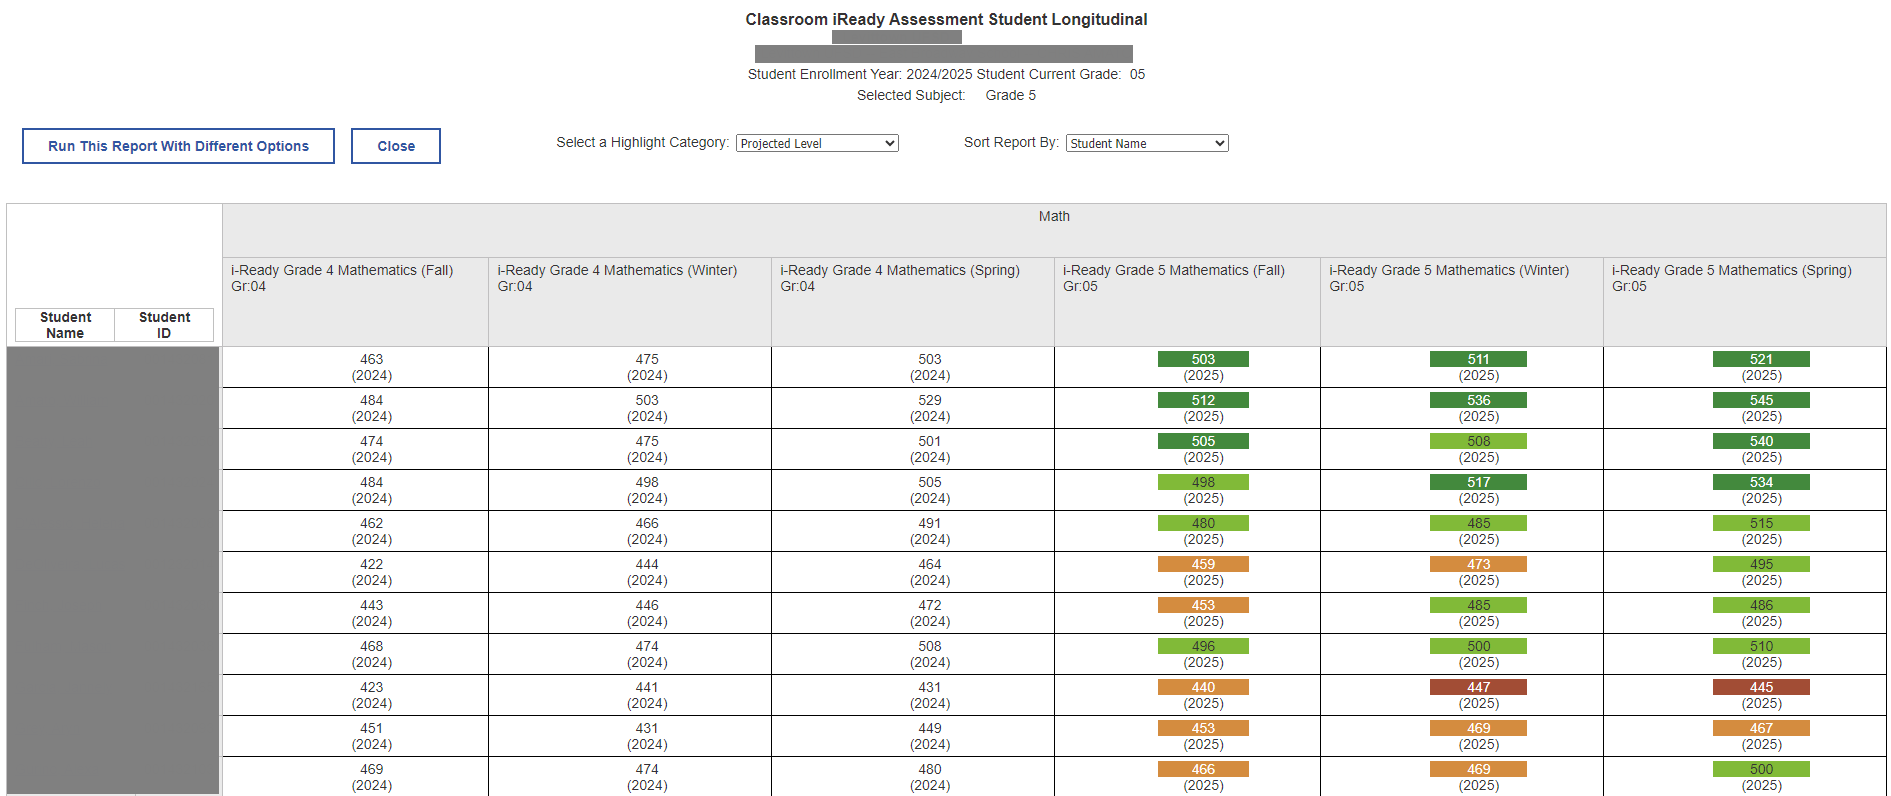
Classroom iReady Assessment Student Longitudinal
|
This report displays historical iReady scale scores for all students in a teacher's classroom for the selected year of enrollment. Data are grouped longitudinally by subject area.
|
|
|
|
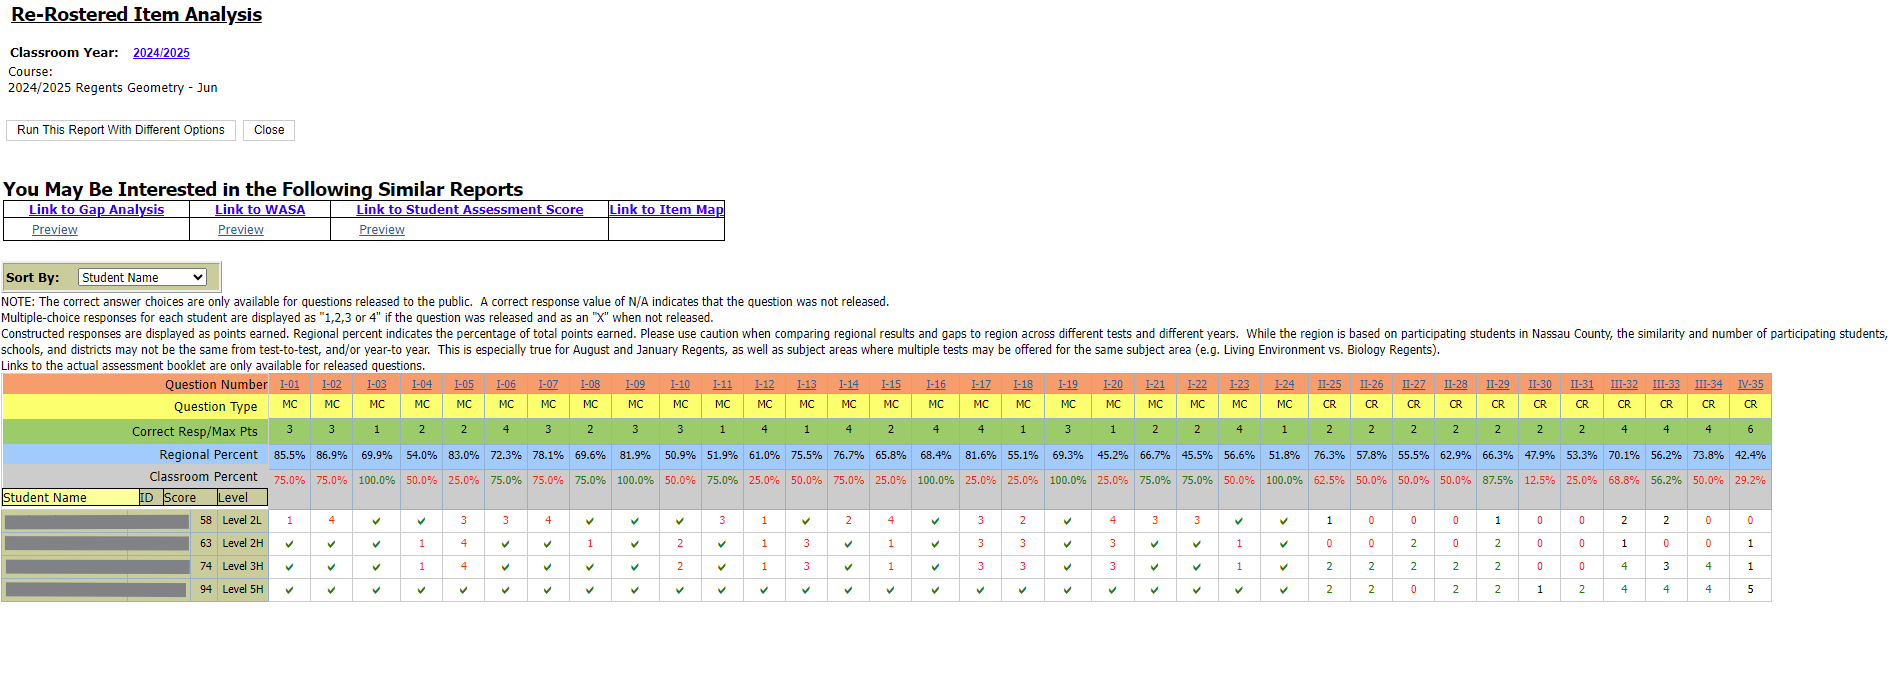
Classroom Item Analysis
|
This report displays a list of students and their responses to all questions on a particular assessment. Assessments from prior years have been "re-rostered" and aggregated for students in a teacher's selected class.
|
|
|
|
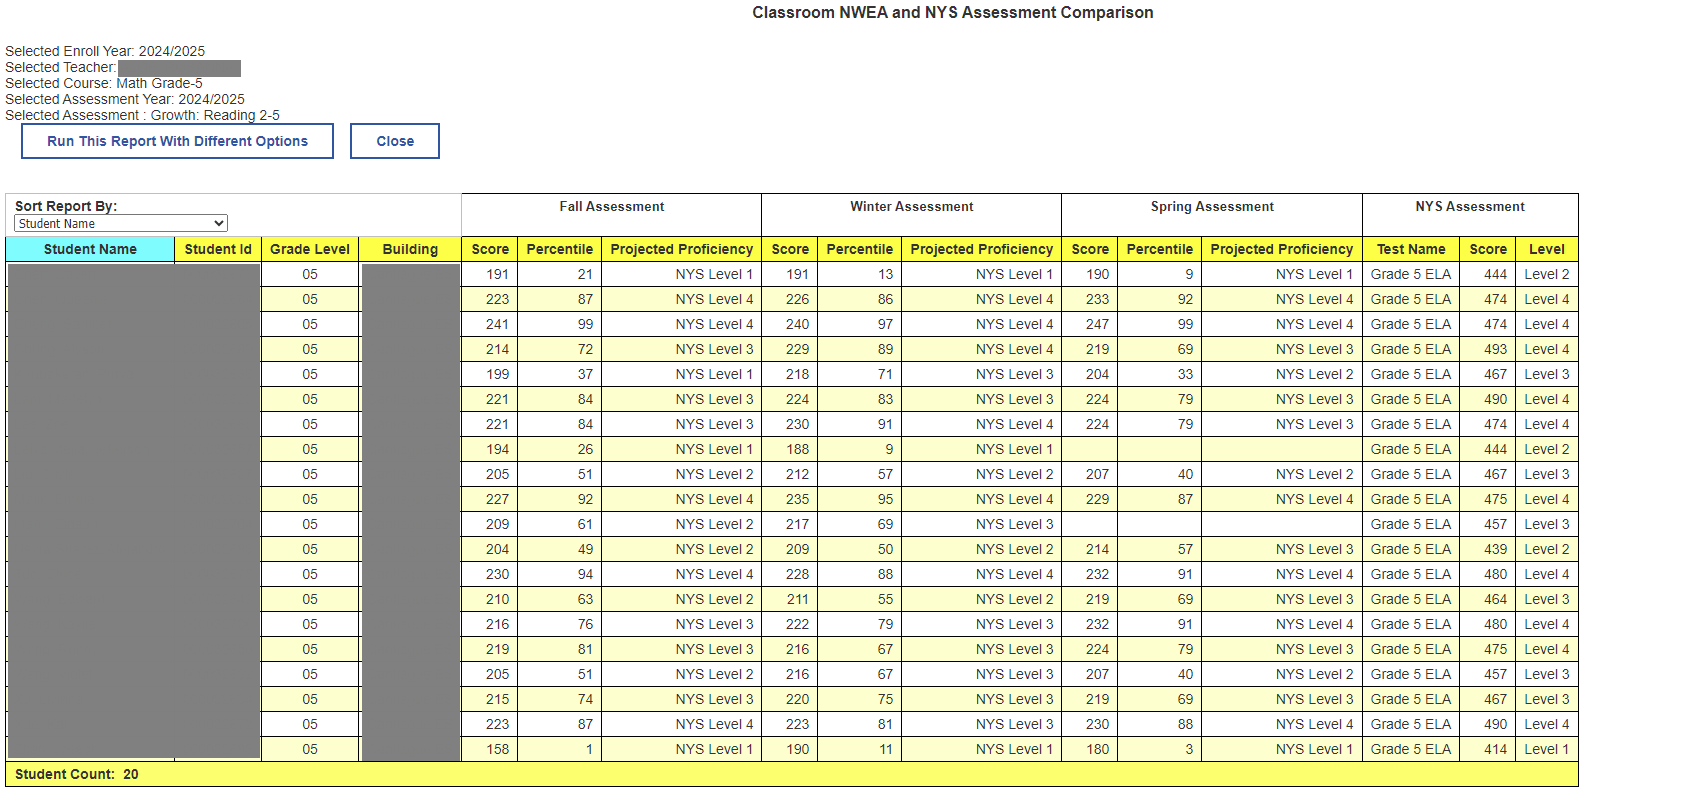
Classroom NWEA and NYS Assessment Comparison
|
This report compares NYS projected proficiency levels for all students for each seasonal NWEA assessment (Fall, Winter, Spring) along with the actual results of the official NYS 3-8 examination. Assessments from prior years have been "re-rostered" for a teacher's selected classroom.
|
|
|
|
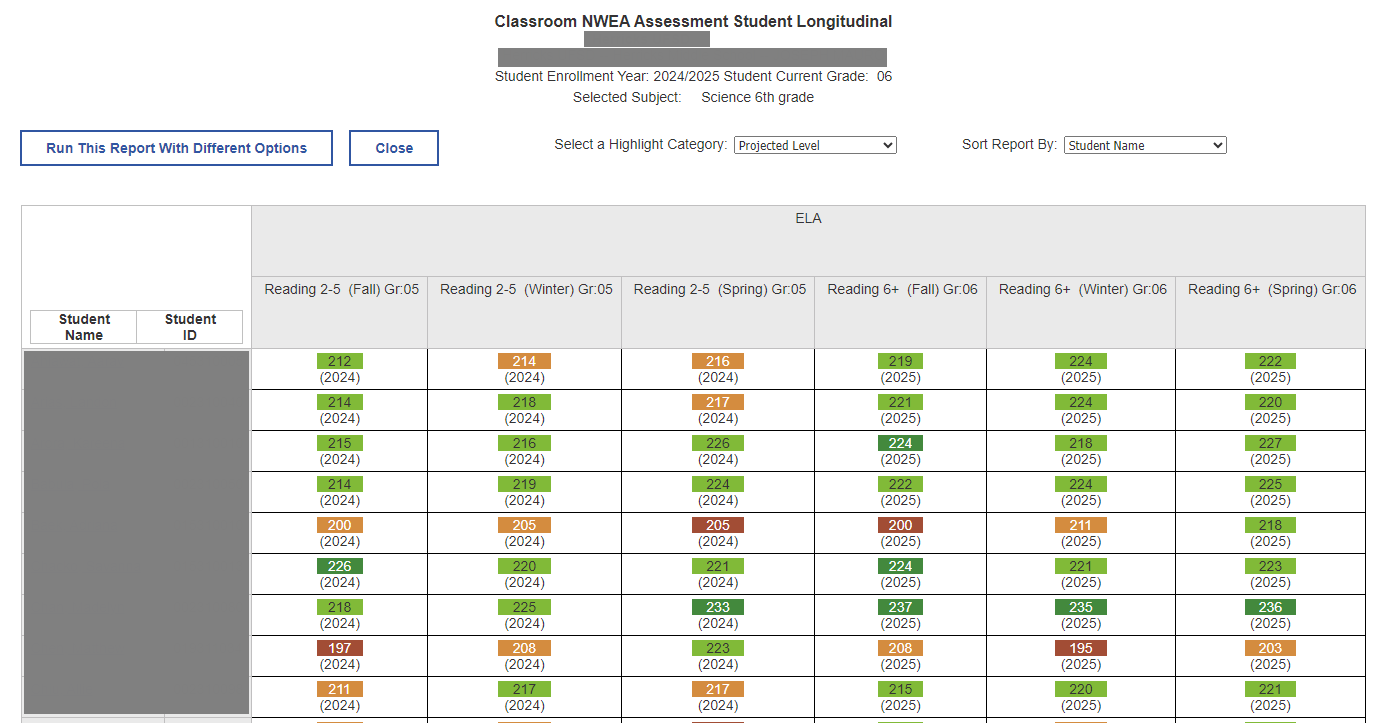
Classroom NWEA Assessment Student Longitudinal
|
This report displays historical NWEA RIT scores for all students in a teacher's classroom for the selected year of enrollment. Data are grouped longitudinally by subject area.
|
|
|
|
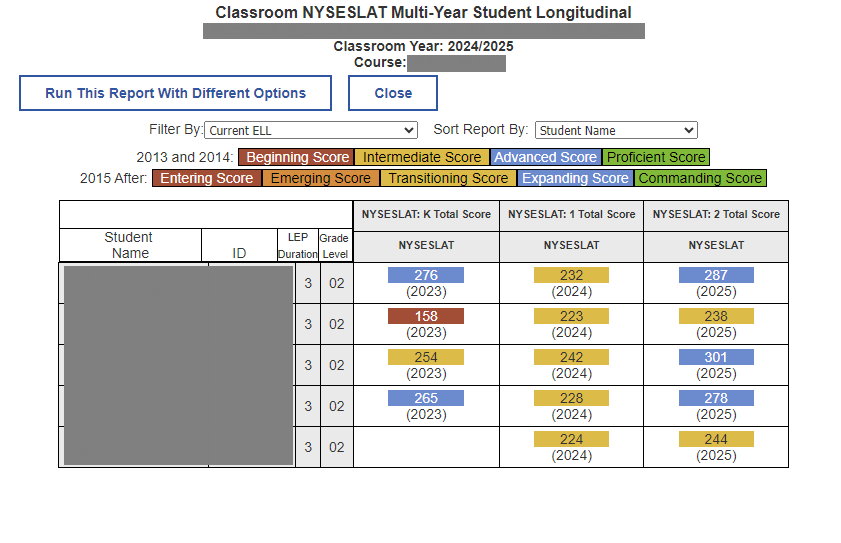
Classroom NYSESLAT Multi-Year Student Longitudinal
|
This report displays a history of NYSESLAT assessments for all students. Scores are available starting in the 2013 school year.
|
|
|
|
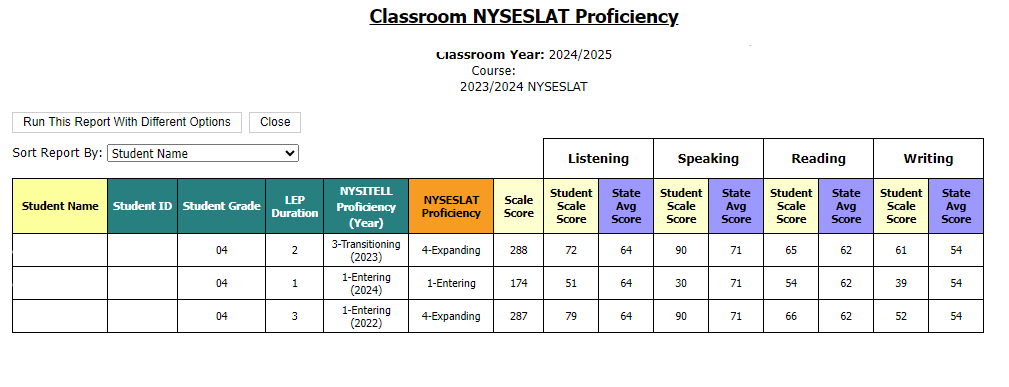
Classroom NYSESLAT Proficiency
|
The Classroom NYSESLAT Proficiency Report displays NYSESLAT total scores for students, along with the component subtest language skill scores (speaking, listening, reading, and writing). Assessment scores from prior years have been "re-rostered" to include students in a teacher's selected class.
|
|
|
|
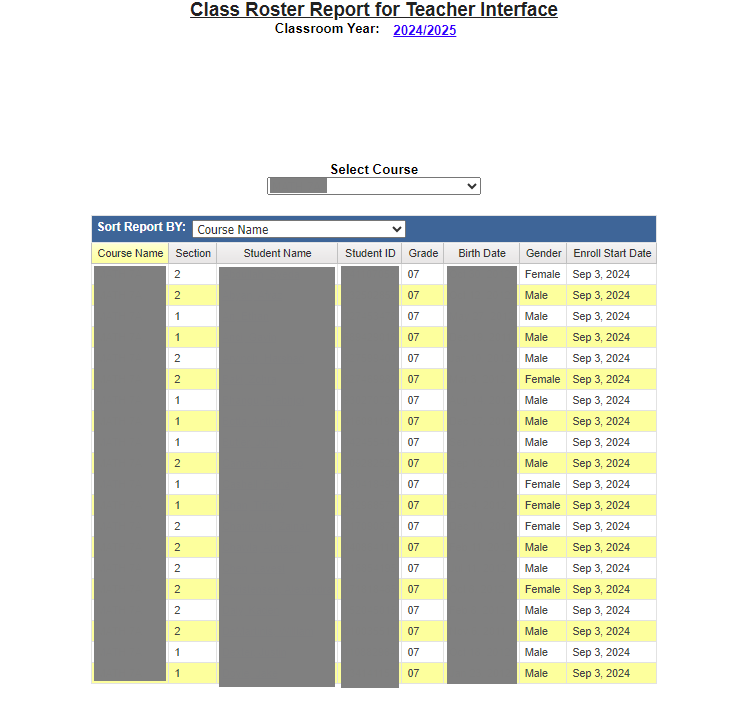
Classroom Rosters
|
This Report provides a student class roster for a specific teacher and course. Student class rosters are available for up to two years.
|
|
|
|
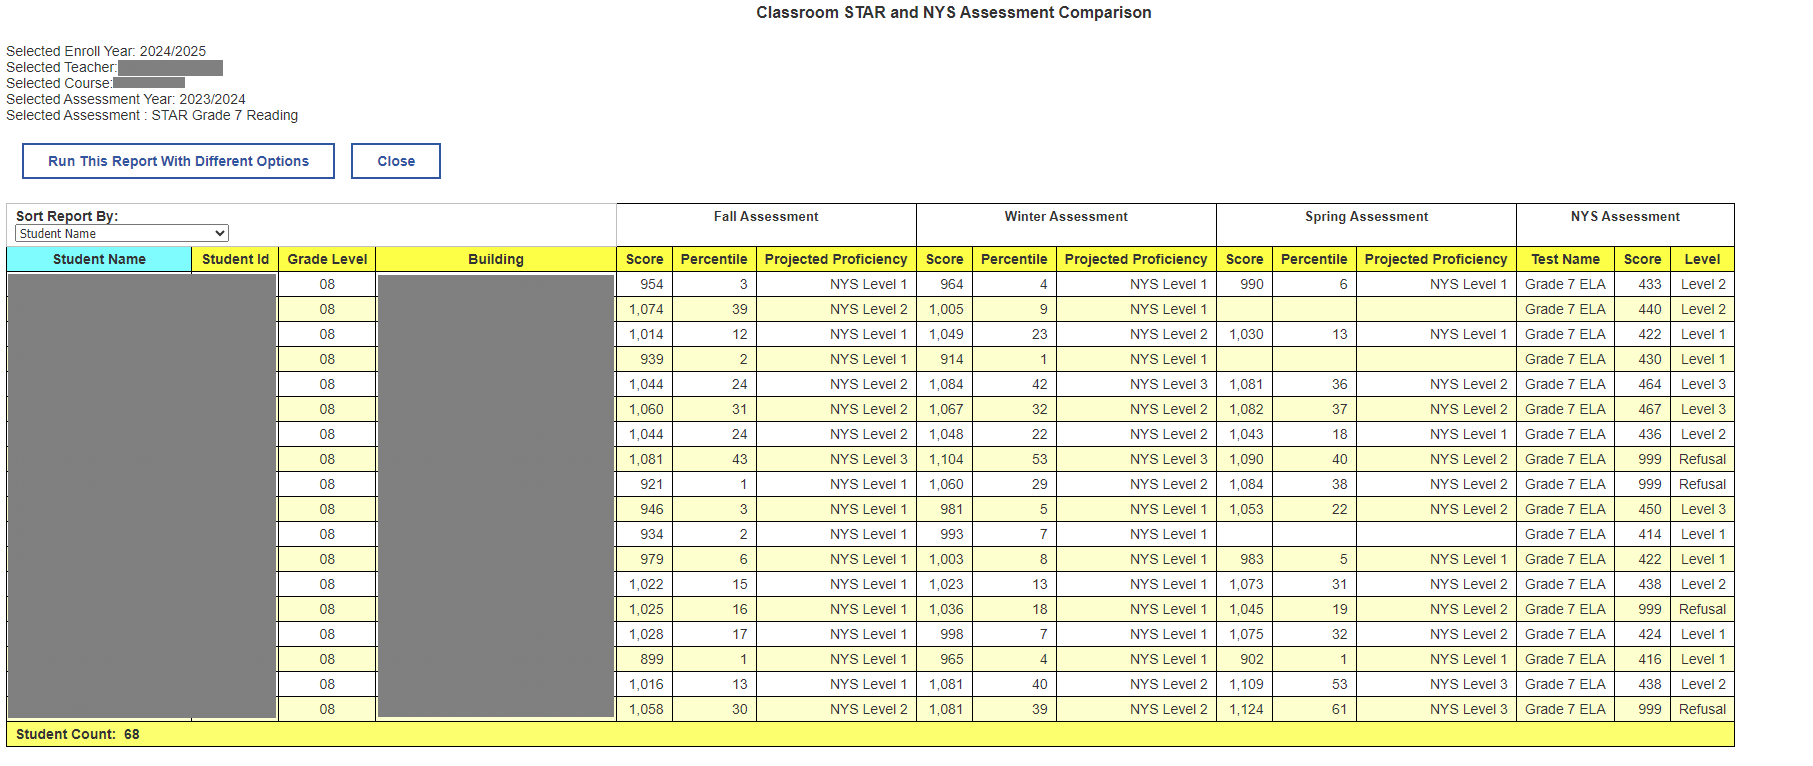
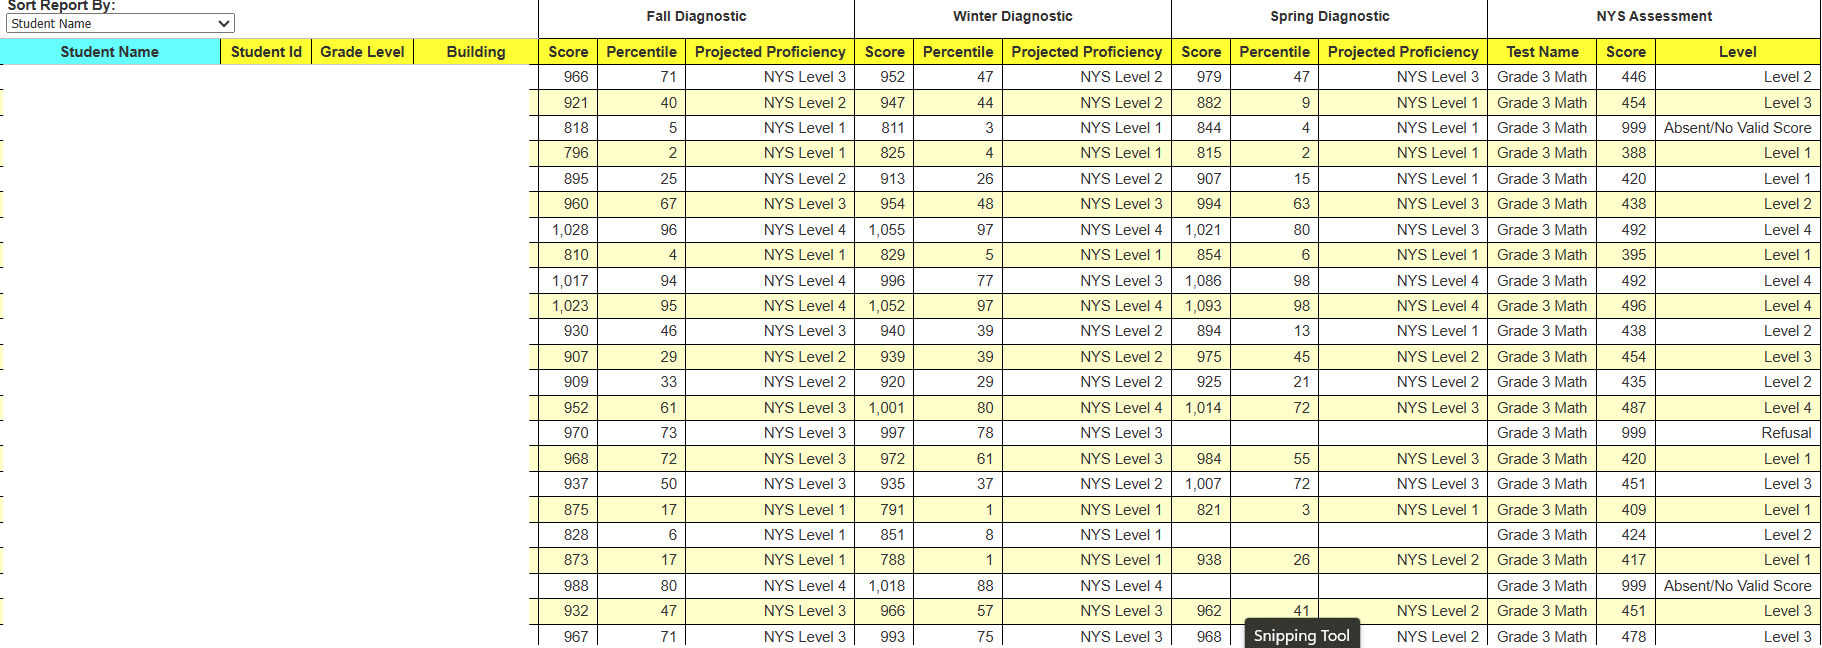
Classroom STAR and NYS Assessment Comparison
|
This report compares NYS projected proficiency levels for all students for each seasonal STAR assessment (Fall, Winter, Spring) along with the actual results of the official NYS 3-8 examination. Assessments from prior years have been "re-rostered" for a teacher's selected classroom.
|
|
|
|
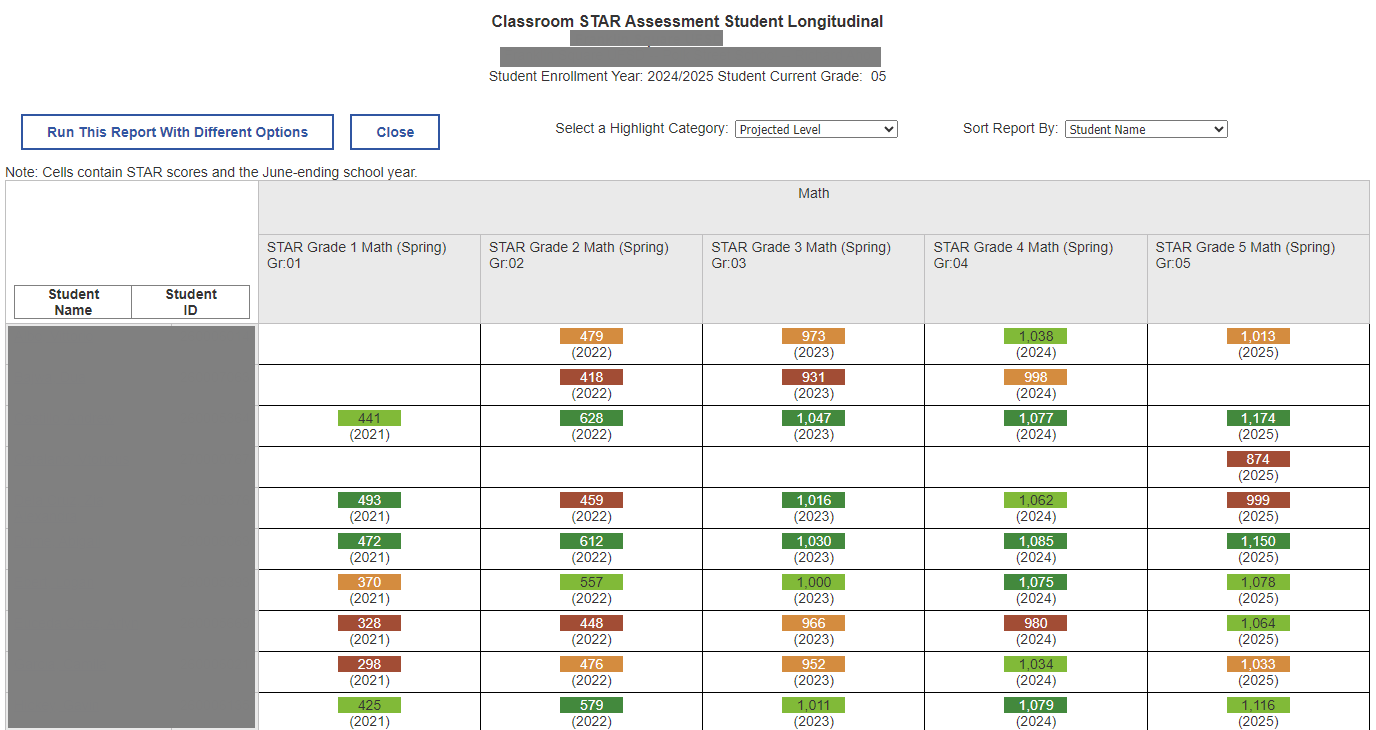
Classroom STAR Assessment Student Longitudinal
|
This report displays a list of all students and their complete historical STAR scores for the selected school year of enrollment. Data are grouped longitudinally by subject area.
|
|
|
|
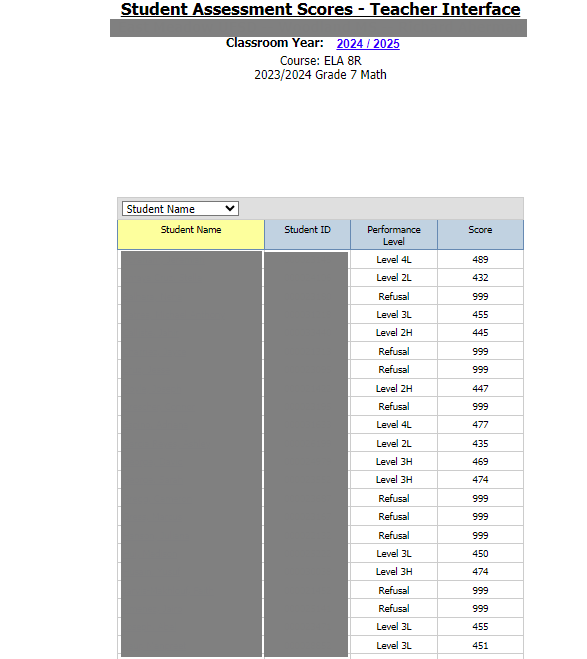
Classroom Student Assessment Scores
|
This report displays a list of students and their overall score on a particular assessment. Assessments from prior years have been "re-rostered" and aggregated for students in a teacher's selected class. This report gives a general overview of how students performed.
|
|
|
|
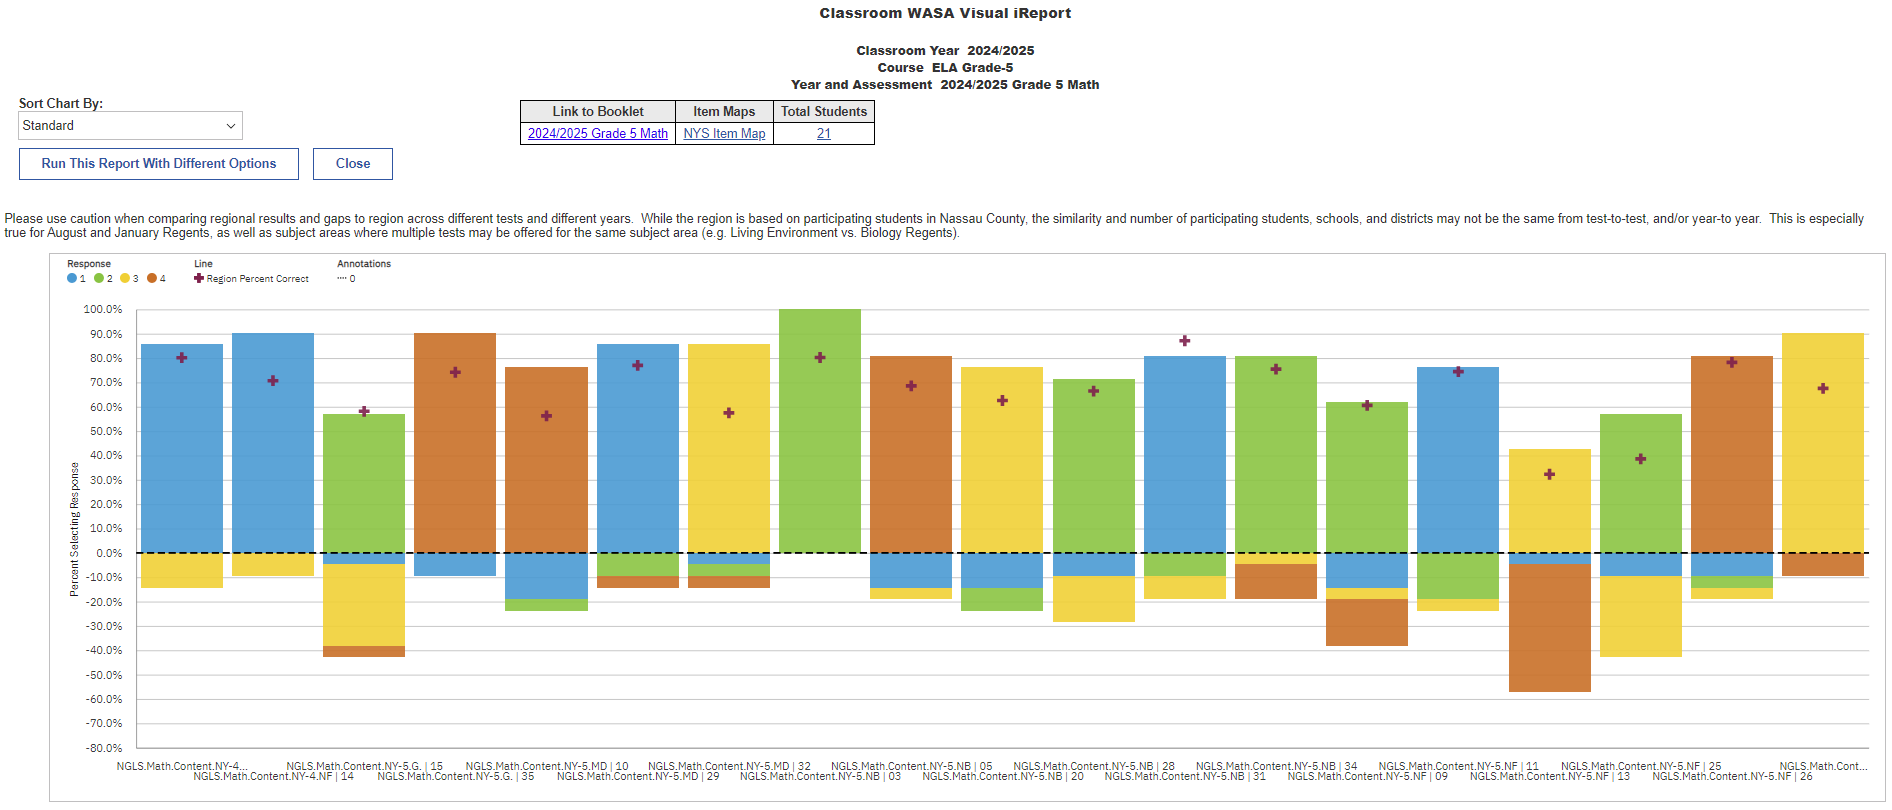
Classroom WASA Visual iReport
|
This Wrong Answer Summary Analysis (WASA) Visual iReport displays the distribution of all possible answer choices for each multiple-choice question. Correct responses appear above the 0% X-axis while incorrect responses appear below.
|
|
|
|
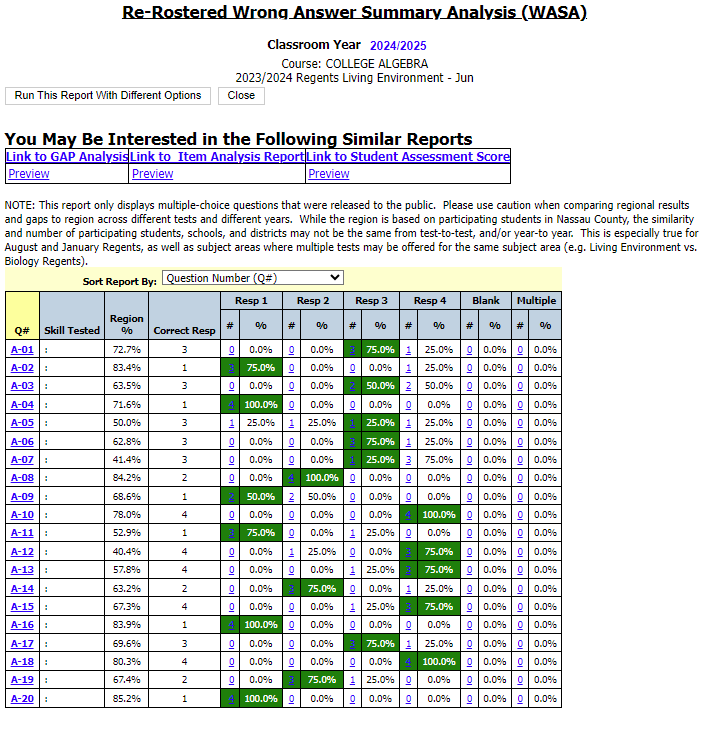
Classroom Wrong Answer Summary Analysis (WASA)
|
This Wrong Answer Summary Analysis (WASA) report displays the distribution of all possible answer choices for each multiple-choice question. Correct responses are highlighted in green. Only released questions are displayed for the 3-8 ELA and Math assessments. Assessments from prior years have been "re-rostered" and aggregated for students in a teacher's selected class.
|
|
|
|
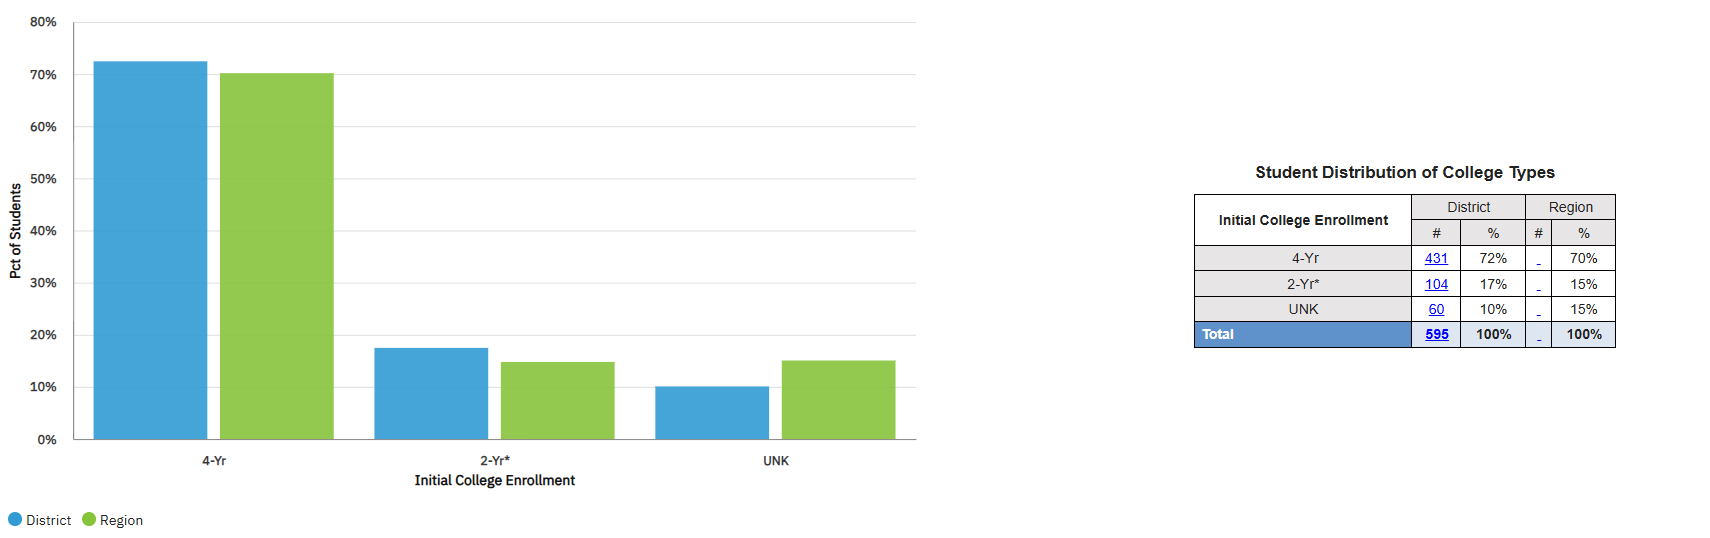
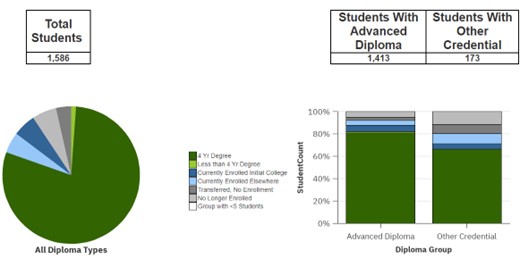
College Enrollment and Diploma Type
|
This summary report compares aggregated diploma types of high school graduates to actual initial college enrollments. Initial college enrollments may or may not be immediately following high school graduation. Double clicking on the bar chart columns or clicking on blue-highlighted counts in the table will drill-through to a student list. Regional comparisons beginning with the 2005 school year are available in both the charts and tables. This report has been implemented using the new "tabbed" feature of Cognos 11 where tabs appear at the top of the page allowing users to change data views quickly.
|
|
|
|
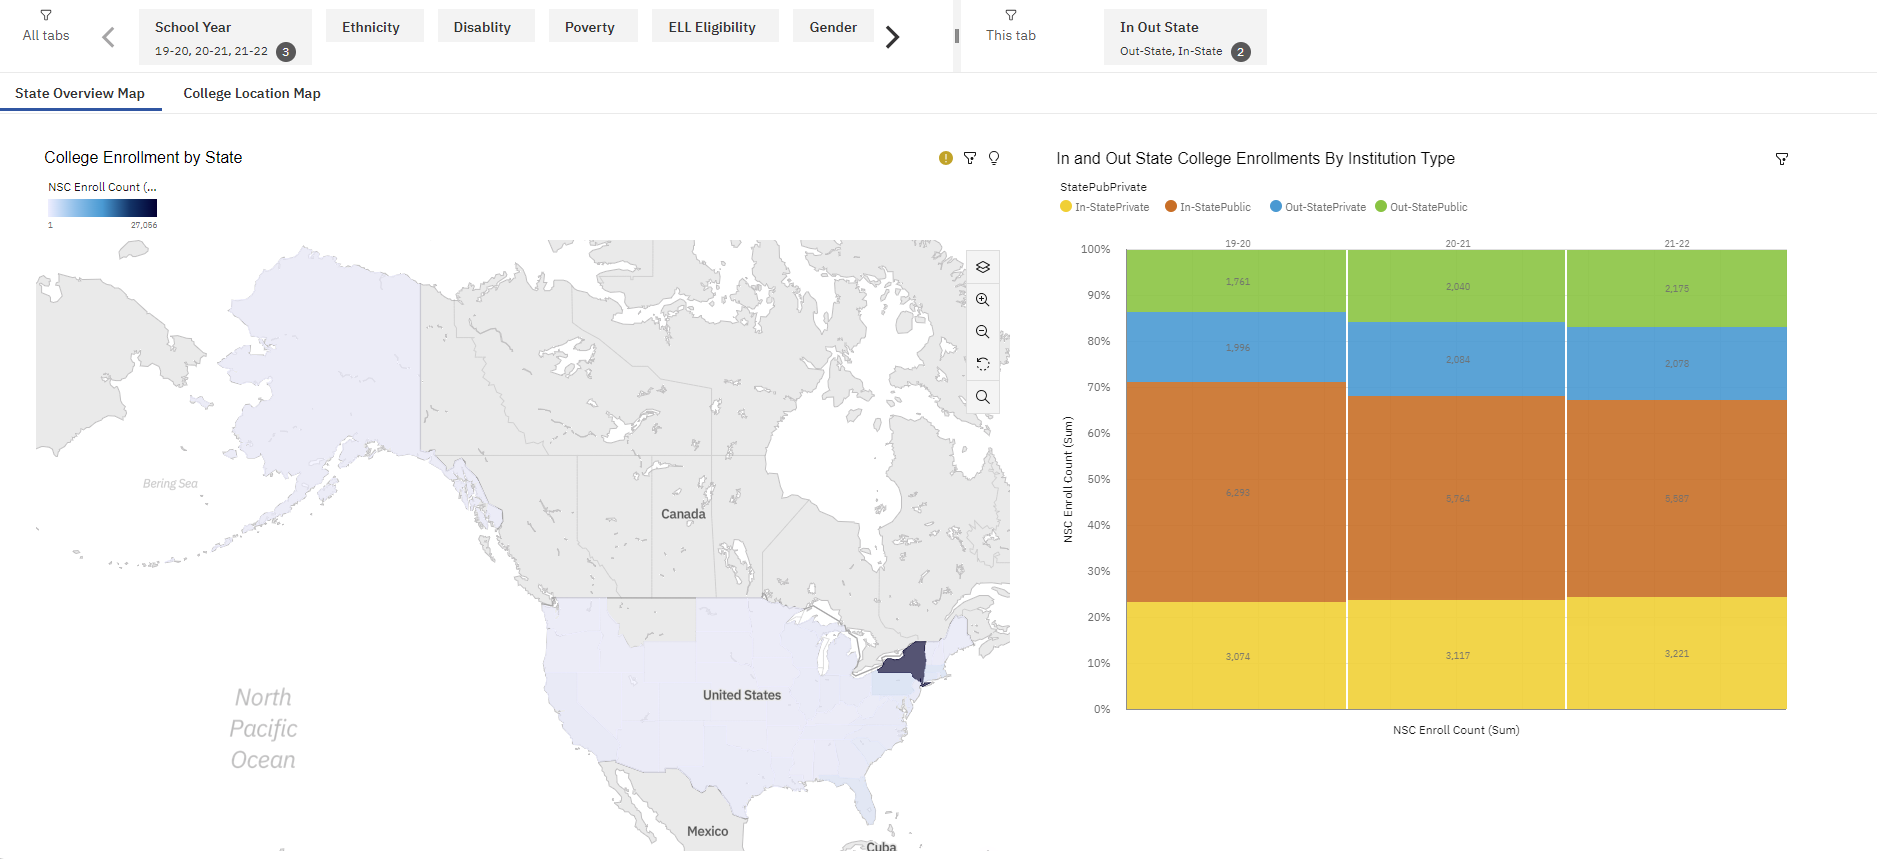
College Enrollment Map Dashboard
|
This dashboard shows the college enrollment of nassau students by US state in a geographic map, as well as breaking down the enrollments by institution in a bar chart.
|
|
|
|
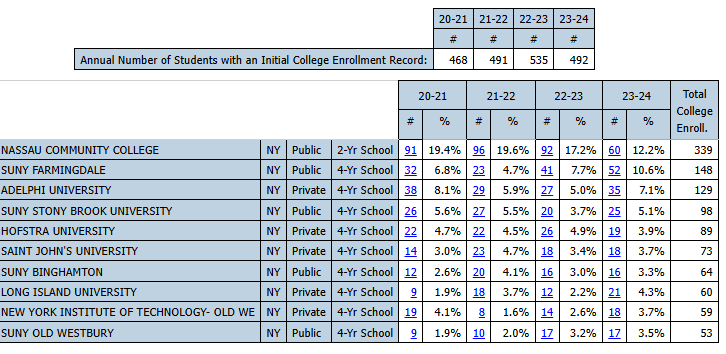
Colleges with Highest Initial Enrollment Over Time
|
This summary report ranks colleges/universities by largest initial enrollment over multiple years. The report may be sorted by overall rank (default) or alphabetically by college name. Clicking the blue-highlighted counts will drill-through to a list of all students who enrolled in that college. A complete detailed report containing each enrollment record can be obtained by drilling from the student list to the Student College Enrollment Detail report.
|
|
|
|
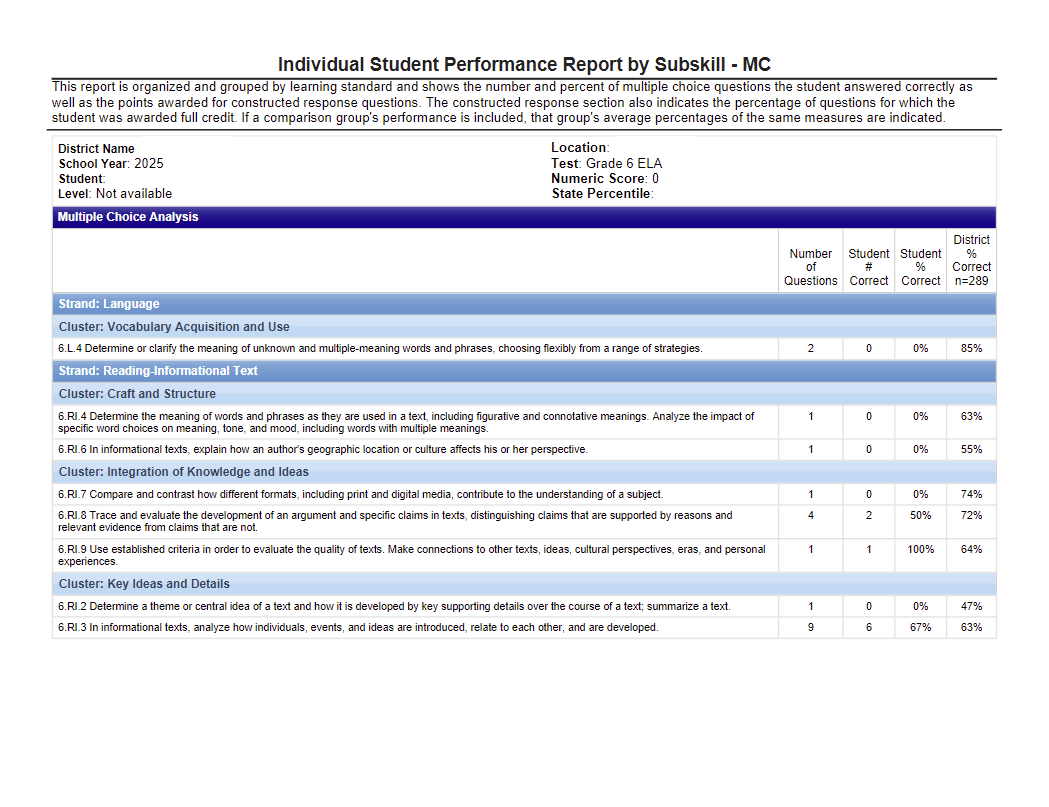
Common View #1 - Individual Performance
|
This report shows student performance on each assessment question. The information is organized and grouped by learning standard. The number of points the student was awarded for each question is indicated.
|
|
|
|
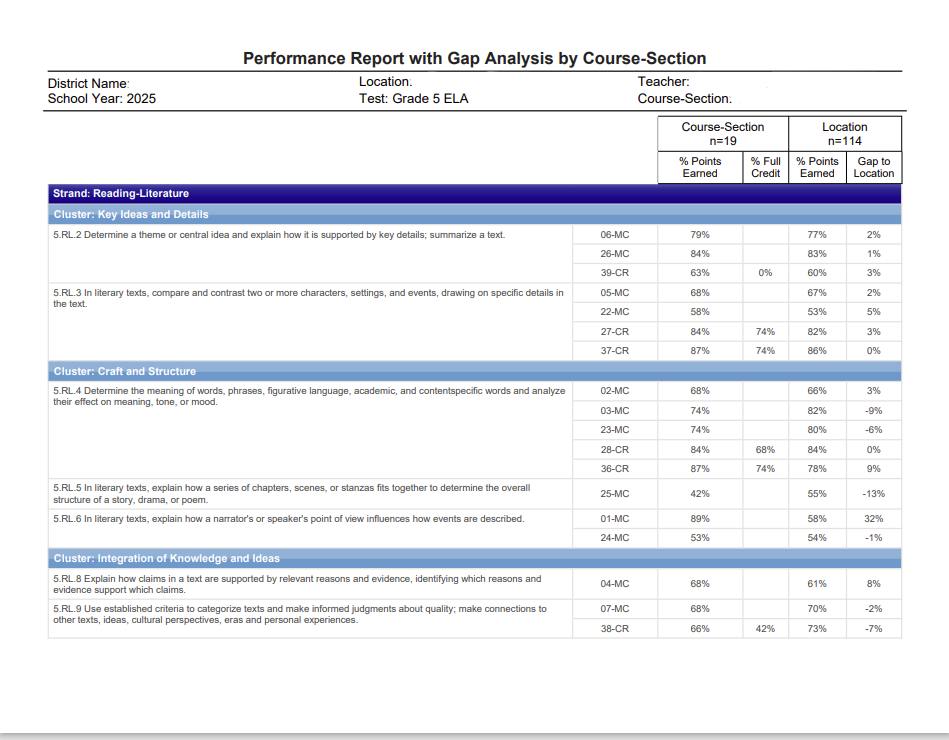
Common View #2 - Performance Report with Gap Analysis by Course-Section
|
This report shows student performance on each assessment aggregated by course and section. The information is organized and grouped by learning standard. The number of points the course section's group of students was awarded for each question is indicated.
|
|
|
|
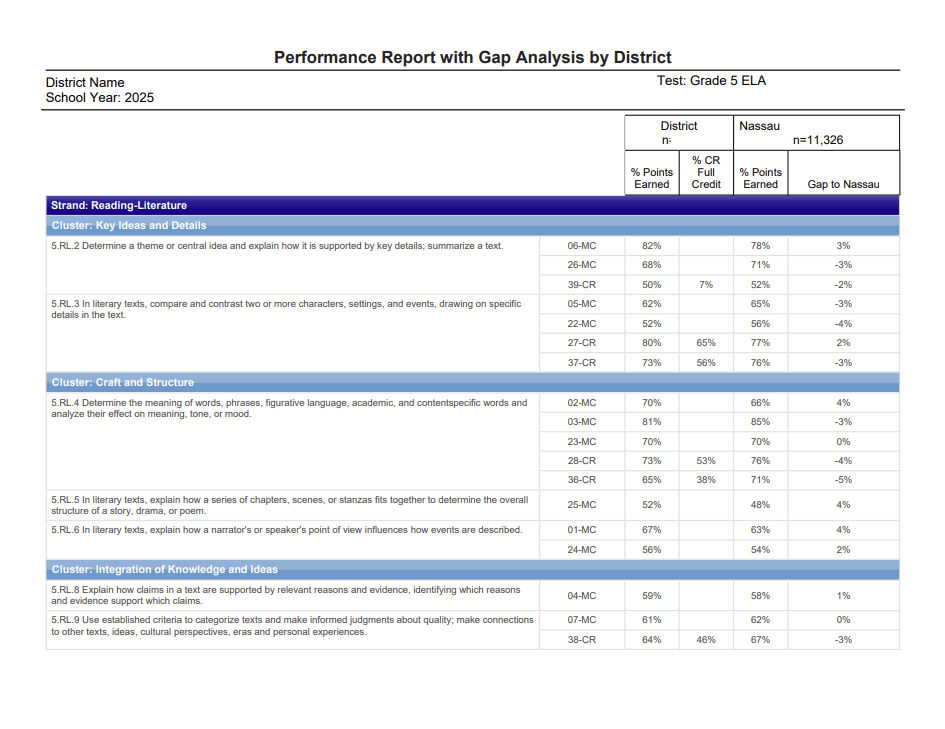
Common View #2 - Performance Report with Gap Analysis by District
|
This report shows student performance on each assessment aggregated by district. The information is organized and grouped by learning standard. The number of points the district's group of students was awarded for each question is indicated.
|
|
|
|
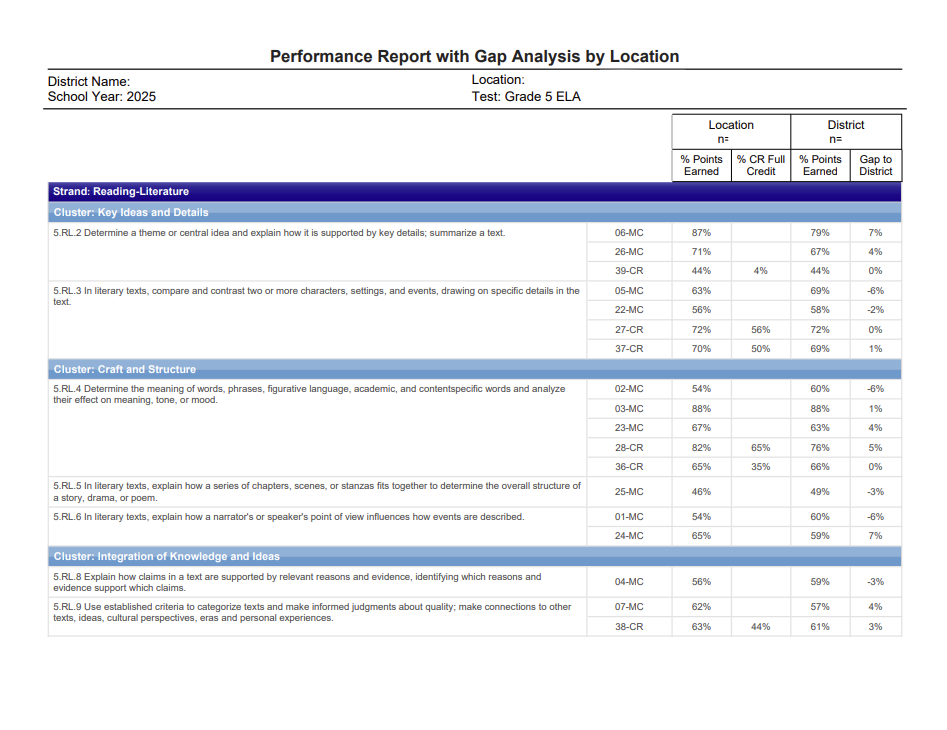
Common View #2 - Performance Report with Gap Analysis by Location
|
This report shows student performance on each assessment aggregated by location. The information is organized and grouped by learning standard. The number of points the location's group of students was awarded for each question is indicated.
|
|
|
|
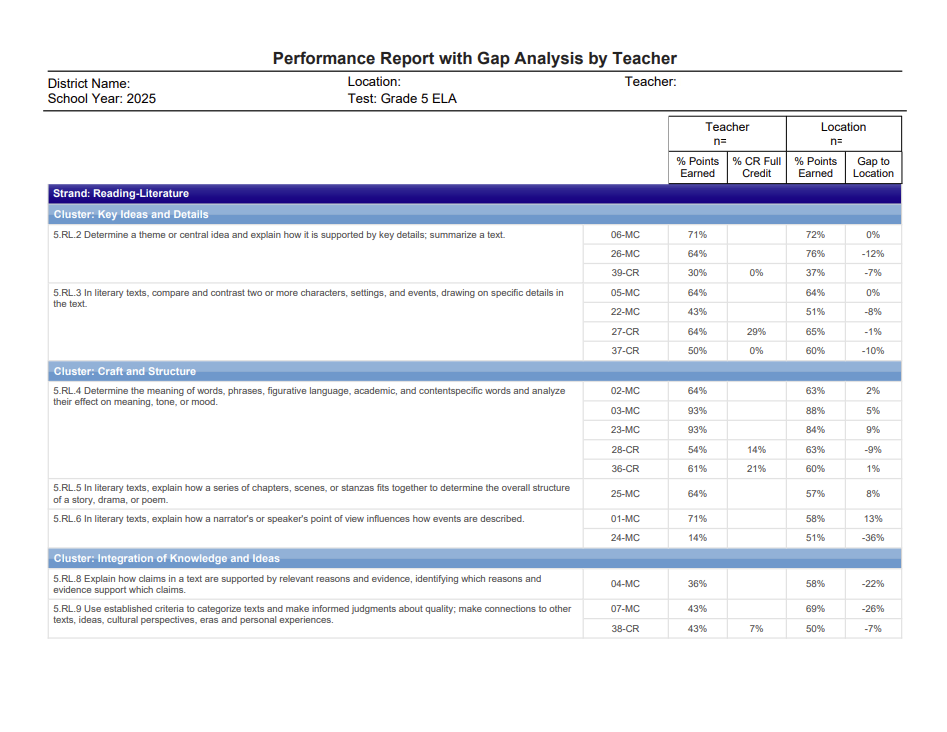
Common View #2 - Performance Report with Gap Analysis by Teacher
|
This report shows student performance on each assessment aggregated by teacher. The information is organized and grouped by learning standard. The number of points the teacher's group of students was awarded for each question is indicated.
|
|
|
|
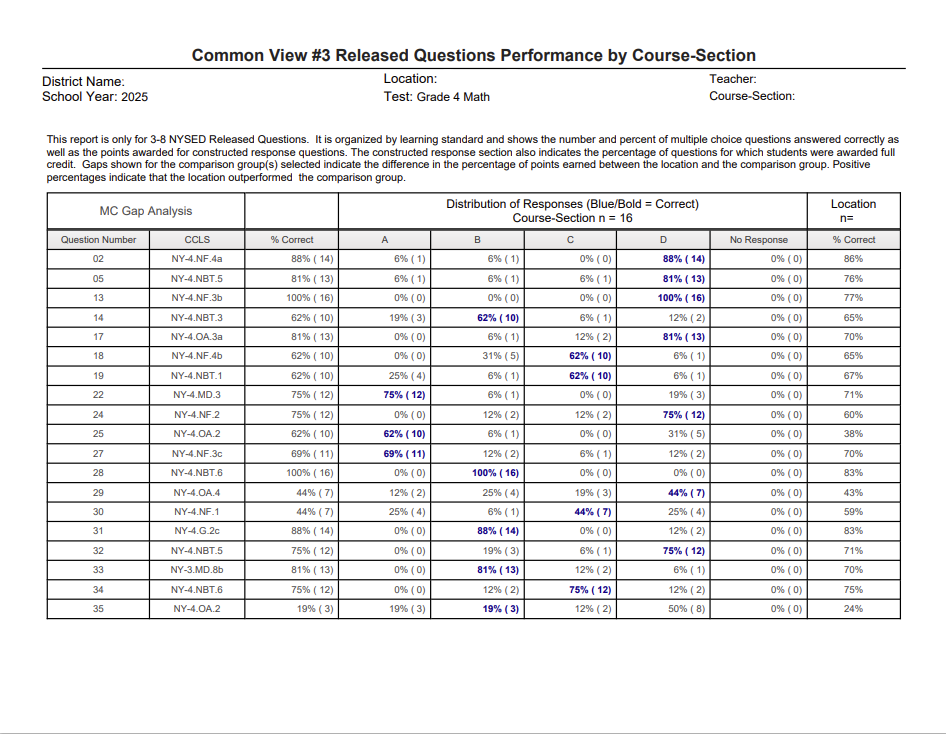
Common View #3 Released Questions Performance by Course-Section
|
This report is only for 3-8 NYSED Released Questions. It is organized by learning standard and shows the number and percent of multiple choice questions answered correctly as well as the points awarded for constructed response questions for students in a course section.
|
|
|
|
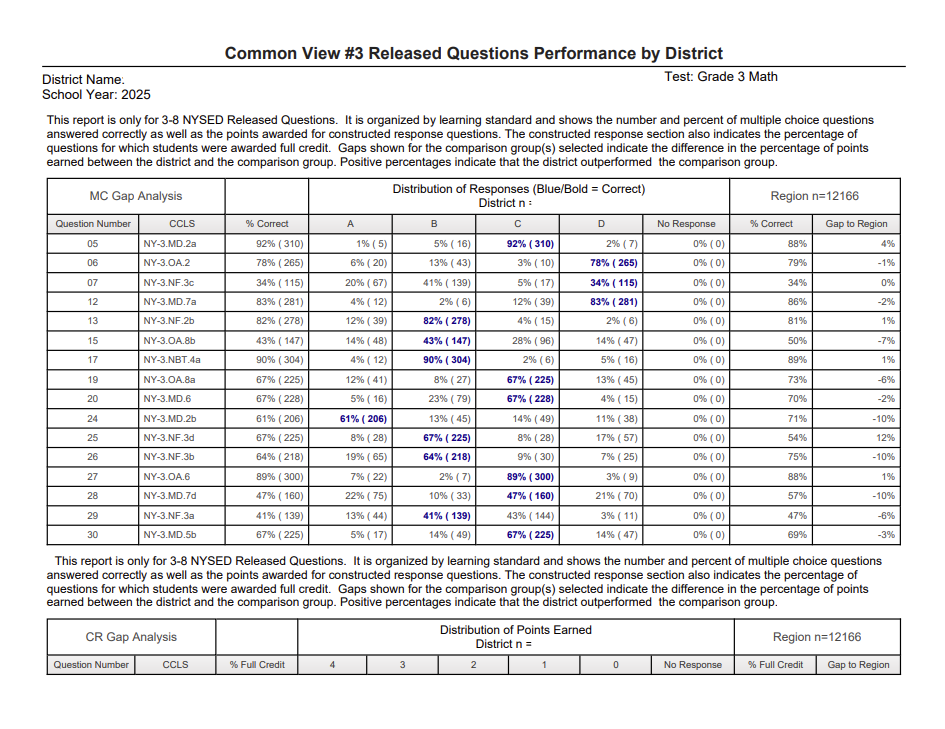
Common View #3 Released Questions Performance by District
|
This report is only for 3-8 NYSED Released Questions. It is organized by learning standard and shows the number and percent of multiple choice questions answered correctly as well as the points awarded for constructed response questions for all students in a district. section.
|
|
|
|
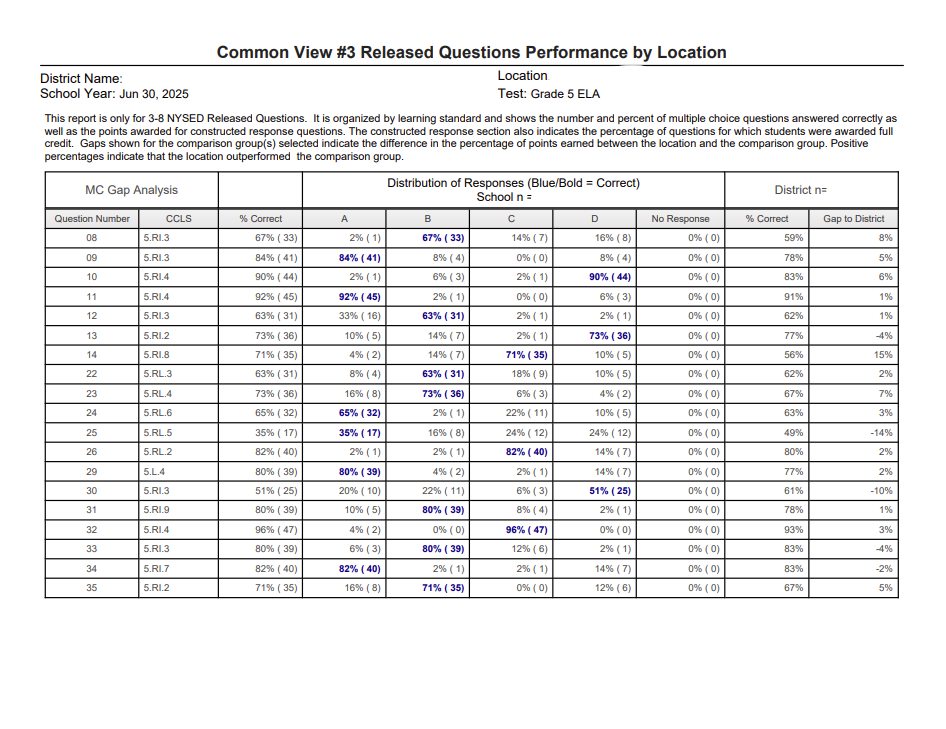
Common View #3 Released Questions Performance by Location
|
This report is only for 3-8 NYSED Released Questions. It is organized by learning standard and shows the number and percent of multiple choice questions answered correctly as well as the points awarded for constructed response questions for students at a location.
|
|
|
|
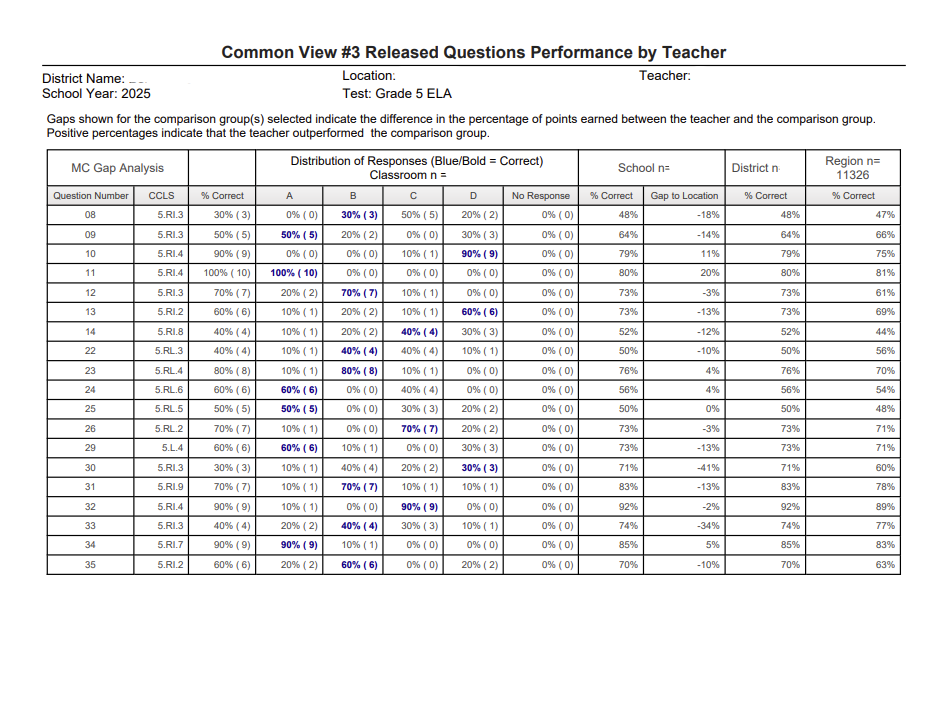
Common View #3 Released Questions Performance by Teacher
|
This report is only for 3-8 NYSED Released Questions. It is organized by learning standard and shows the number and percent of multiple choice questions answered correctly as well as the points awarded for constructed response questions for all students under a teacher.
|
|
|
|
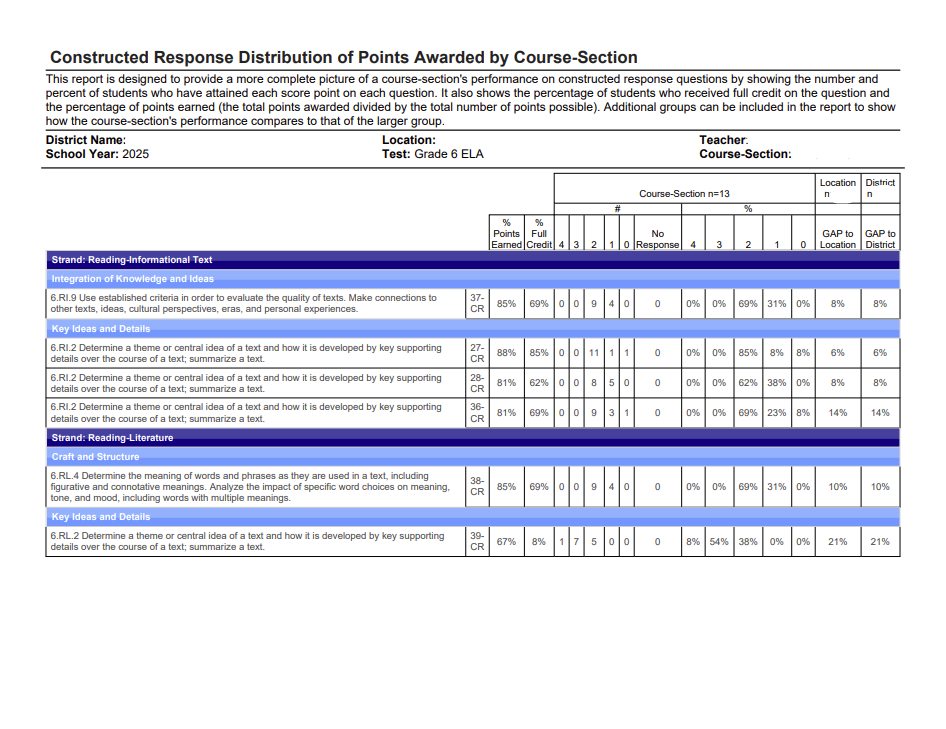
Common View #4 - Constructed Response Distribution of Points Awarded by Course-Section
|
This report is designed to provide a more complete picture of a course-section's performance on constructed response questions by showing the number and percent of students who have attained each score point on each question.
|
|
|
|
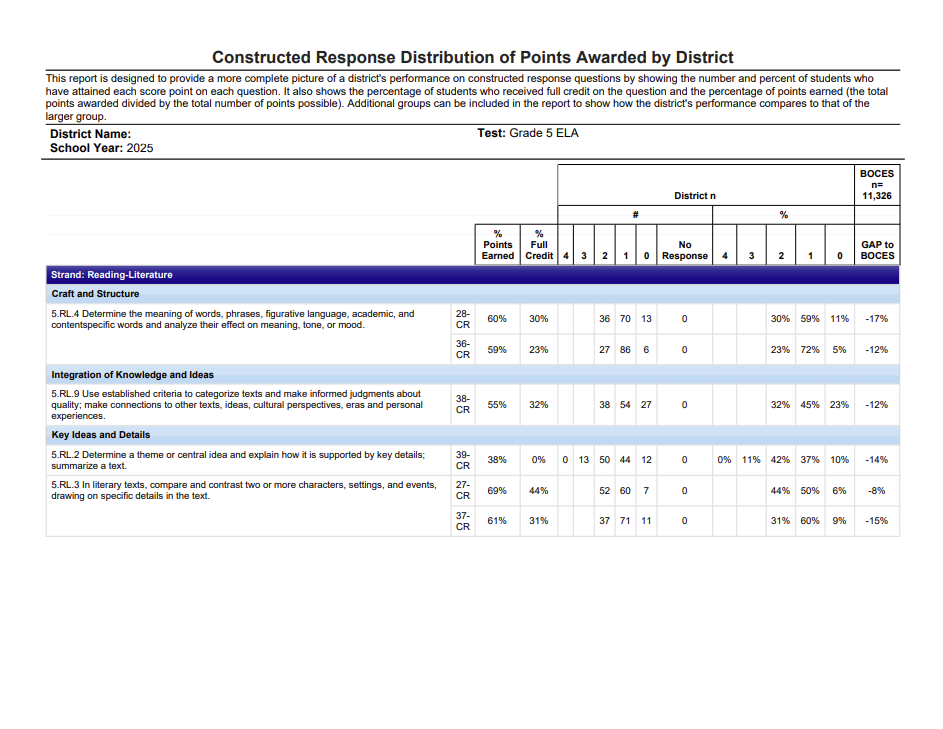
Common View #4 - Constructed Response Distribution of Points Awarded by District
|
This report is designed to provide a more complete picture of a district's performance on constructed response questions by showing the number and percent of students who have attained each score point on each question.
|
|
|
|
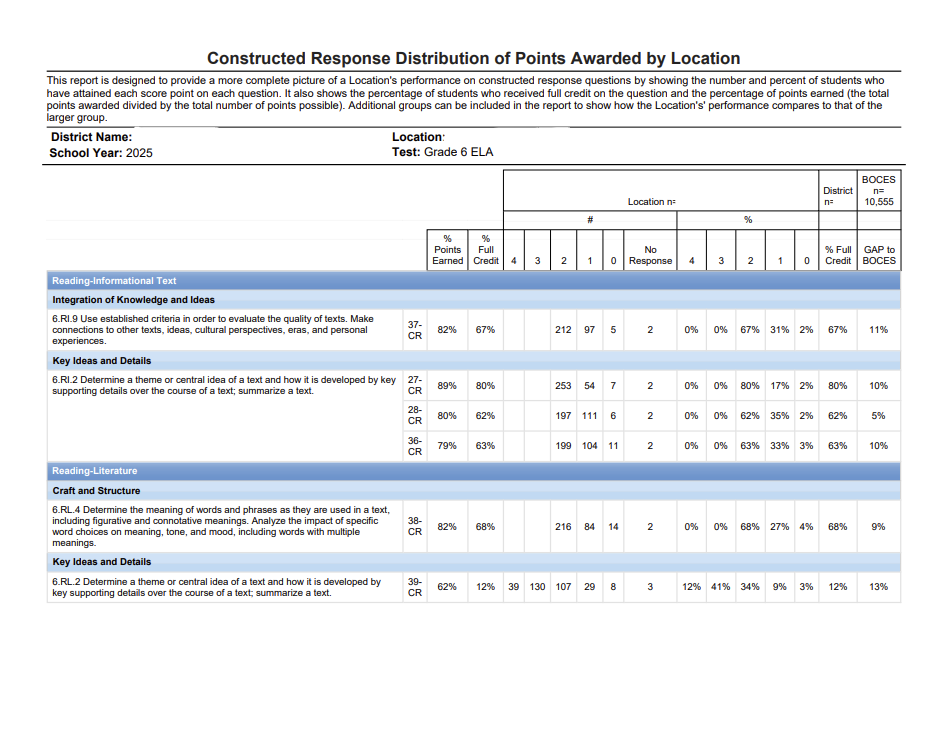
Common View #4 - Constructed Response Distribution of Points Awarded by Location
|
This report is designed to provide a more complete picture of a location's performance on constructed response questions by showing the number and percent of students who have attained each score point on each question.
|
|
|
|
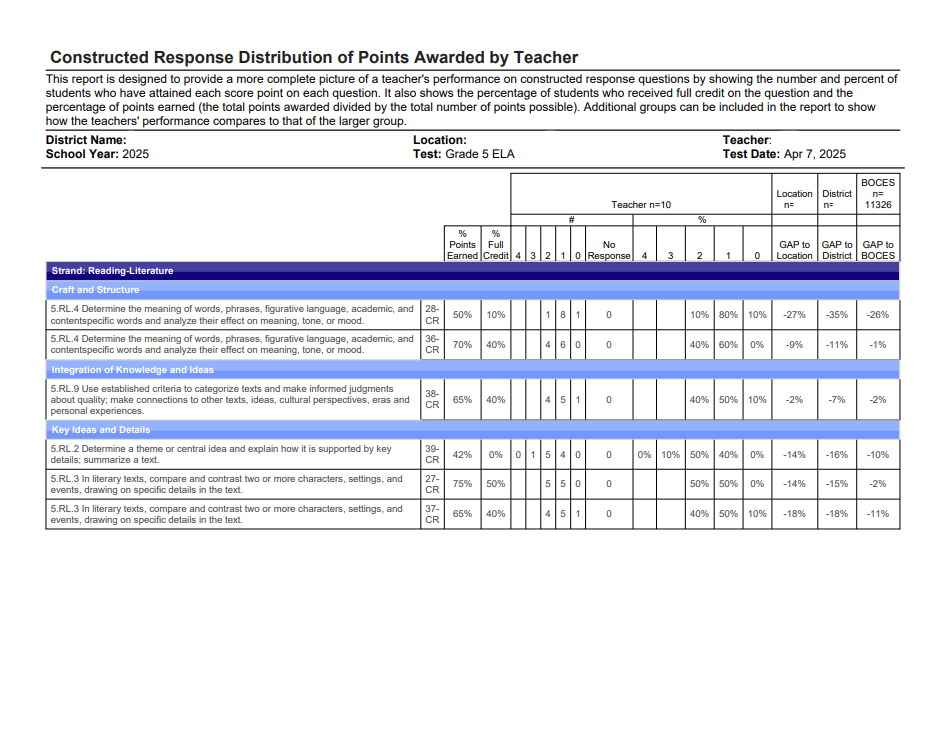
Common View #4 - Constructed Response Distribution of Points Awarded by Teacher
|
This report is designed to provide a more complete picture of a teacher's students performance on constructed response questions by showing the number and percent of students who have attained each score point on each question.
|
|
|
|
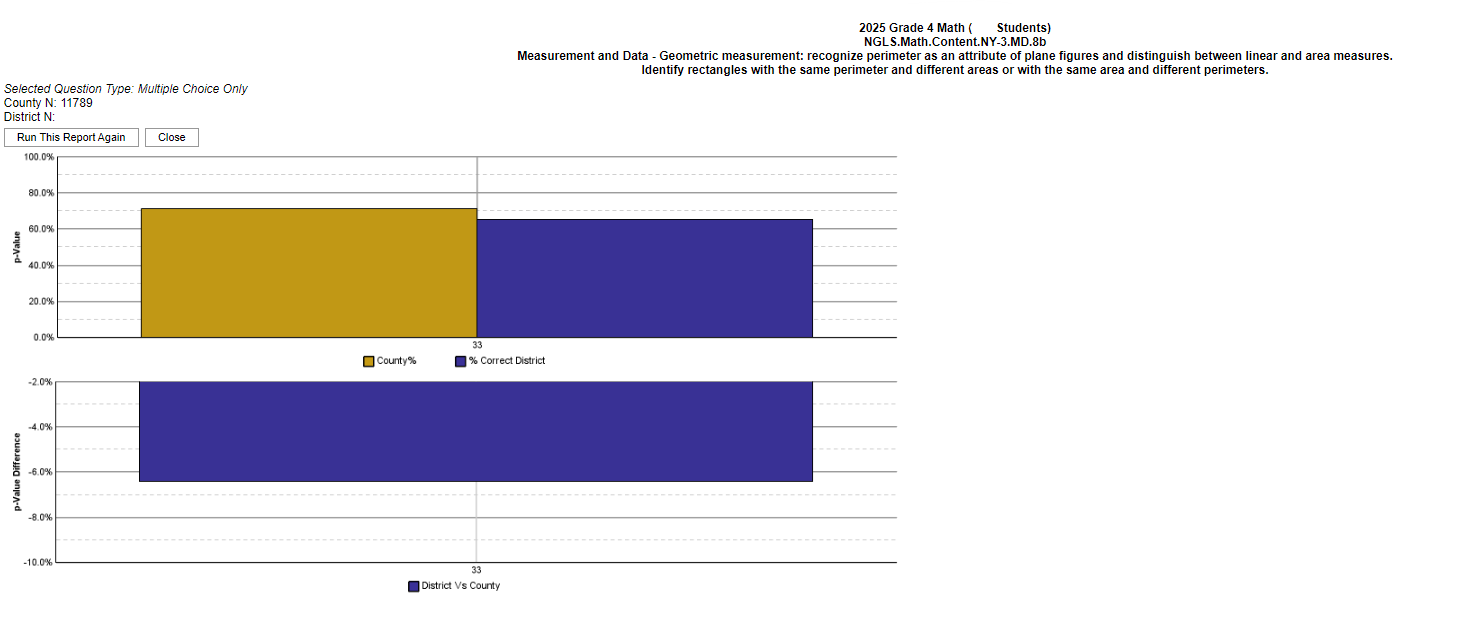
Common View #5 - P Value Report for Common Data Views - NYS
|
Charts that show percent correct for each question on an assessment and compares results for school buildings, districts and the region
|
|
|
|
Comparison of 3-8 Assessment Scores Across Districts
|
Compares NYS 3-8 ELA and Math assessment scores across multiple school districts. Based on public data from NYSED Report Card.
|
|
|
|
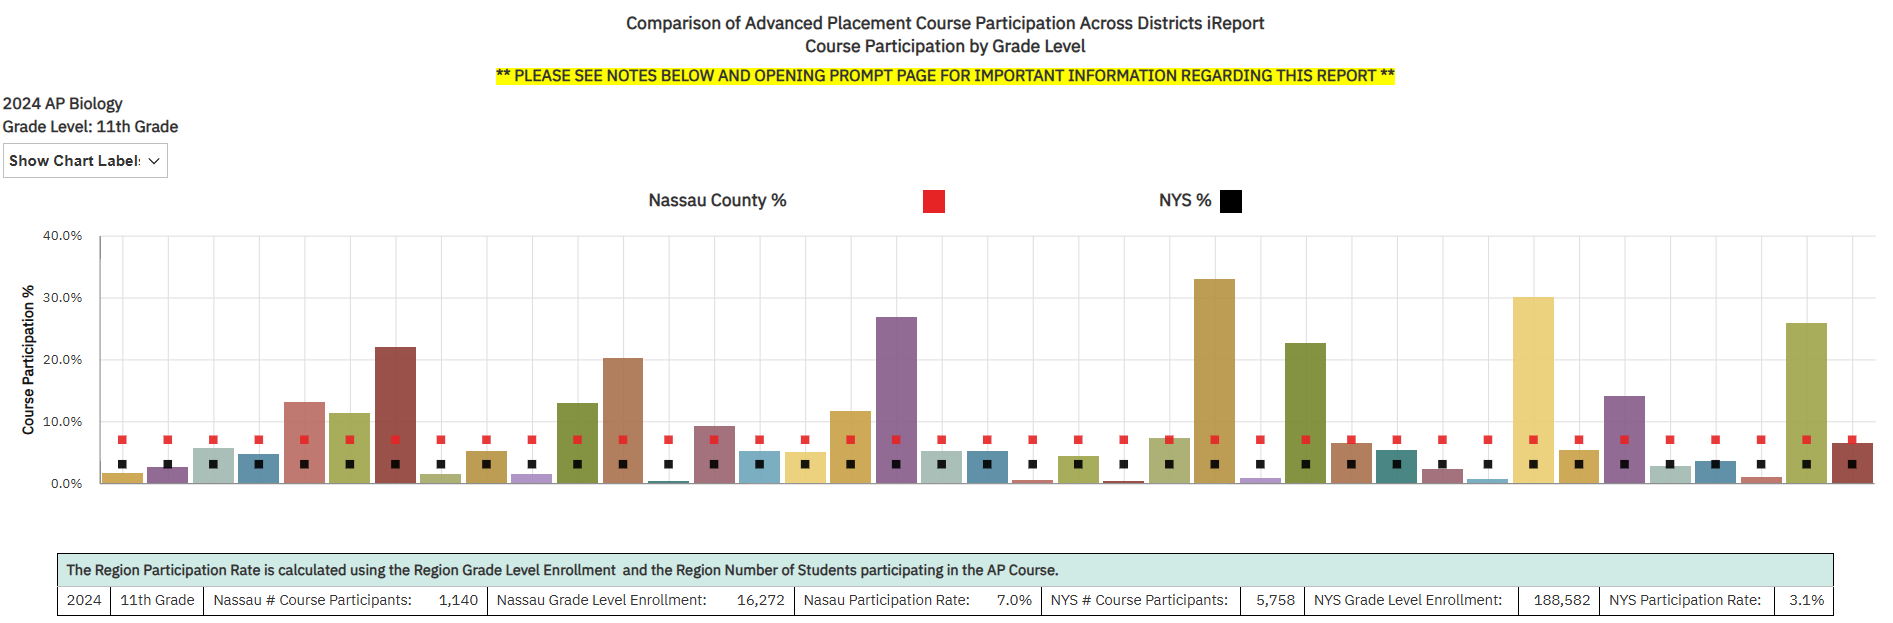
Comparison of Advanced Placement Course Participation Across Districts iReport
|
Compares Advanced Placement (AP) course enrollment across multiple school districts. Based on public data from NYSED Report Card.
|
|
|
|
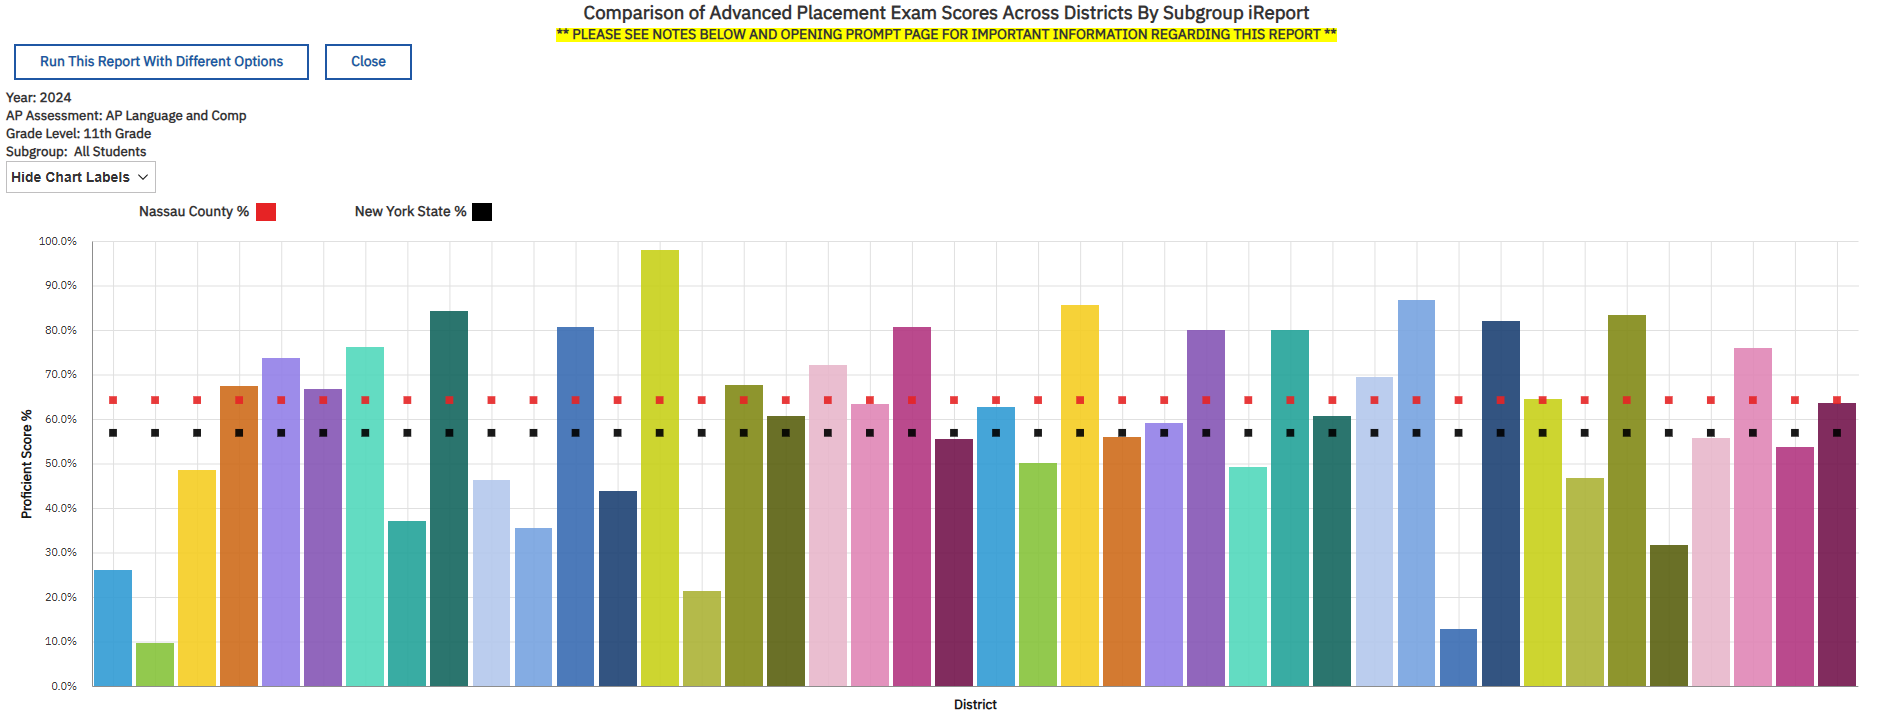
Comparison of Advanced Placement Exam Scores Across Districts By Subgroup iReport
|
Compares Advanced Placement (AP) proficency (scores 3+) across multiple school districts. Based on public data from NYSED Report Card.
|
|
|
|
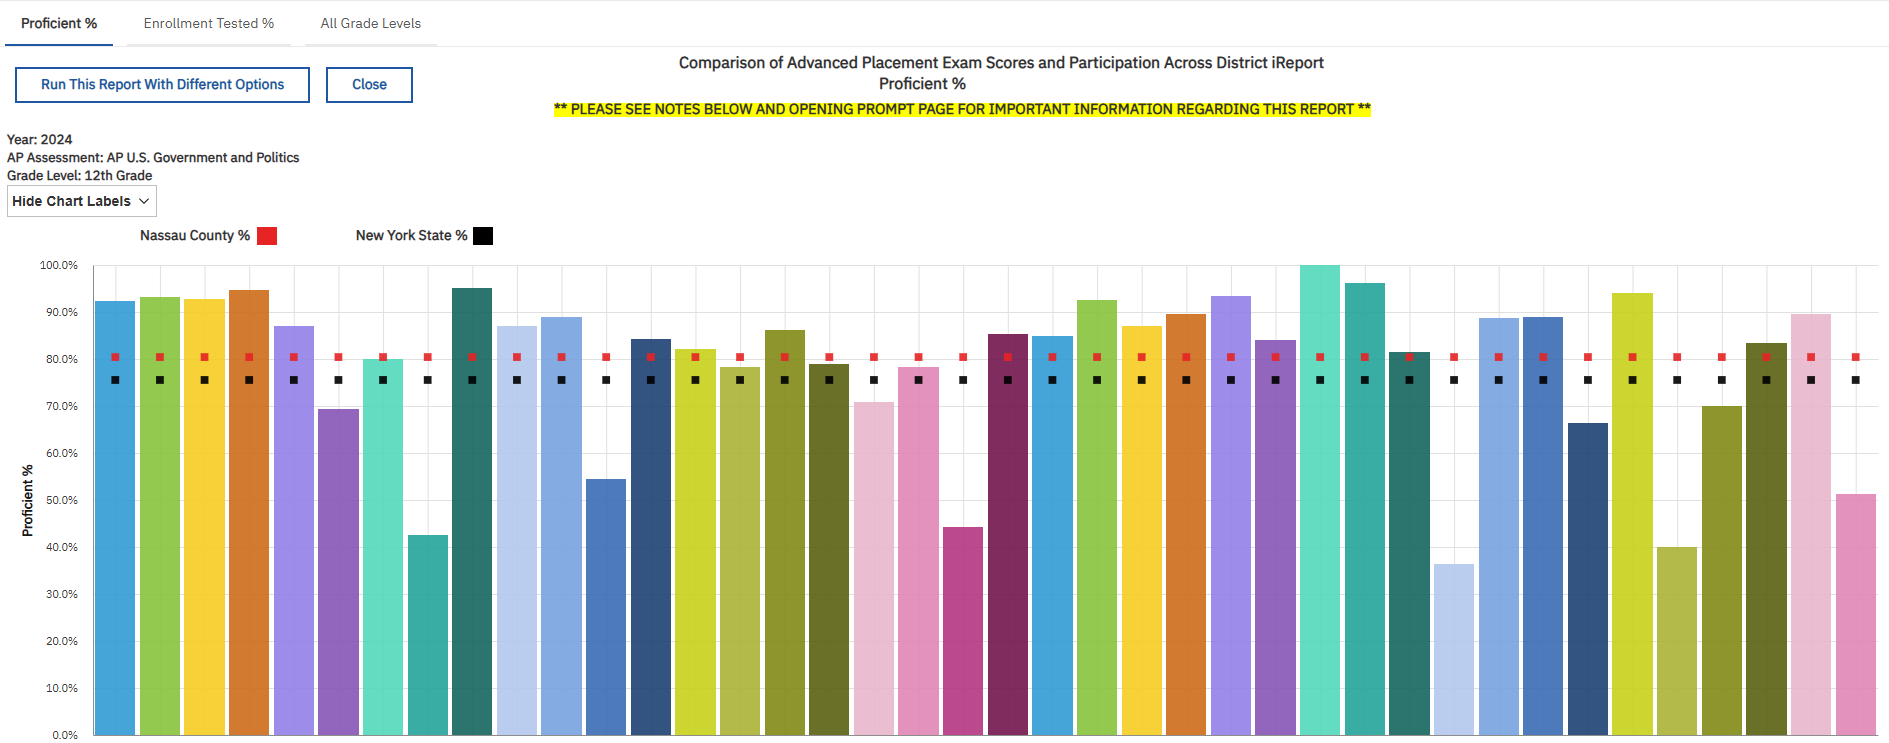
Comparison of Advanced Placement Exam Scores and Participation Across District iReport
|
Multi-tabbed report showing both AP exam scores and AP course participation. Comparison to all Nassau County public school districts. Based on public data from NYSED Report Card.
|
|
|
|
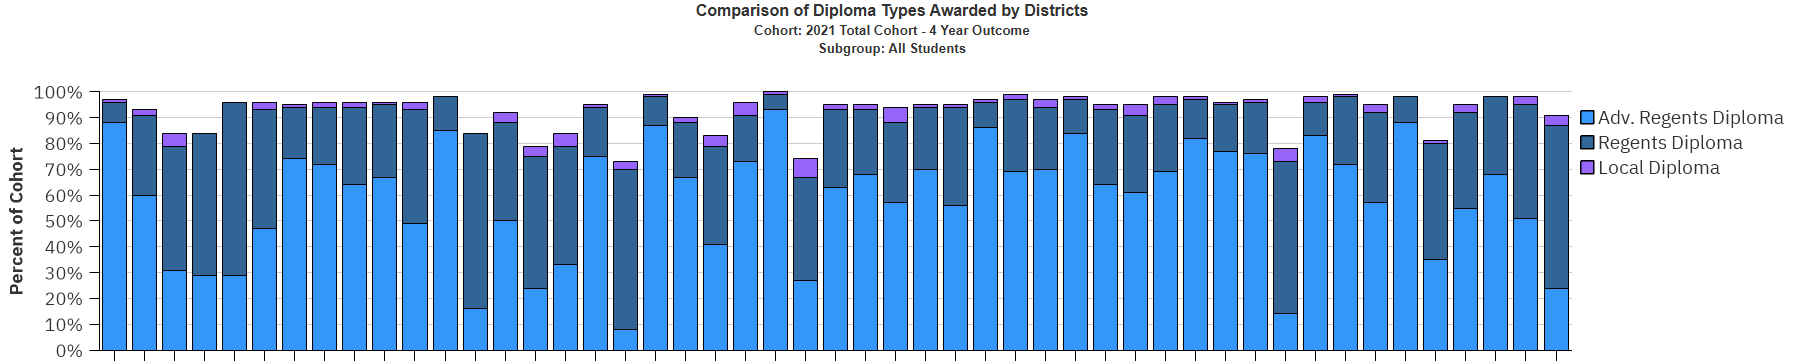
Comparison of Diploma Types Awarded by Districts
|
Compares diploma types awarded by individual Nassau County public school districts. Based on public data from NYSED Report Card.
|
|
|
|
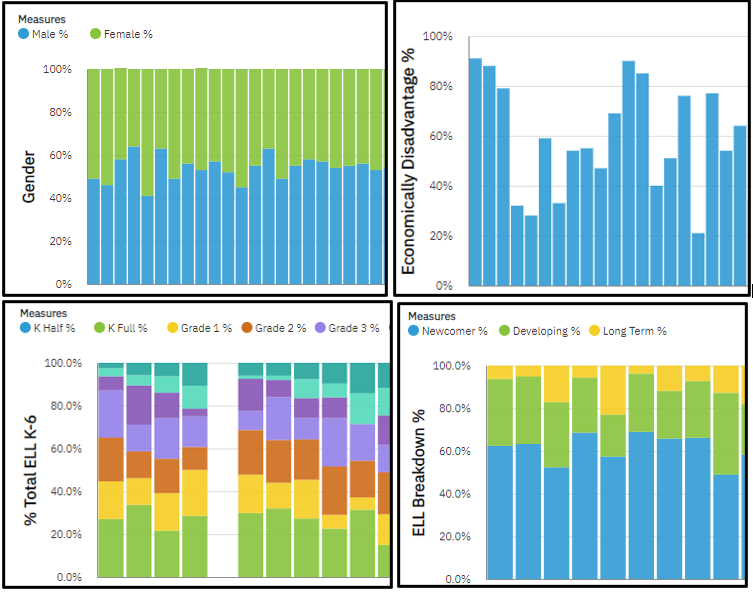
Comparison of English Language Learners Across Districts iReport
|
Multi-tabbed report comparing Nassau County public school district ELL populations disaggregated by various subgroups. Based on public data from the NYSED Report Card.
|
|
|
|
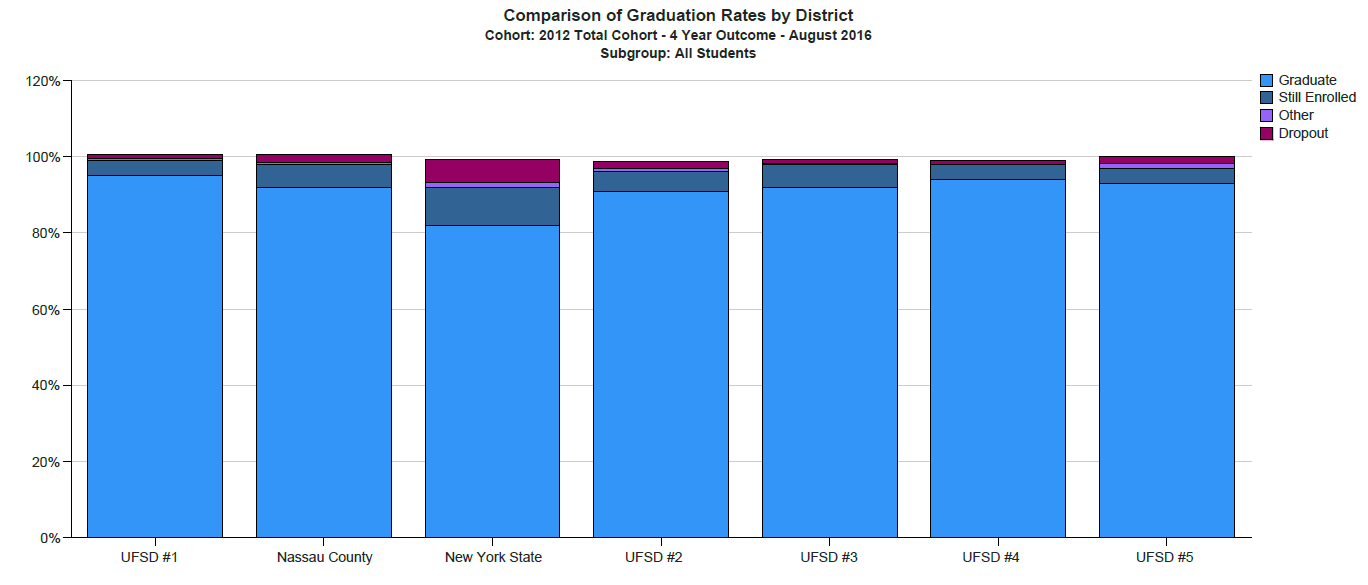
Comparison of Graduation Rates by District
|
Compares graduation rates for Nassau County public school districts. Based on public data from NYSED Report Card.
|
|
|
|
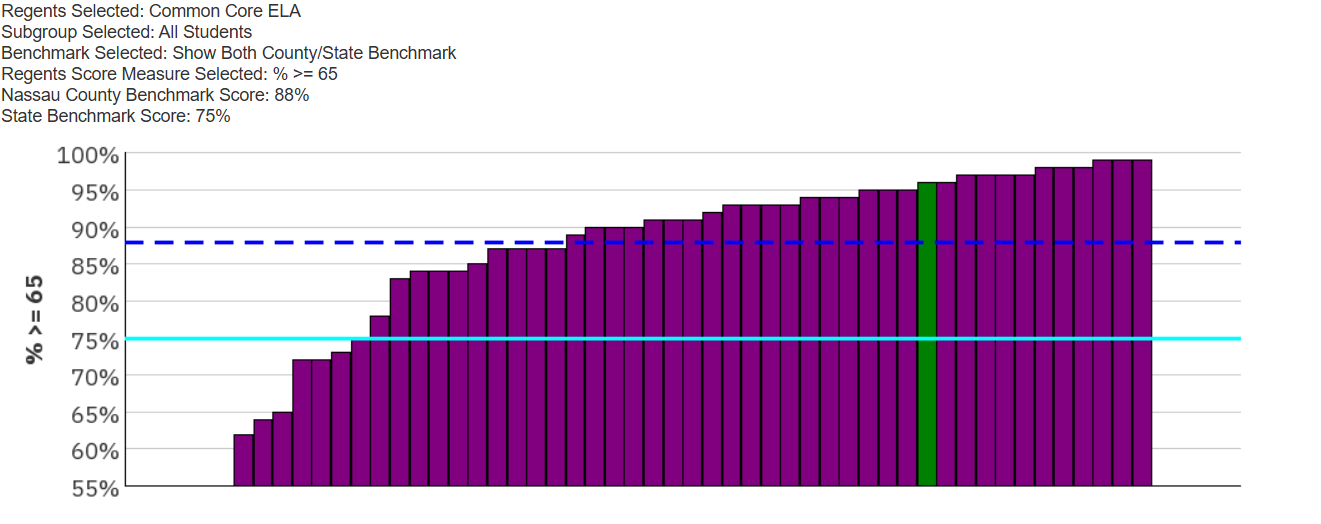
Comparison of Regents Scores Across Districts
|
Compares Regents assessment scores across multiple school districts. Based on public data from NYSED Report Card.
|
|
|
|
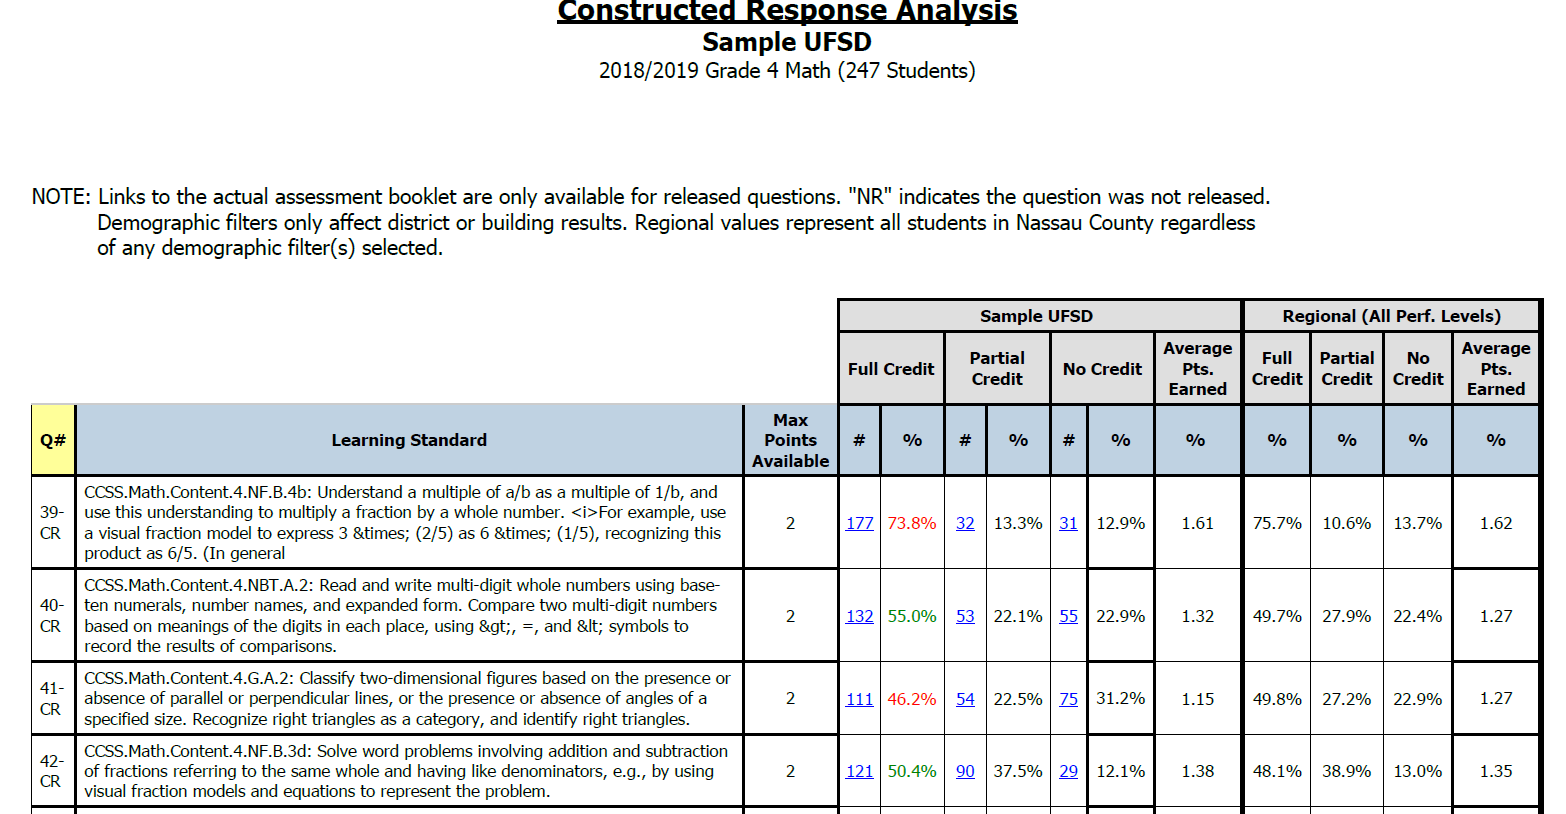
Constructed Response Analysis
|
This report examines the number and percent of students receiving full credit, partial credit and no credit on all constructed response questions for the selected assessment. Comparisons to the region (if available) are included.
|
|
|
|
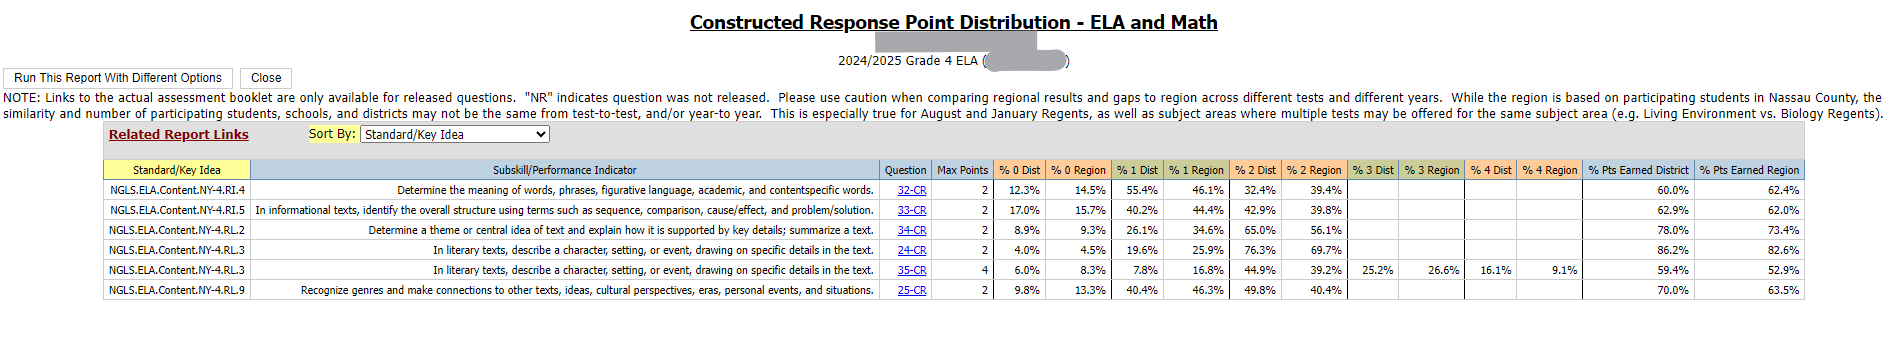
Constructed Response Point Distribution - ELA and Math
|
Displays the percent of students at each point level for all constructed response questions.
|
|
|
|
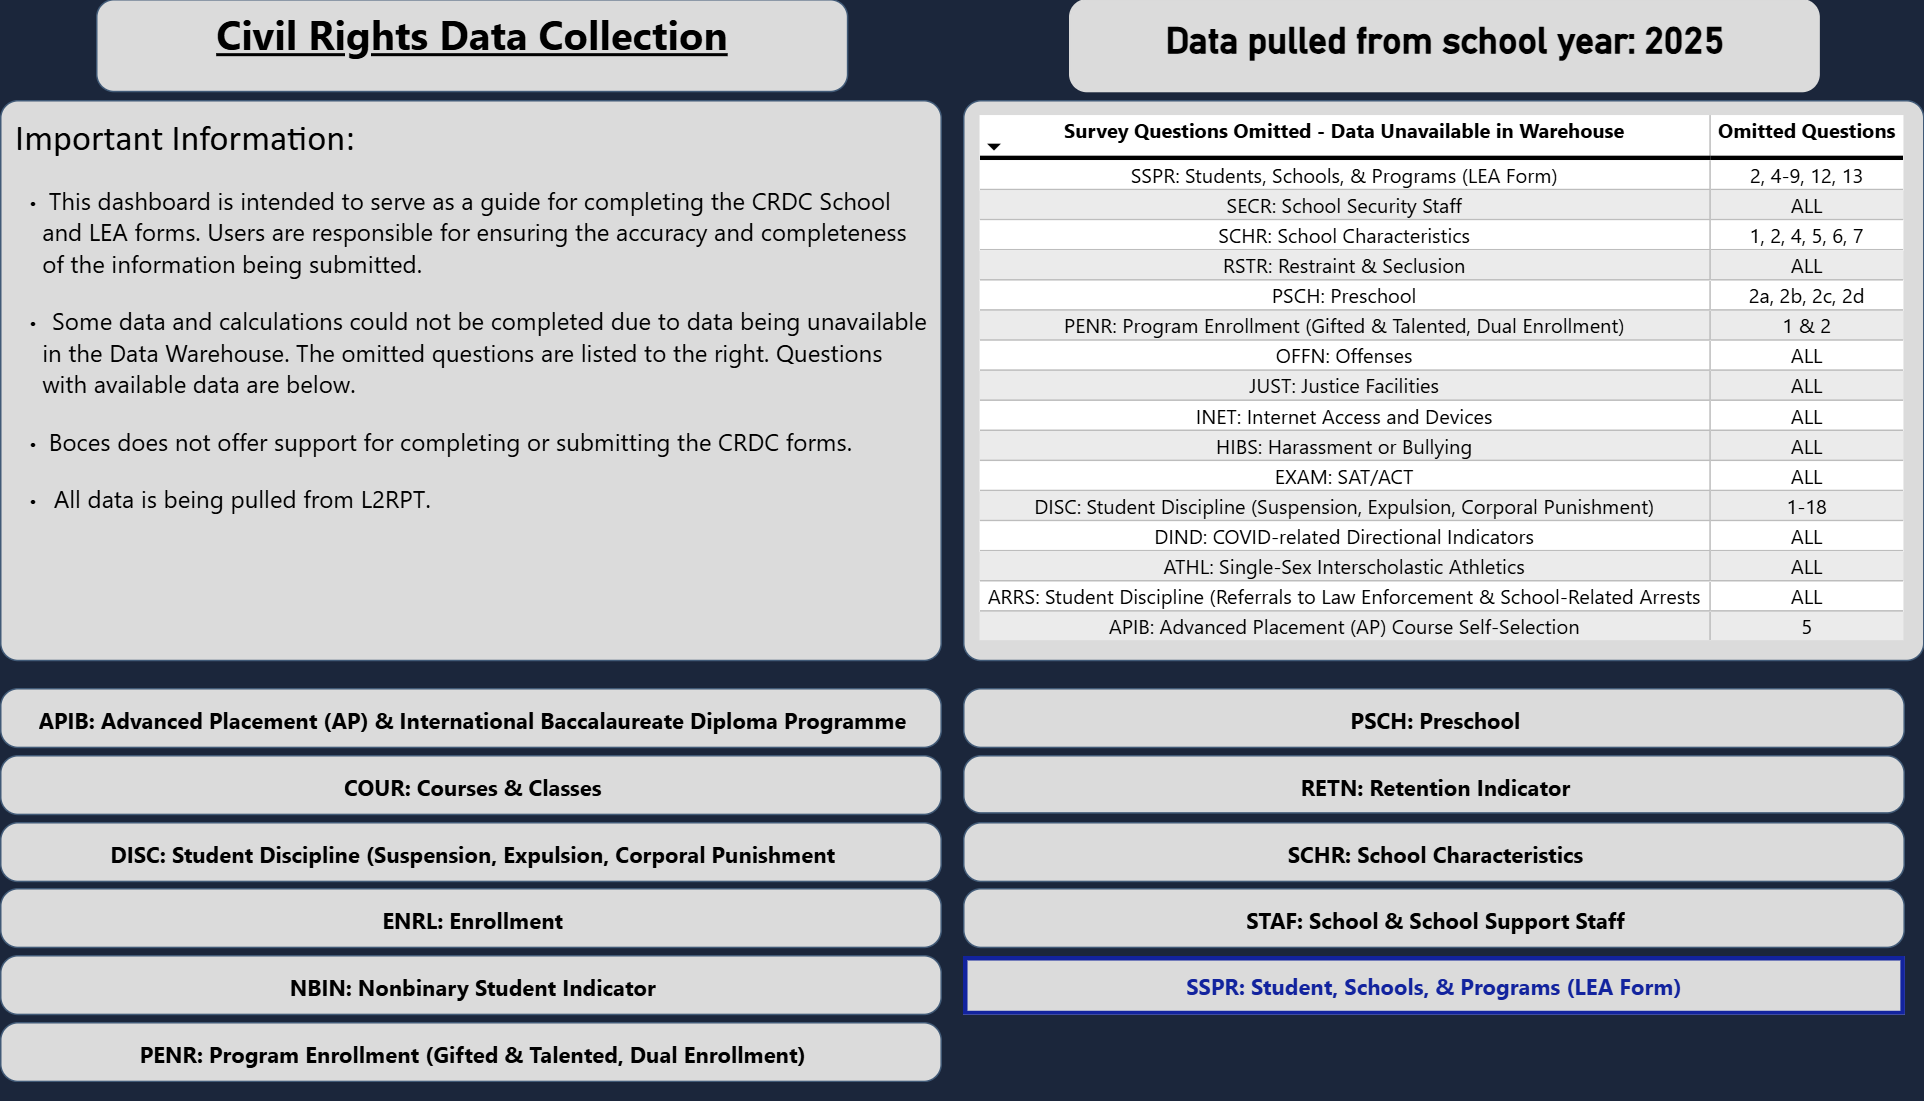
CRDC Report
|
District submitted data reorganized to match the required format for CRDC submission.
|
|
|
|
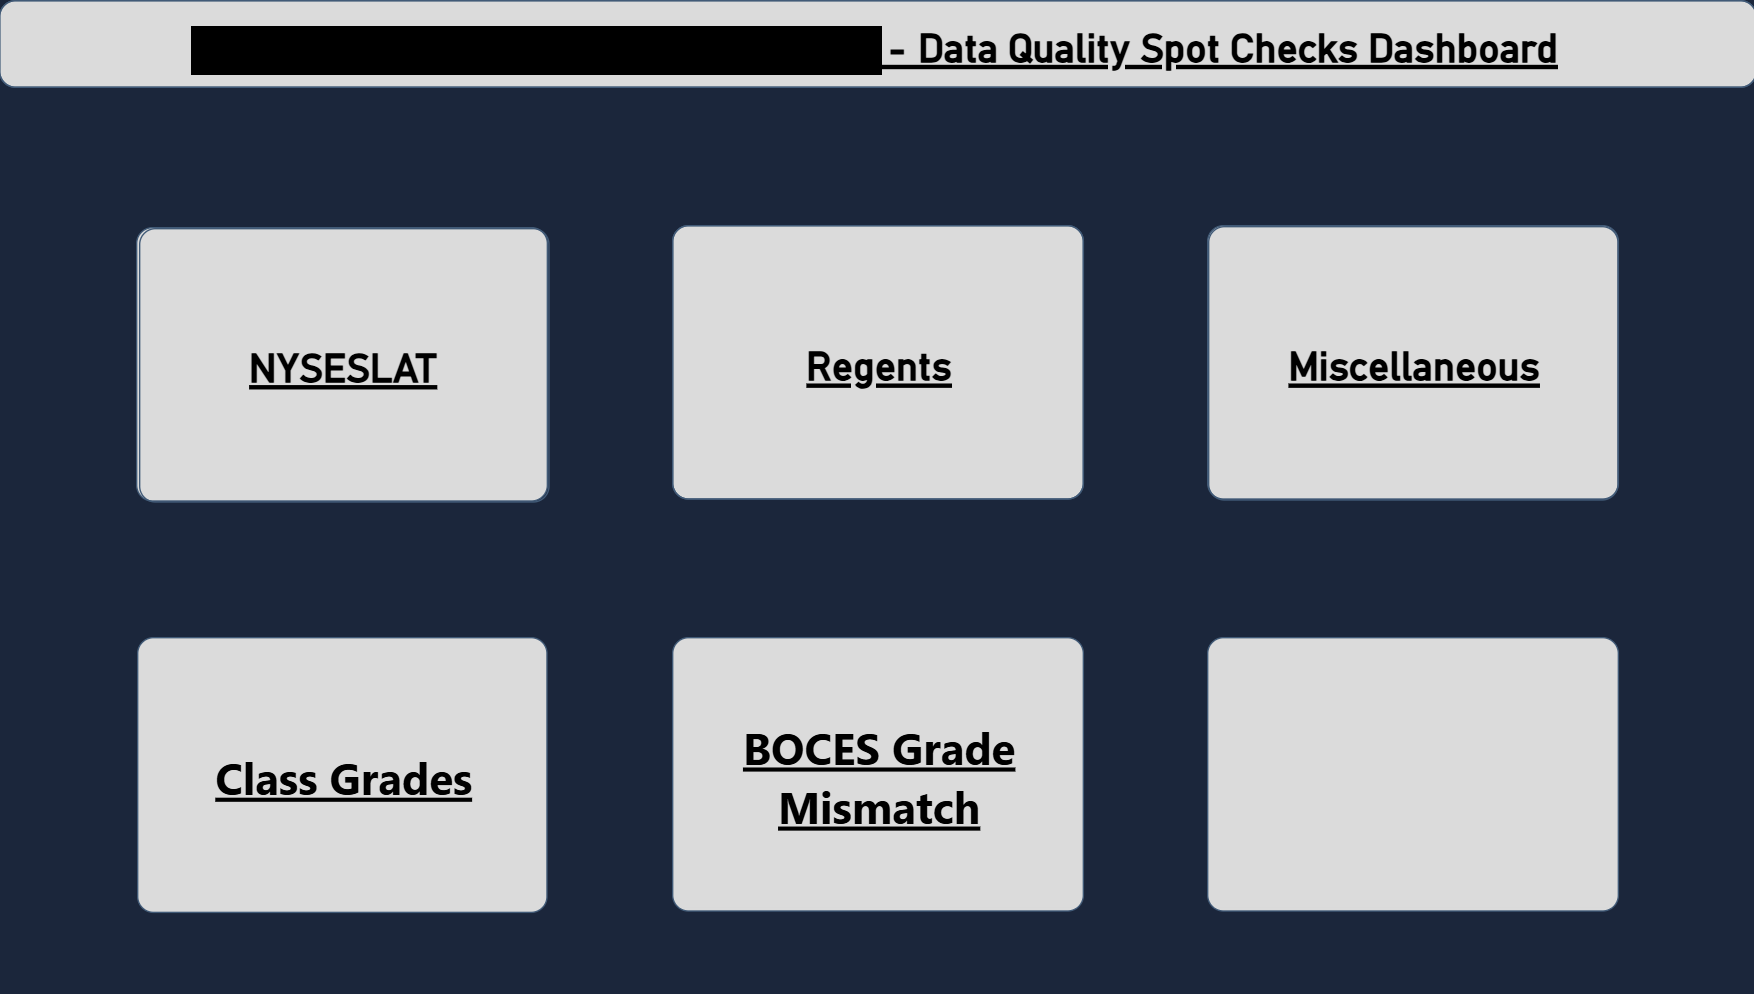
Data Quality Spot Checks Report
|
A collection of data quality queries to help with data verification.
|
|
|
|
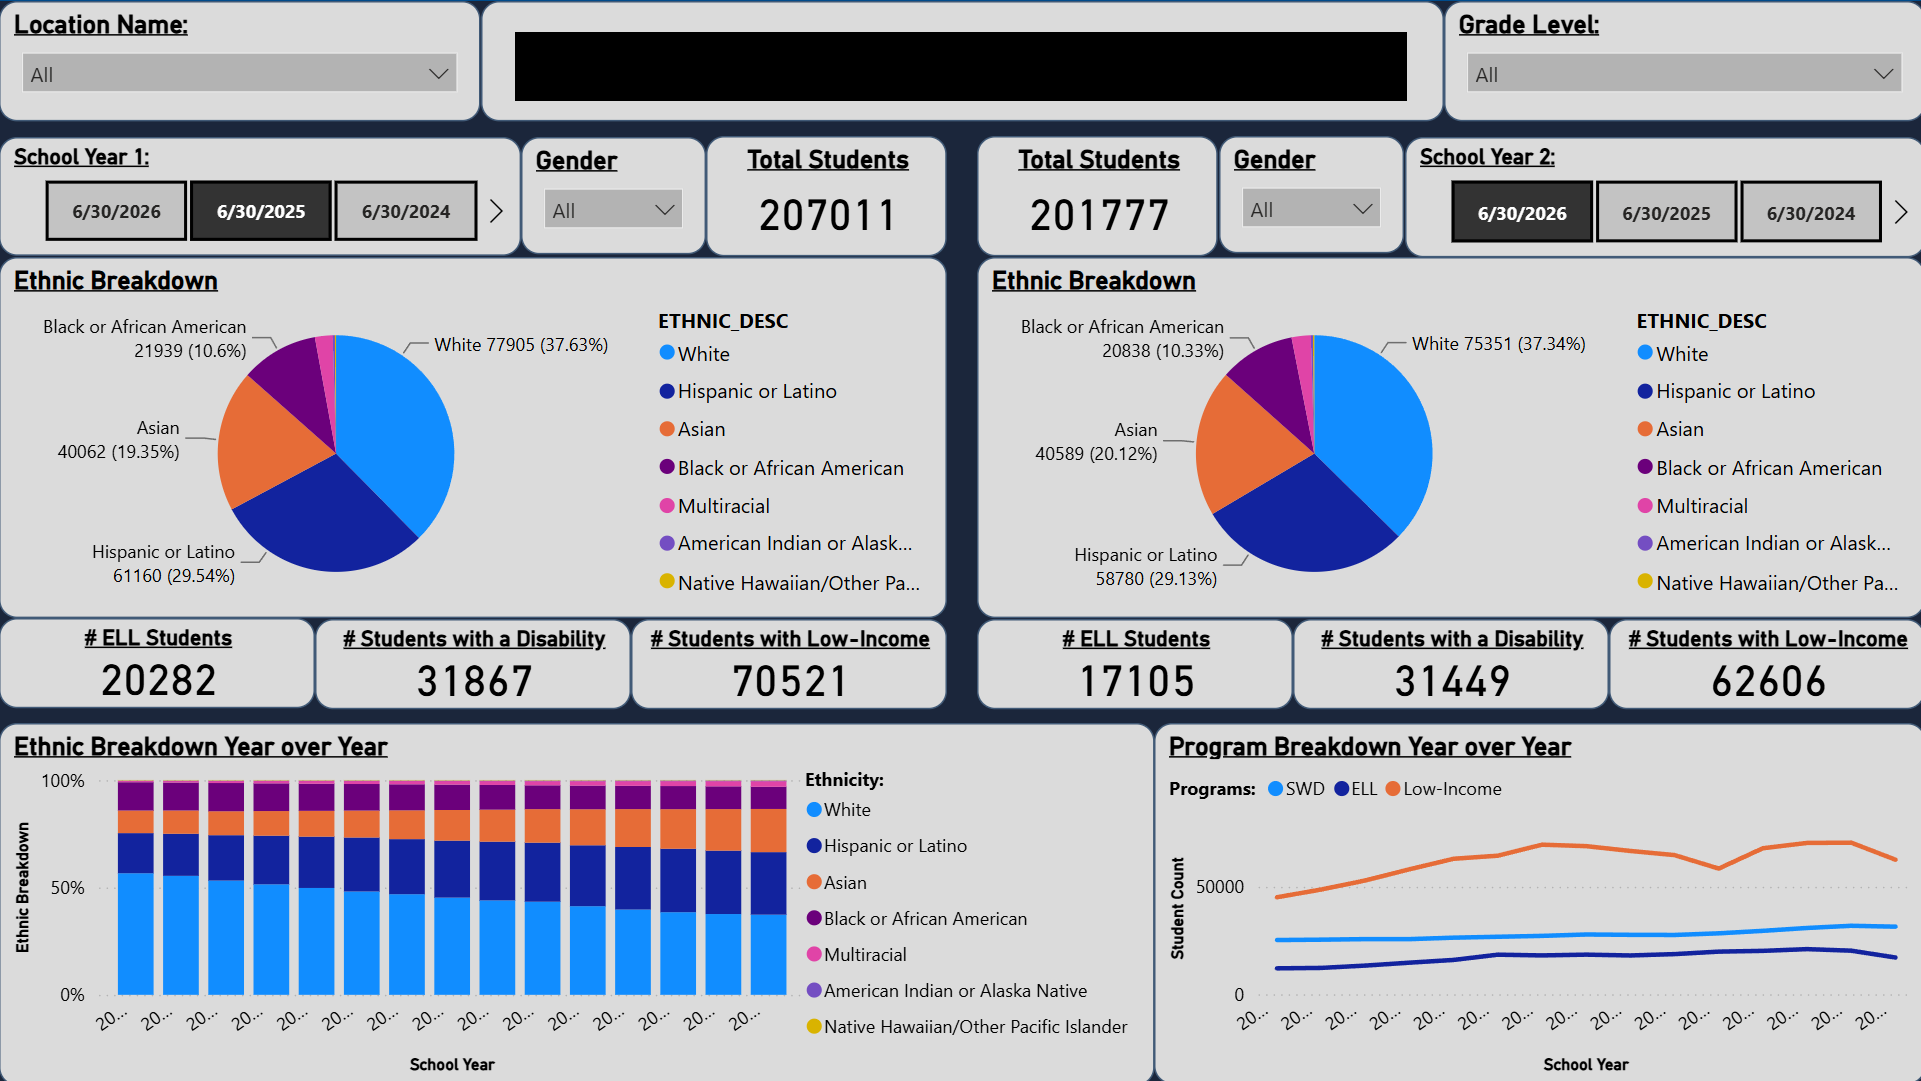
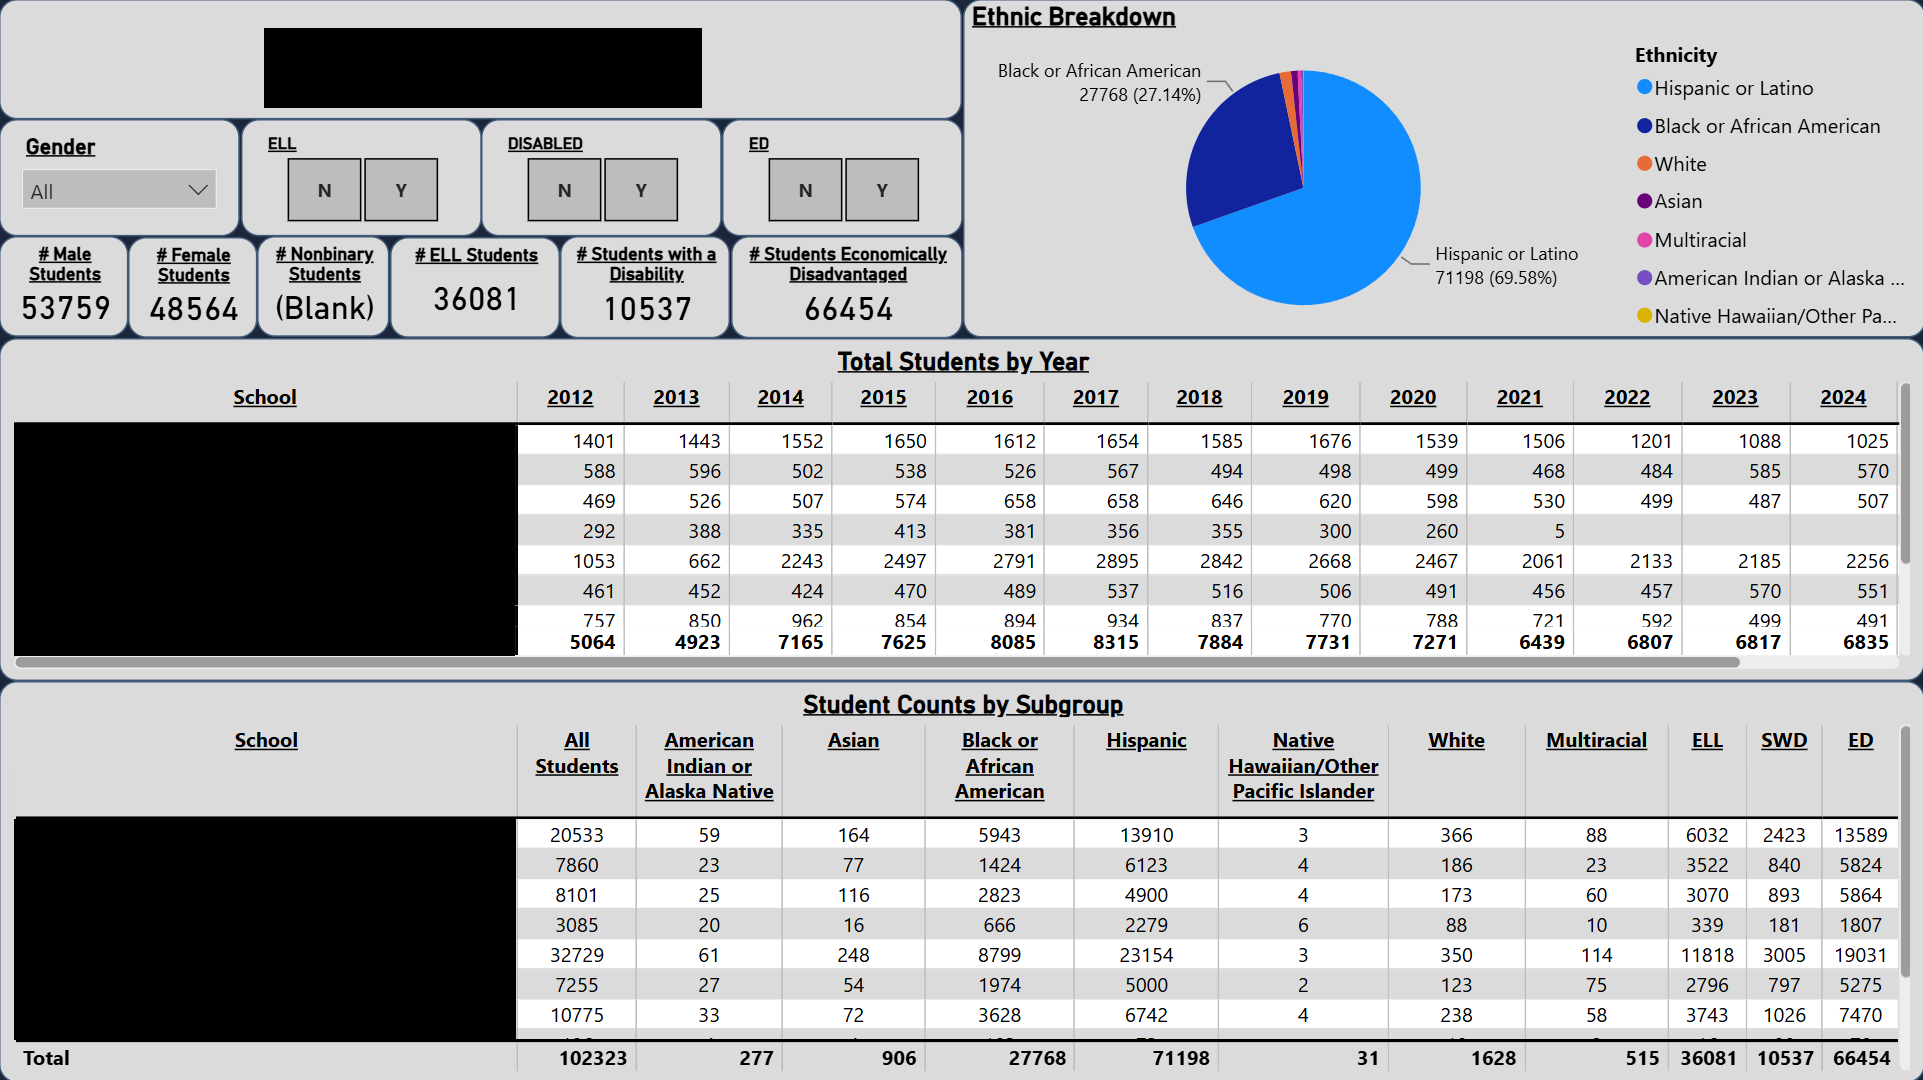
Demographic Overview Dashboard
|
View longitudinal demographic changes in your district.
|
|
|
|
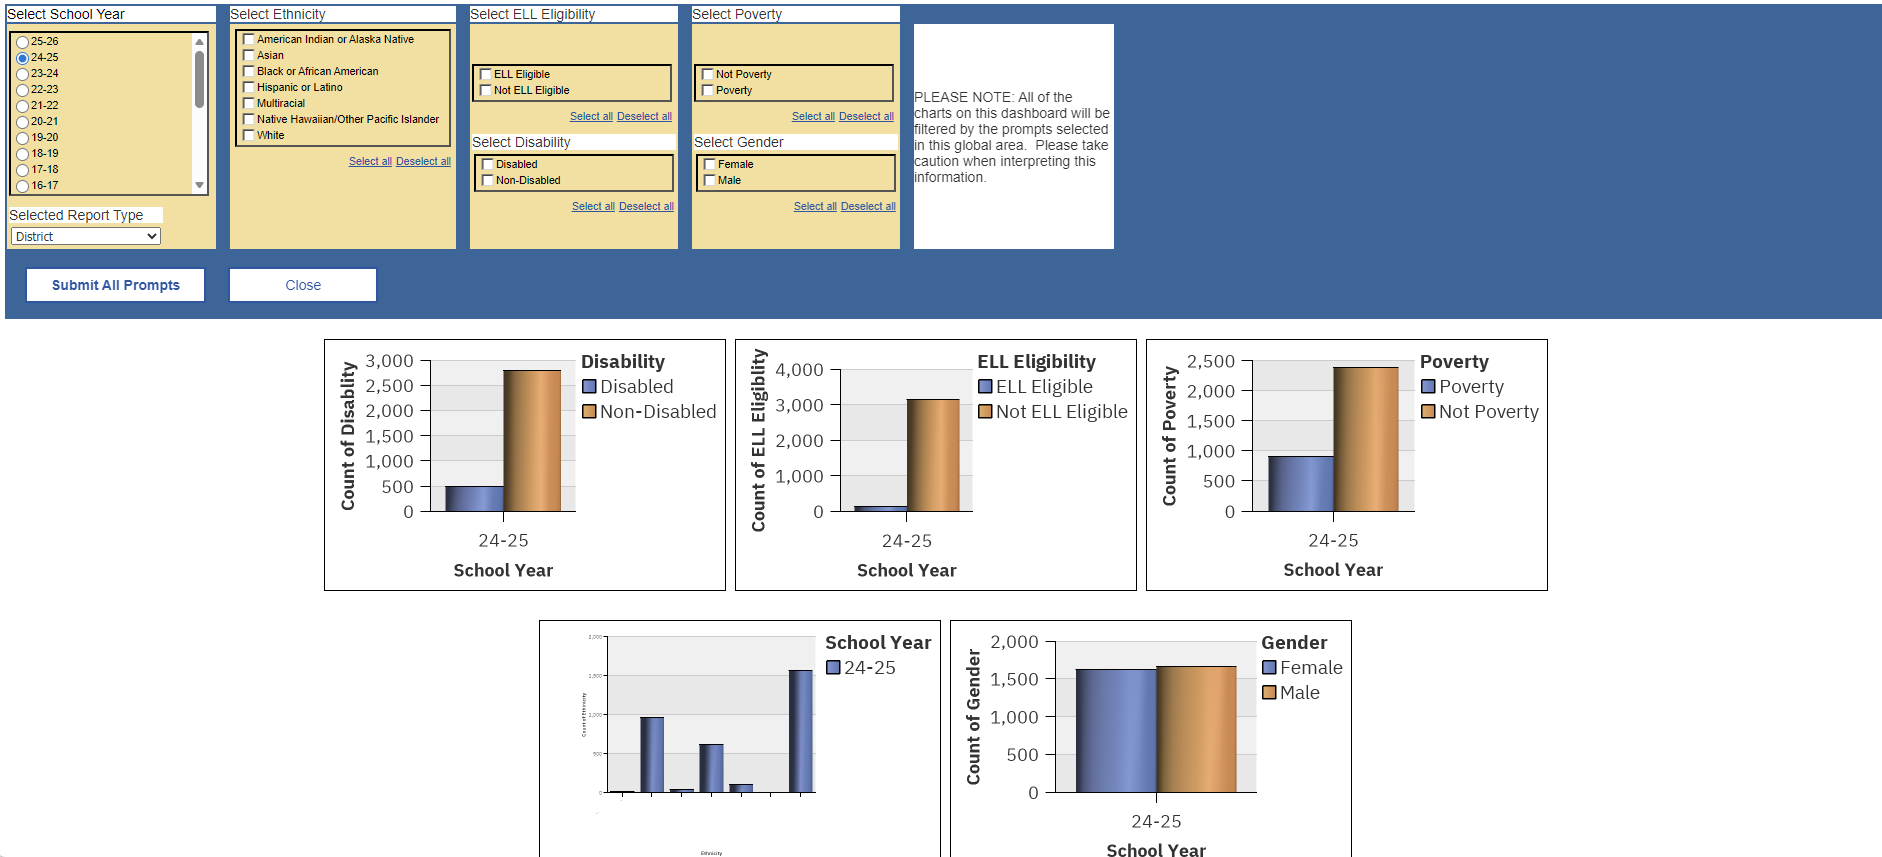
Demographic Single Year
|
This dashboard breaks down demographics in a single year by five bar charts which show disability, ELL eligibility,poverty,ethnicity, and gender.
|
|
|
|
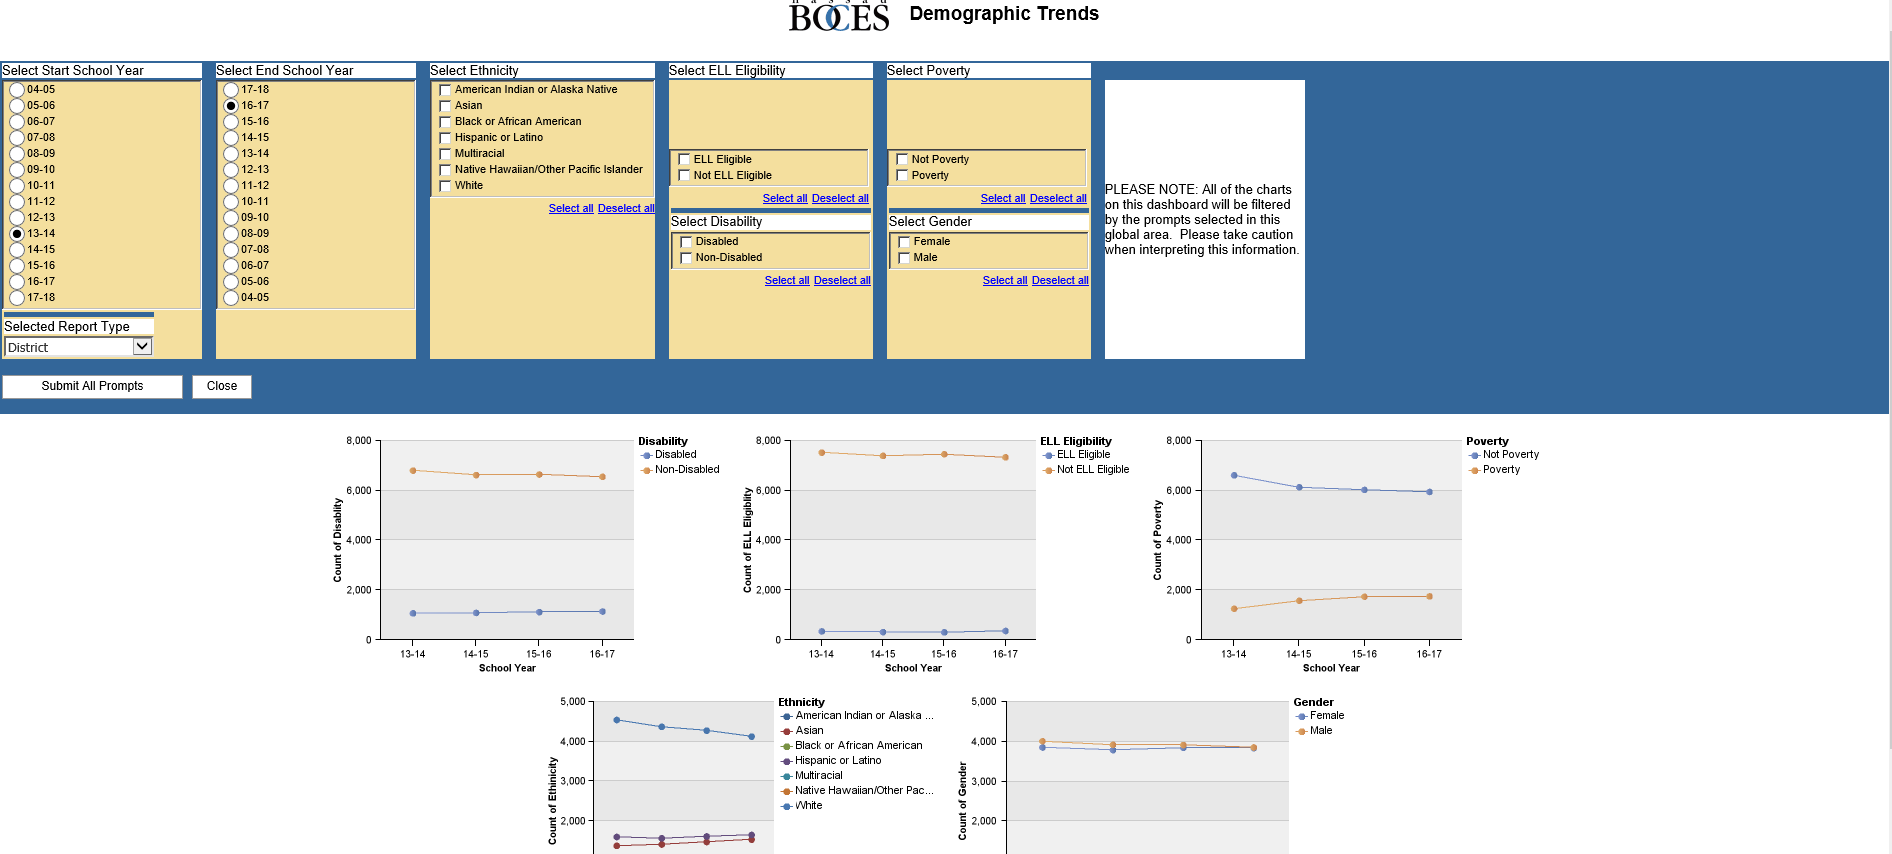
Demographic Trends
|
Connected dot line visualizations for student demographic trends base on demographic
|
|
|
|
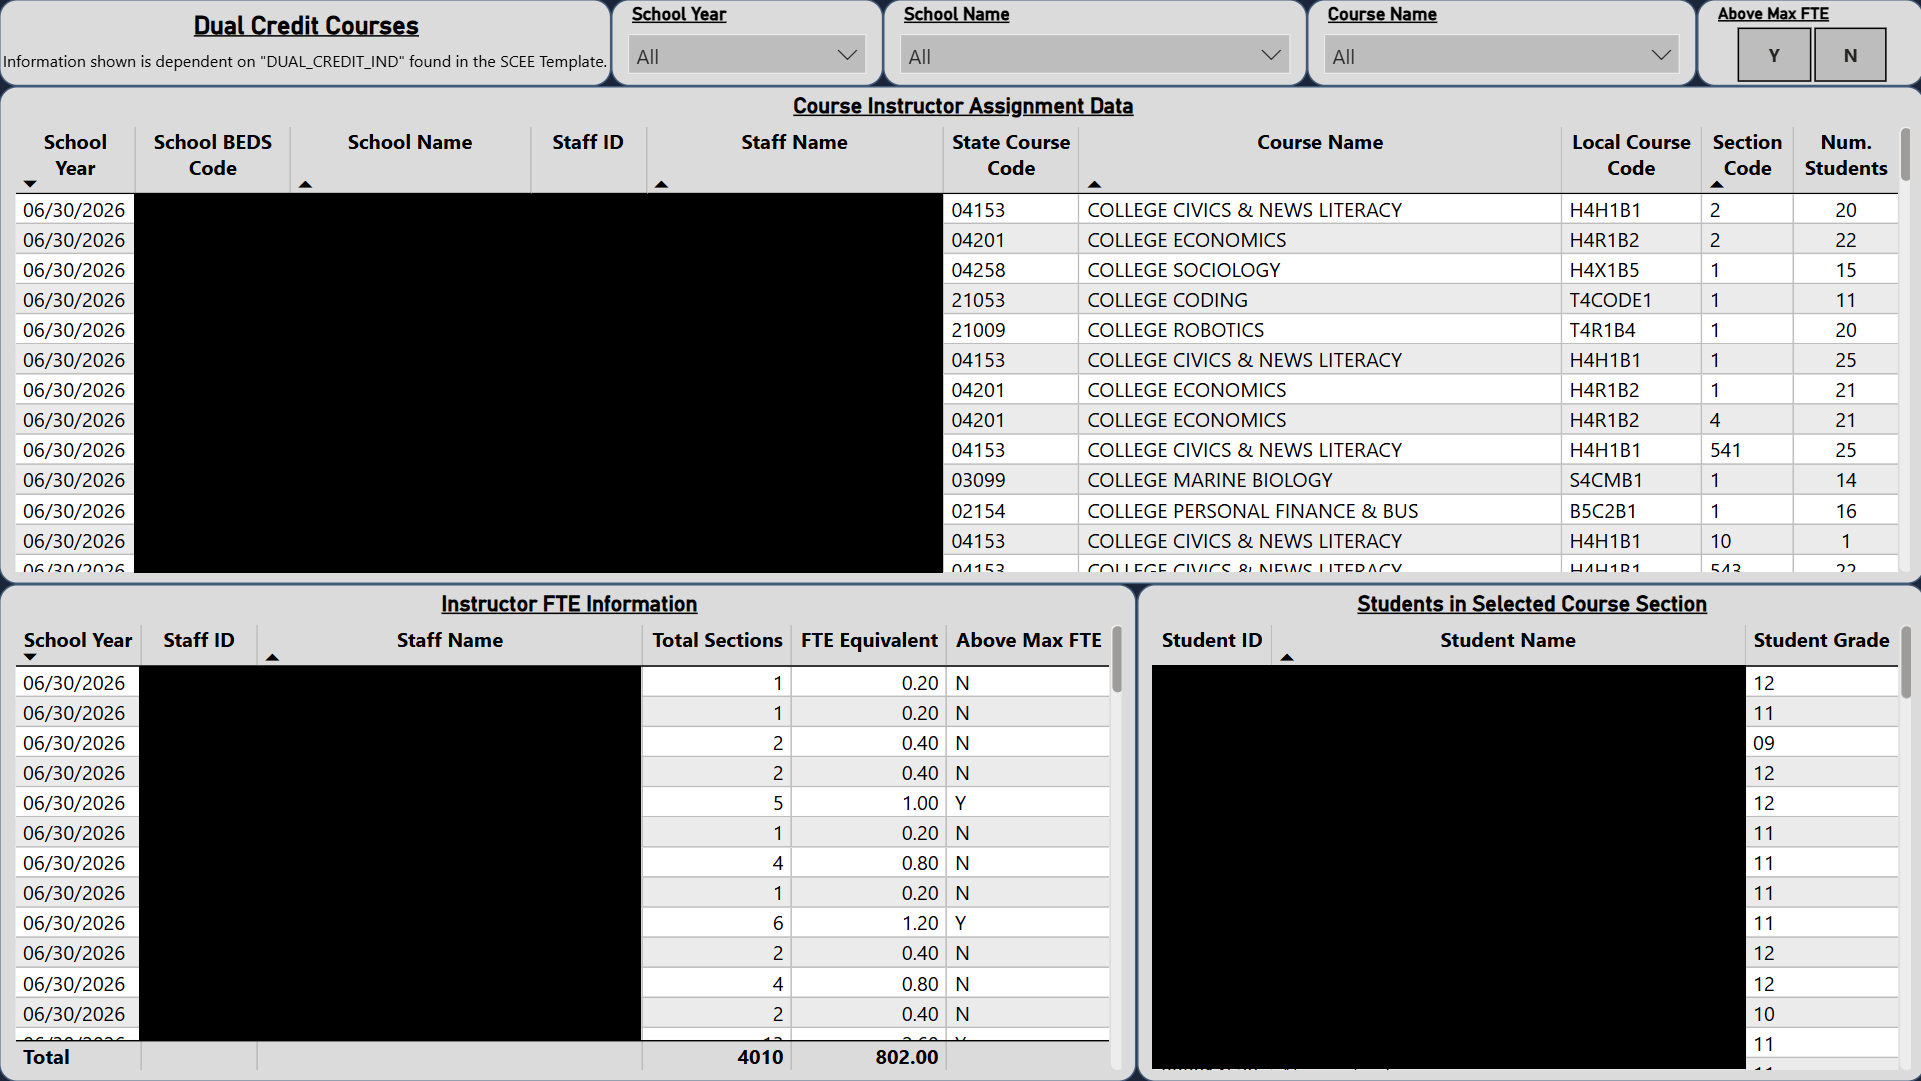
Dual Credit Courses Report
|
Teacher Class information specifically related to the Dual Credit Indicator found in the Student Class Entry Exit used to verify dual enrollment classes related to funding streams.
|
|
|
|
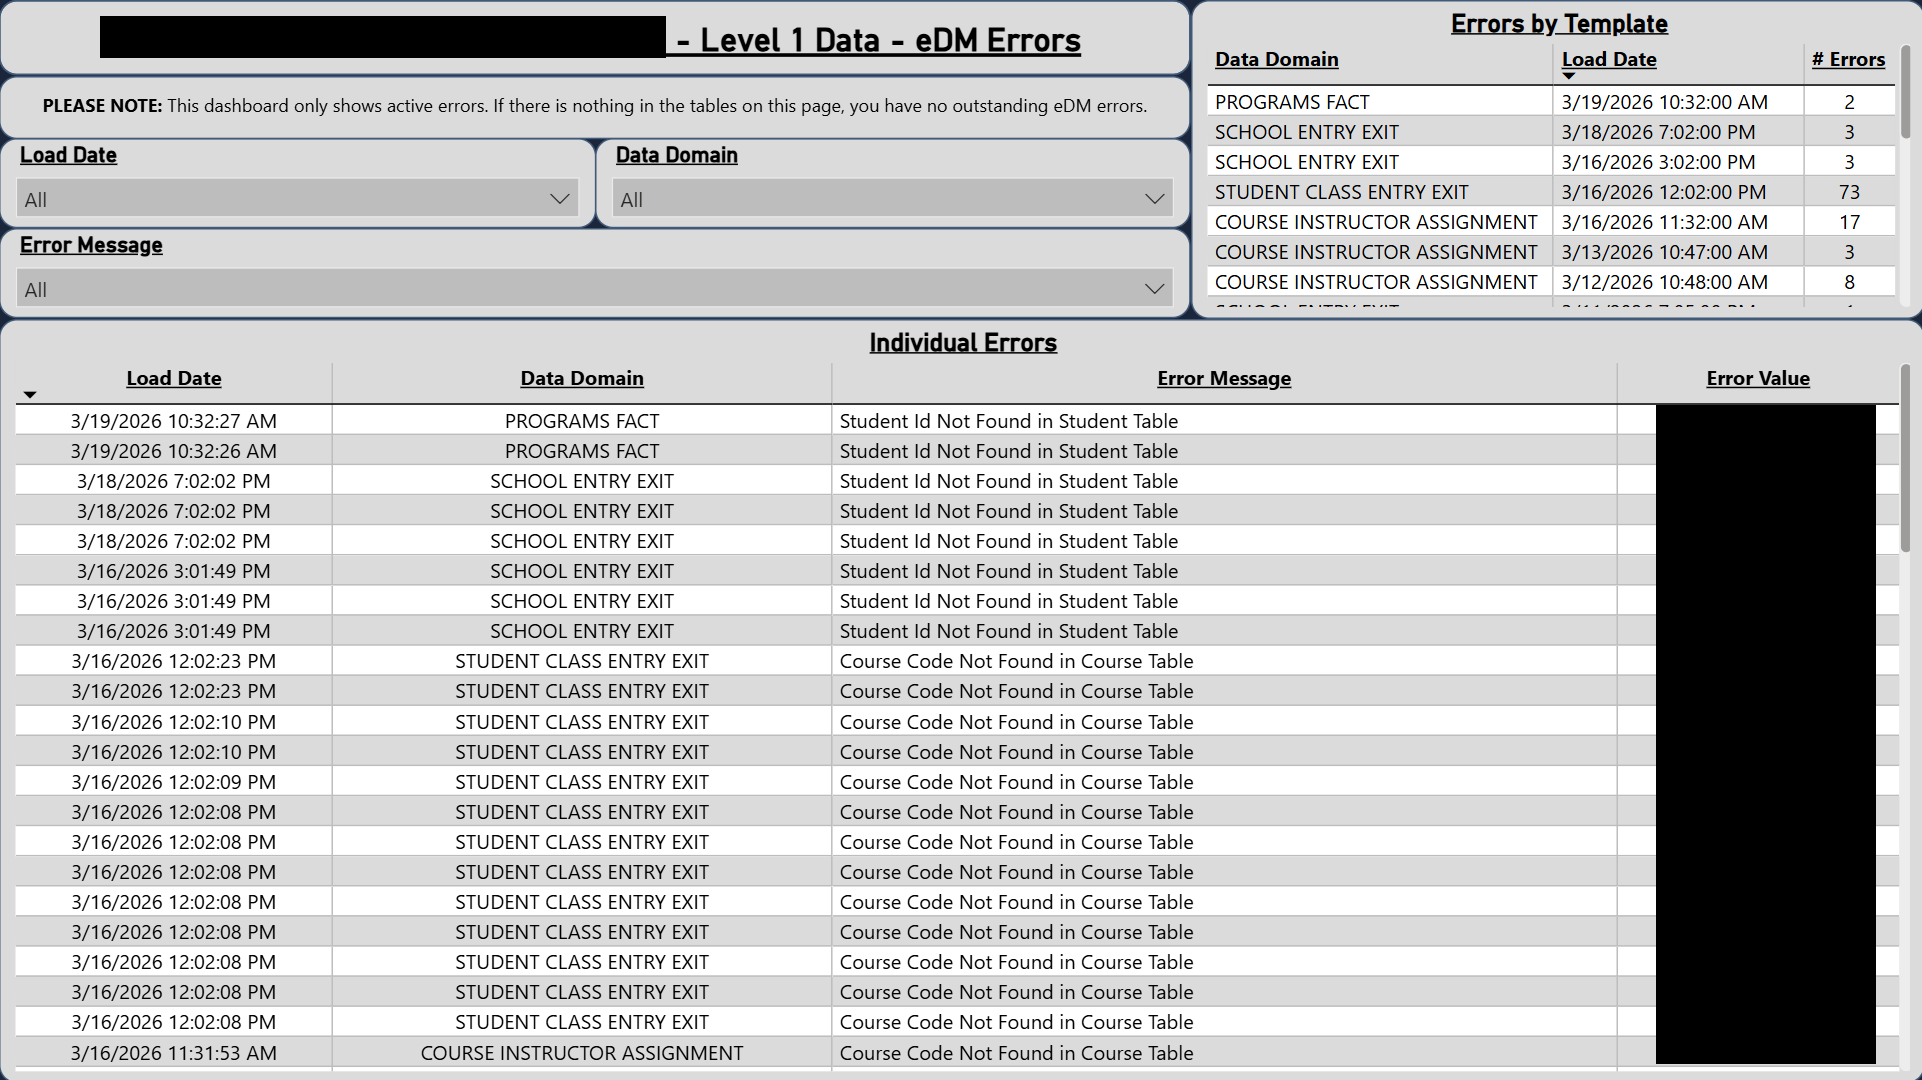
eDM Error Dashboard
|
The easiest way to view errors in the Level 0 to Level 1 data migration.
|
|
|
|
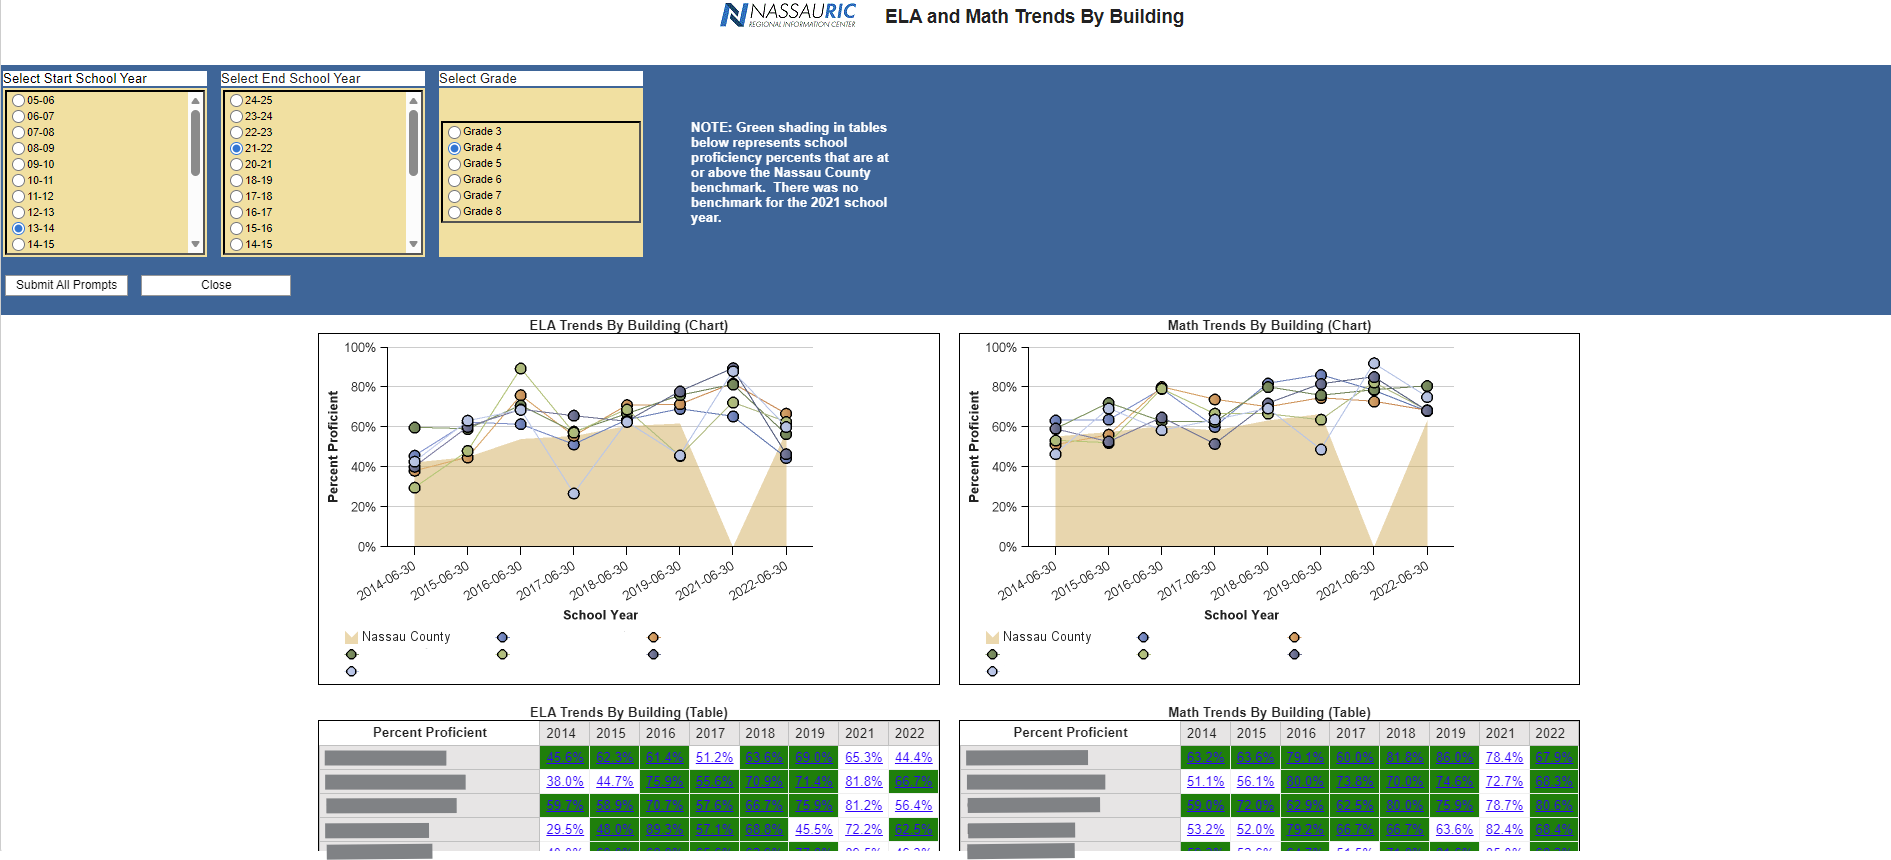
ELA and Math Trends By Building
|
This dashboard illustrates ELA and math proficiency over a set number of years in a line chart. Tables are also presented to show specific percentages by building.
|
|
|
|
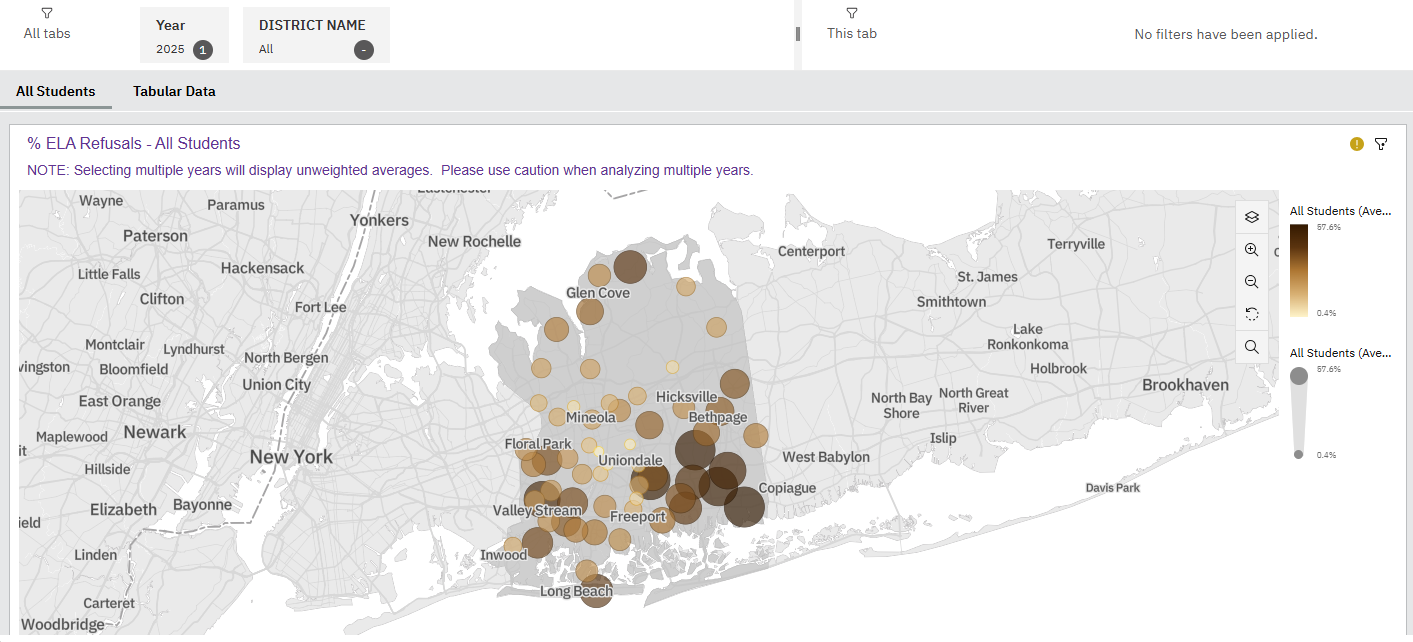
ELA Refusals
|
Map that plots 3-8 ELA refusal rates for all Nassau County school districts. Based on public data frm the NYSED Report Card.
|
|
|
|
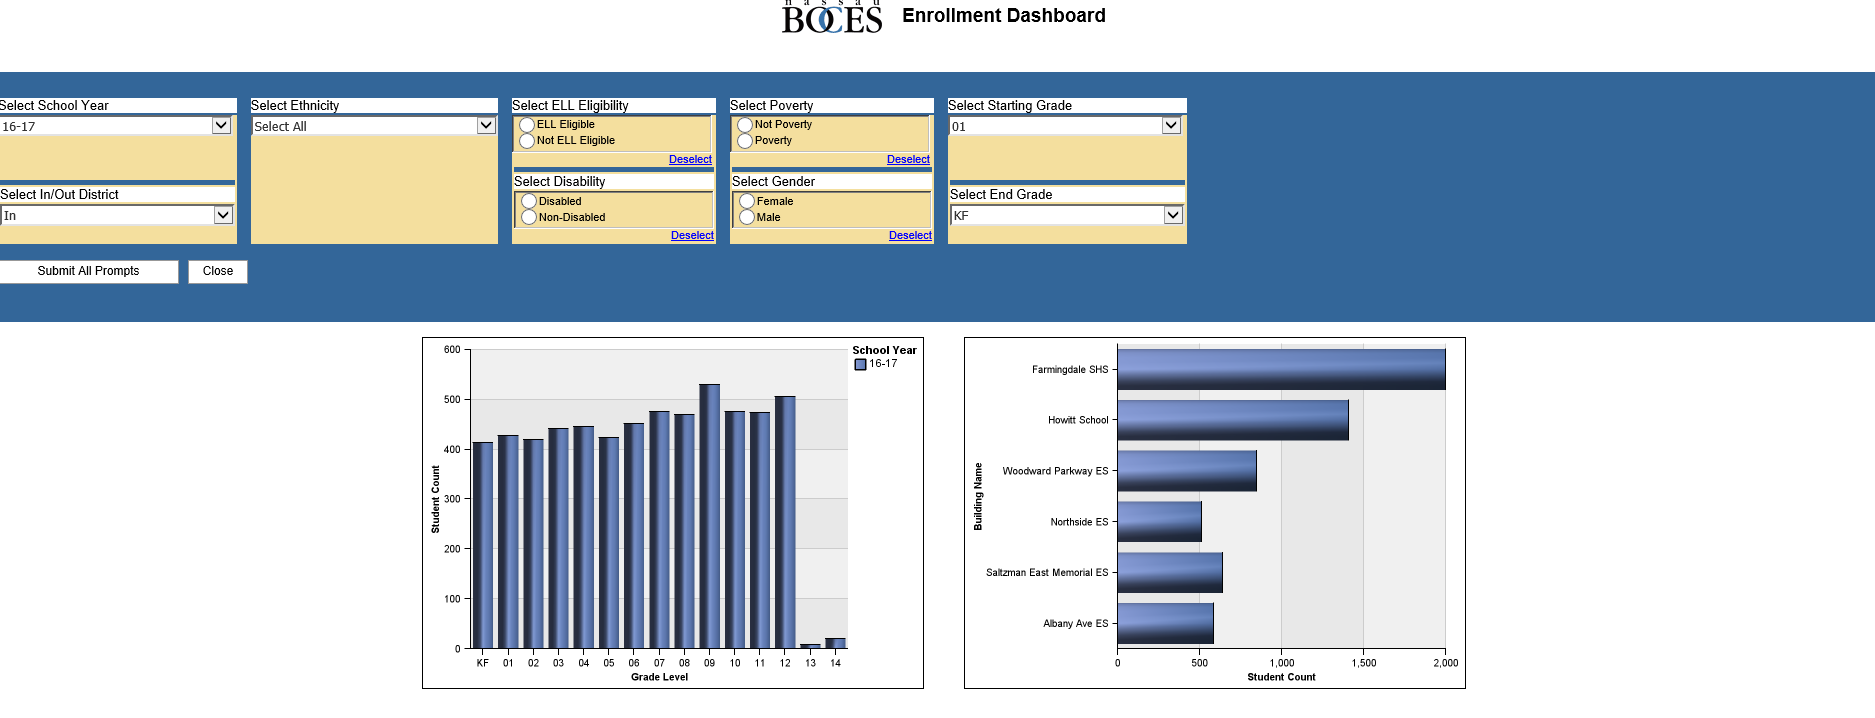
Enrollment Dashboard
|
Shows enrollment for single year by grade level and building in bar charts.
|
|
|
|
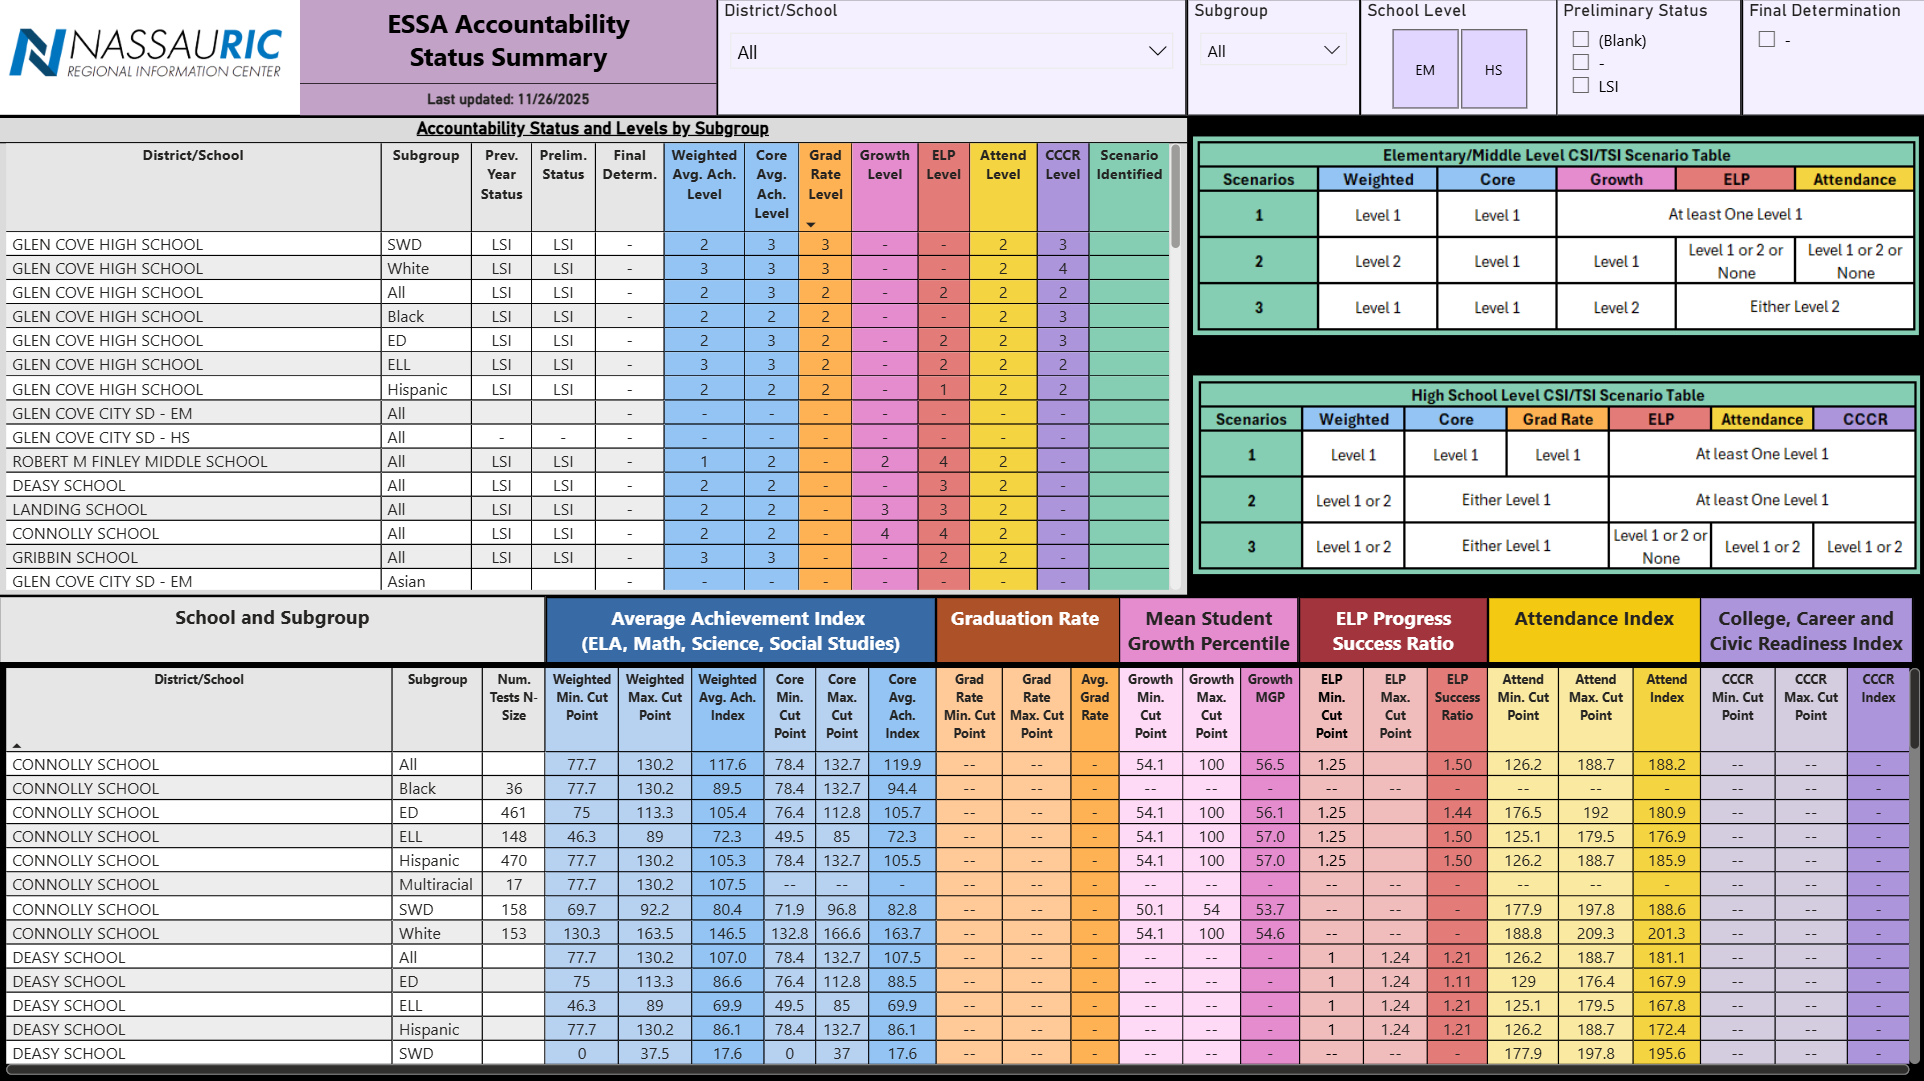
ESSA Accountability Dashboard
|
The one stop-shop for accountability every year. Summarizes the NYSED accountability spreadsheet, pulls data from L2RPT and organizes it to easily identify students in need of support.
|
|
|
|
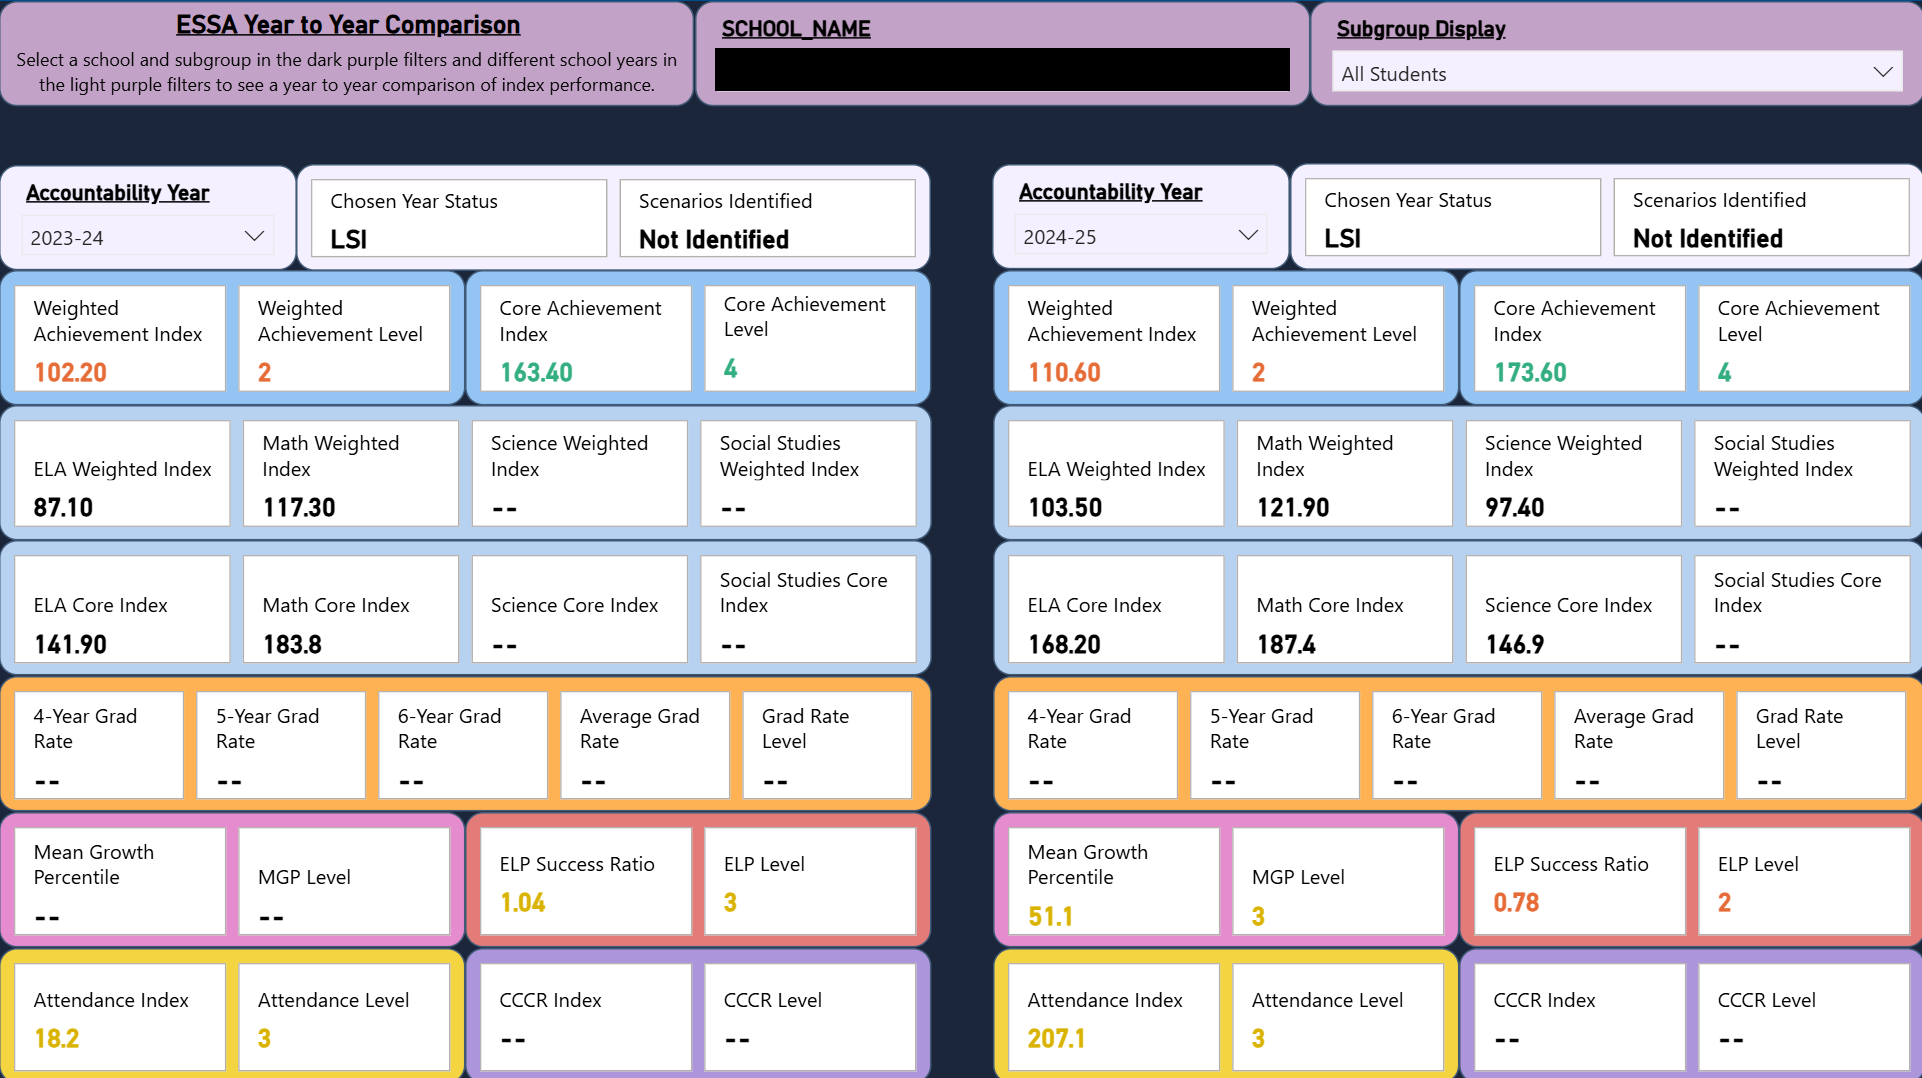
ESSA Trends Report
|
View accountability indicator scores across multiple years and compare across subgroups or schools.
|
|
|
|
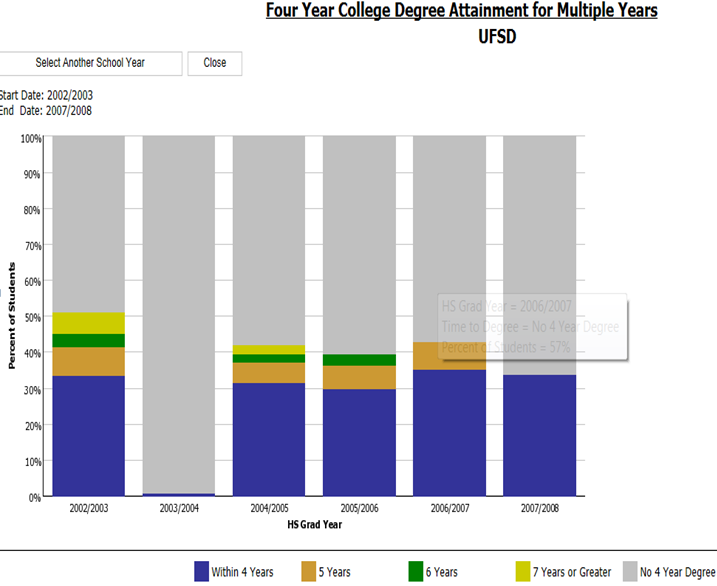
Four Year College Degree Attainment for Multiple Years
|
Column chart that analyzes the number of years it takes for high school graduates from multiple years to receive a four-year college degree.
|
|
|
|
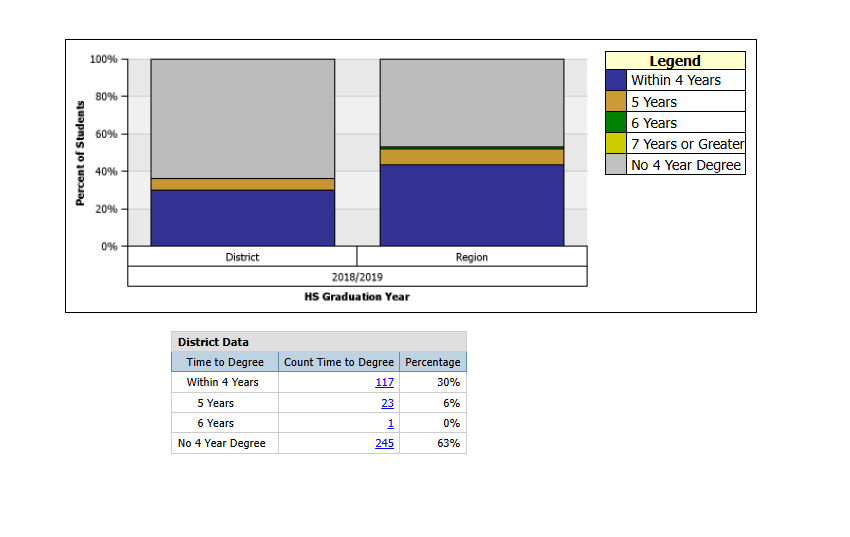
Four Year College Degree Attainment for Single Year
|
Column chart that analyzes the number of years it takes for high school graduates from a single year to receive a four-year college degree.
|
|
|
|
Gap
|
Displays the percentage of total possible points earned for the district, building or classroom.
|
|
|
|
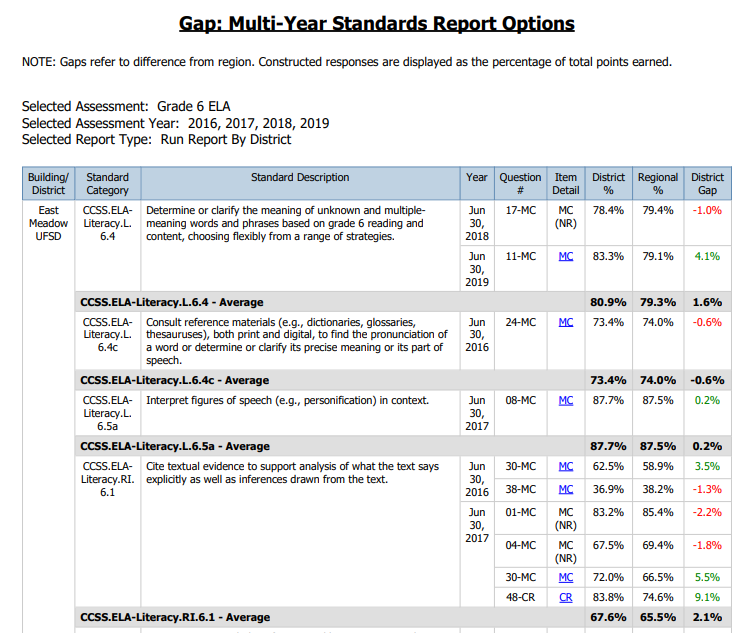
Gap: Multi-Year Standards
|
This report groups questions across multiple years by their learning standard. This report is useful in determining question difficulty, as well as relative strengths and weaknesses, by question and learning standard, when compared to the region.
|
|
|
|
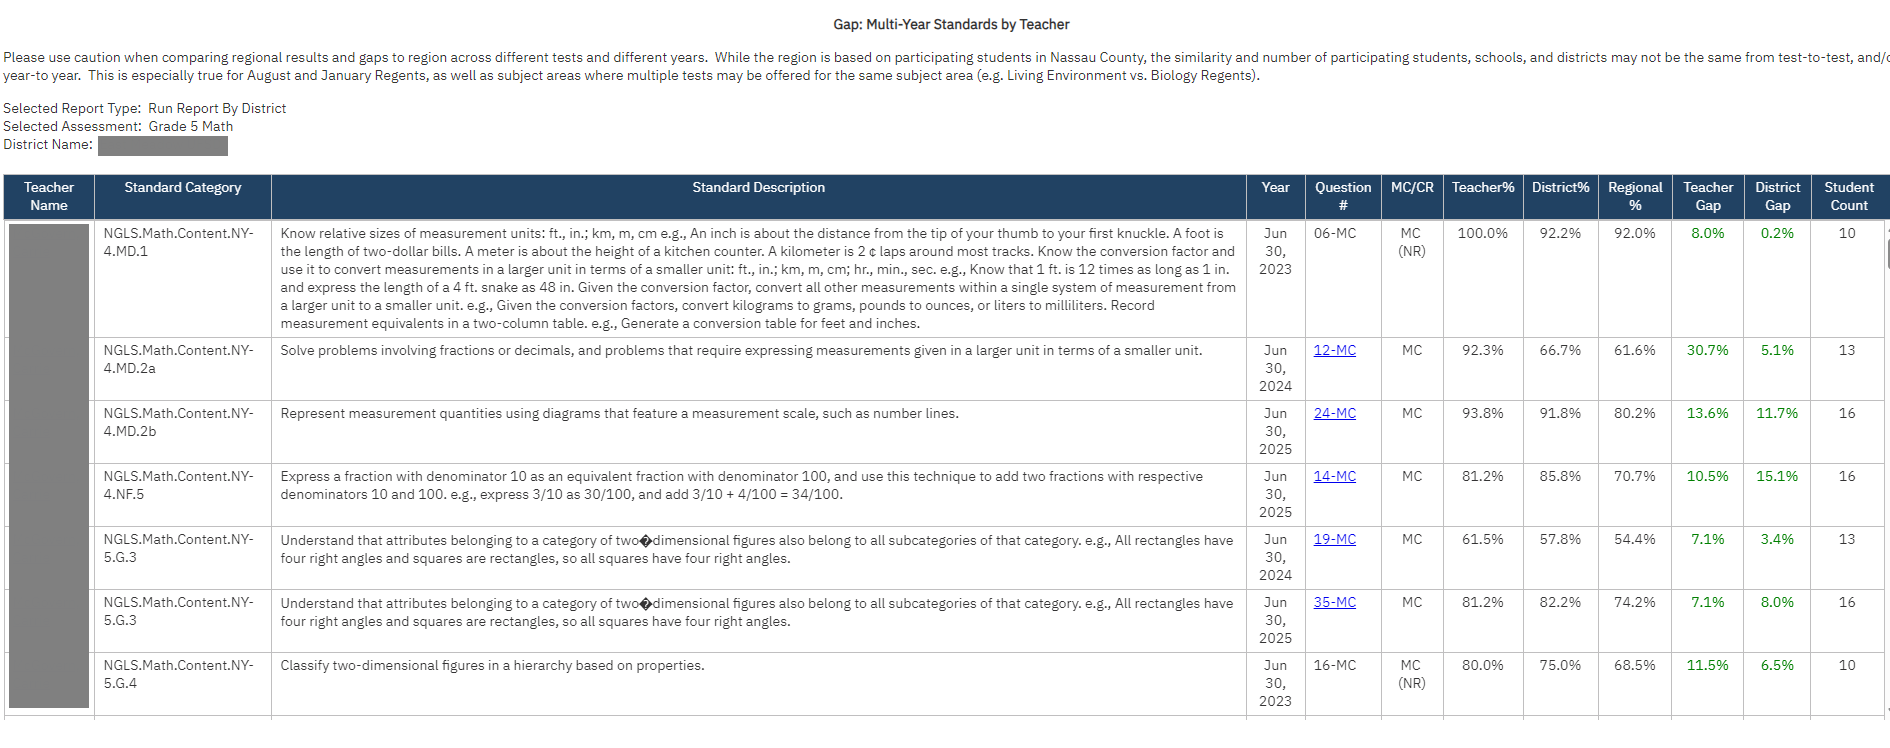
Gap: Multi-Year Standards by Teacher
|
This report groups questions across multiple years by their learning standard for individual teachers. This report is useful in determining question difficulty, as well as relative strengths and weaknesses, by question and learning standard, when compared to the region.
|
|
|
|
Gap: Multi-Year Standards Download
|
This Excel download groups questions across multiple years by their learning standard. This report is useful in determining question difficulty, as well as relative strengths and weaknesses, by question and learning standard, when compared to the region.
|
|
|
|
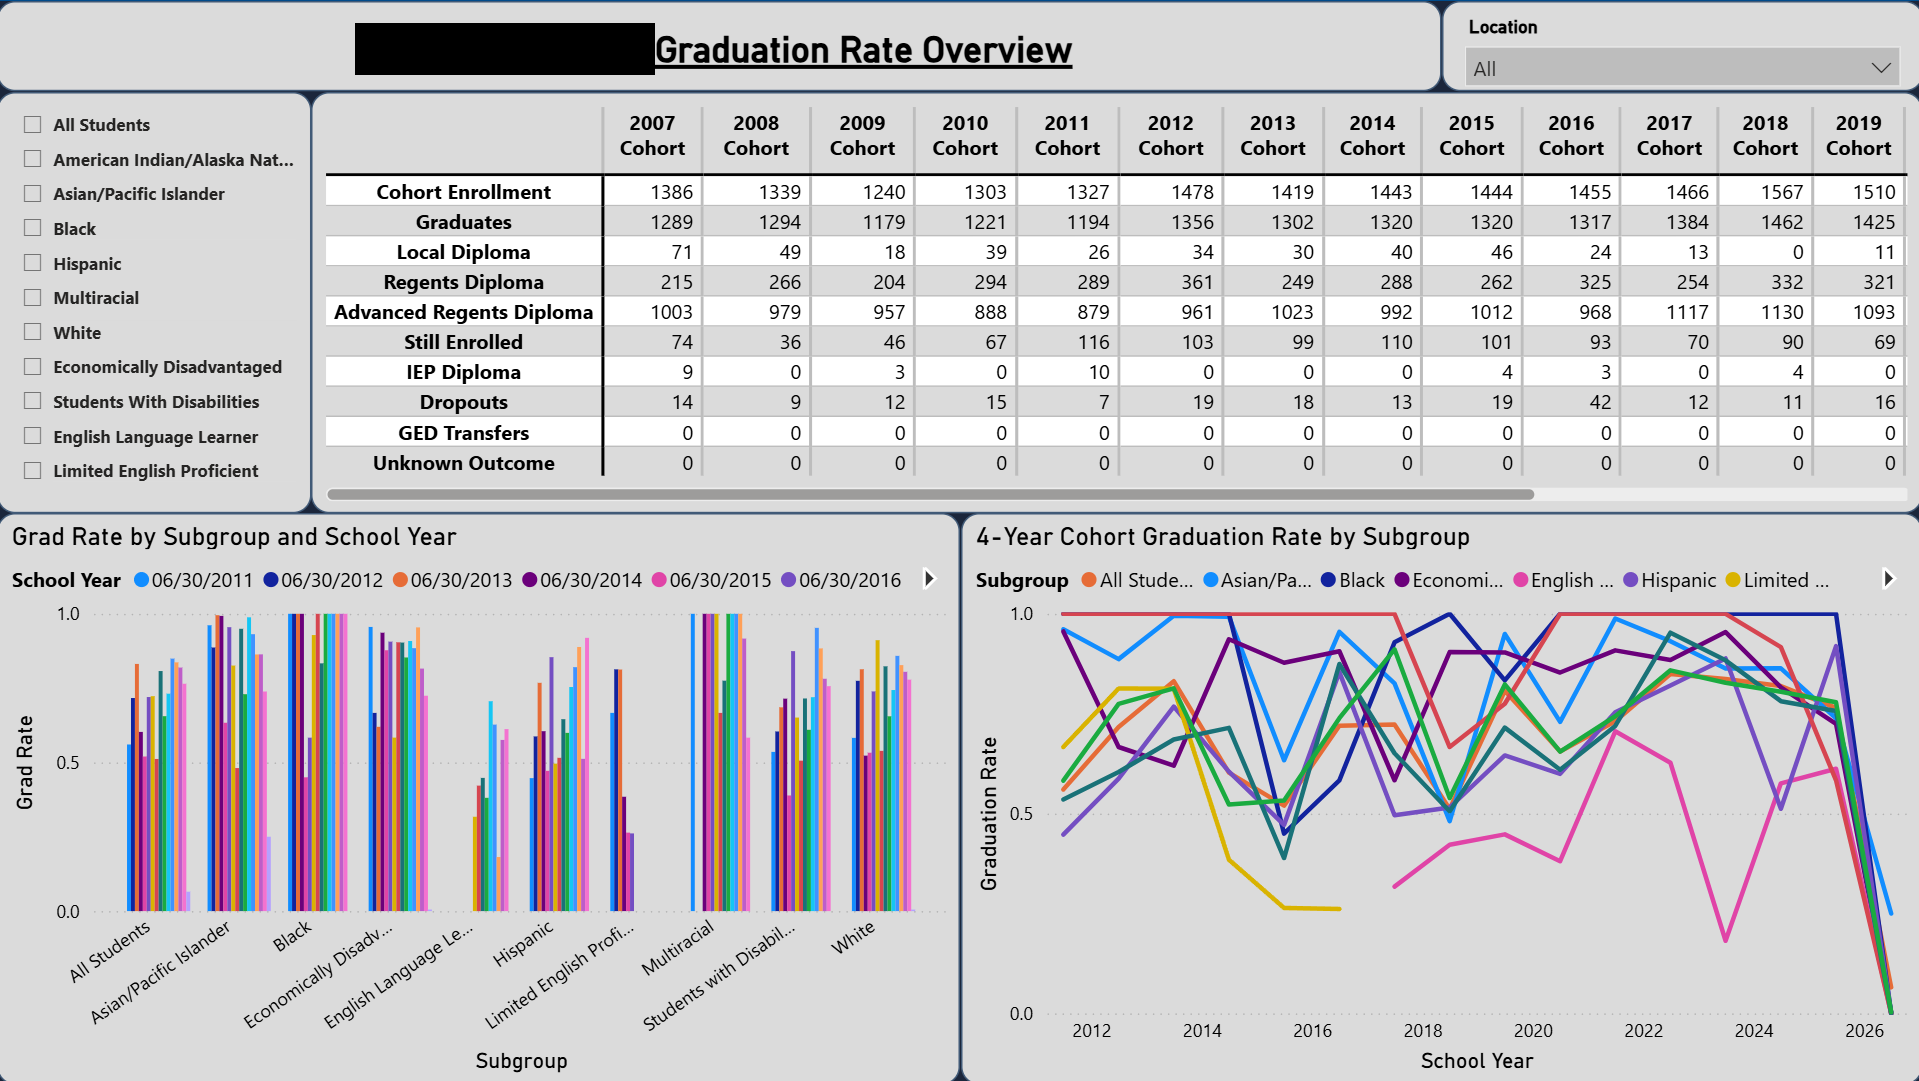
Grad Rate Overview Dashboard
|
View graduation rate longitudinally across multiple cohorts and subgroups.
|
|
|
|
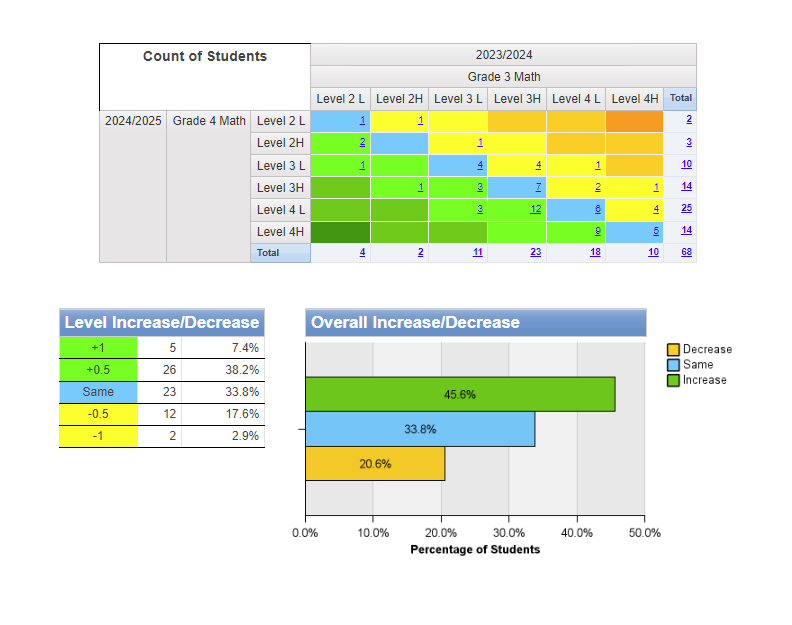
Half Level Change-This Year vs Last Year
|
This report compares aggregated half-level performance of students in the selected district or building over a two-year period. Only students taking both assessments will be included.
|
|
|
|
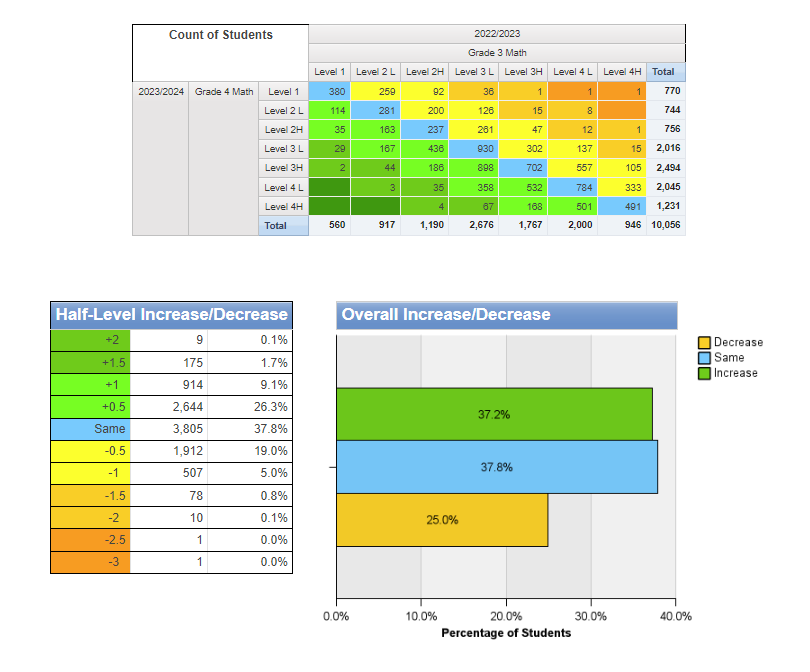
Half Level Change-This Year vs Last Year (Nassau Totals)
|
This report compares half-level performance for all students in Nassau County taking NYS assessments over two years. Only students taking both assessments will be included.
|
|
|
|
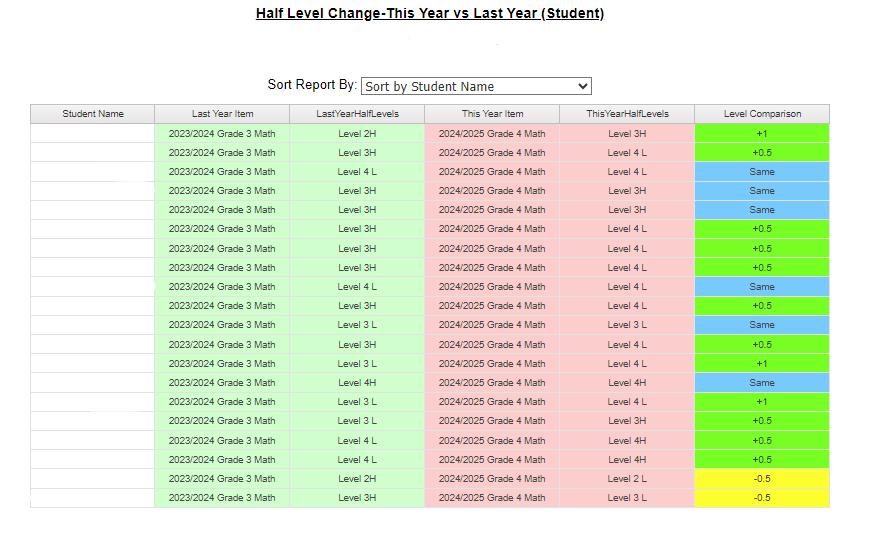
Half Level Change-This Year vs Last Year (Student)
|
This report displays individual student half-level performance over a two-year period.
|
|
|
|
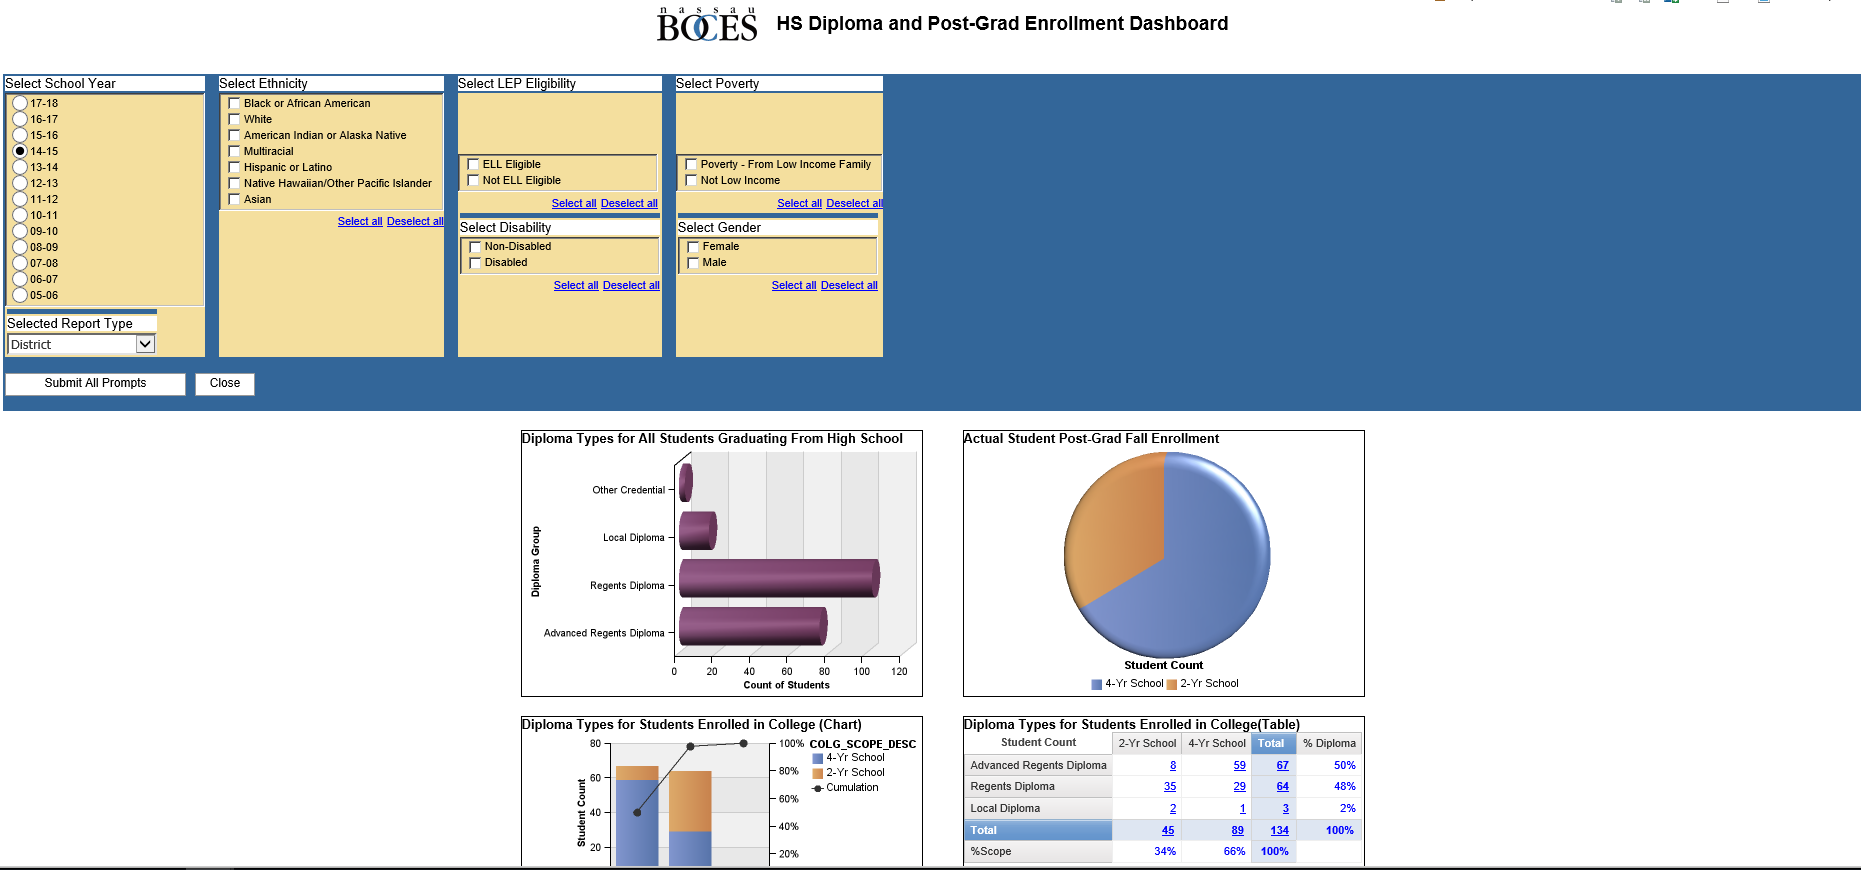
HS Diploma and Post-Grad Enrollment Dashboard
|
Single year statistics on diploma percentages (local,regents, or advanced regents diploma), and post secondary enrollment (2-yr school vs 4-yr school)
|
|
|
|
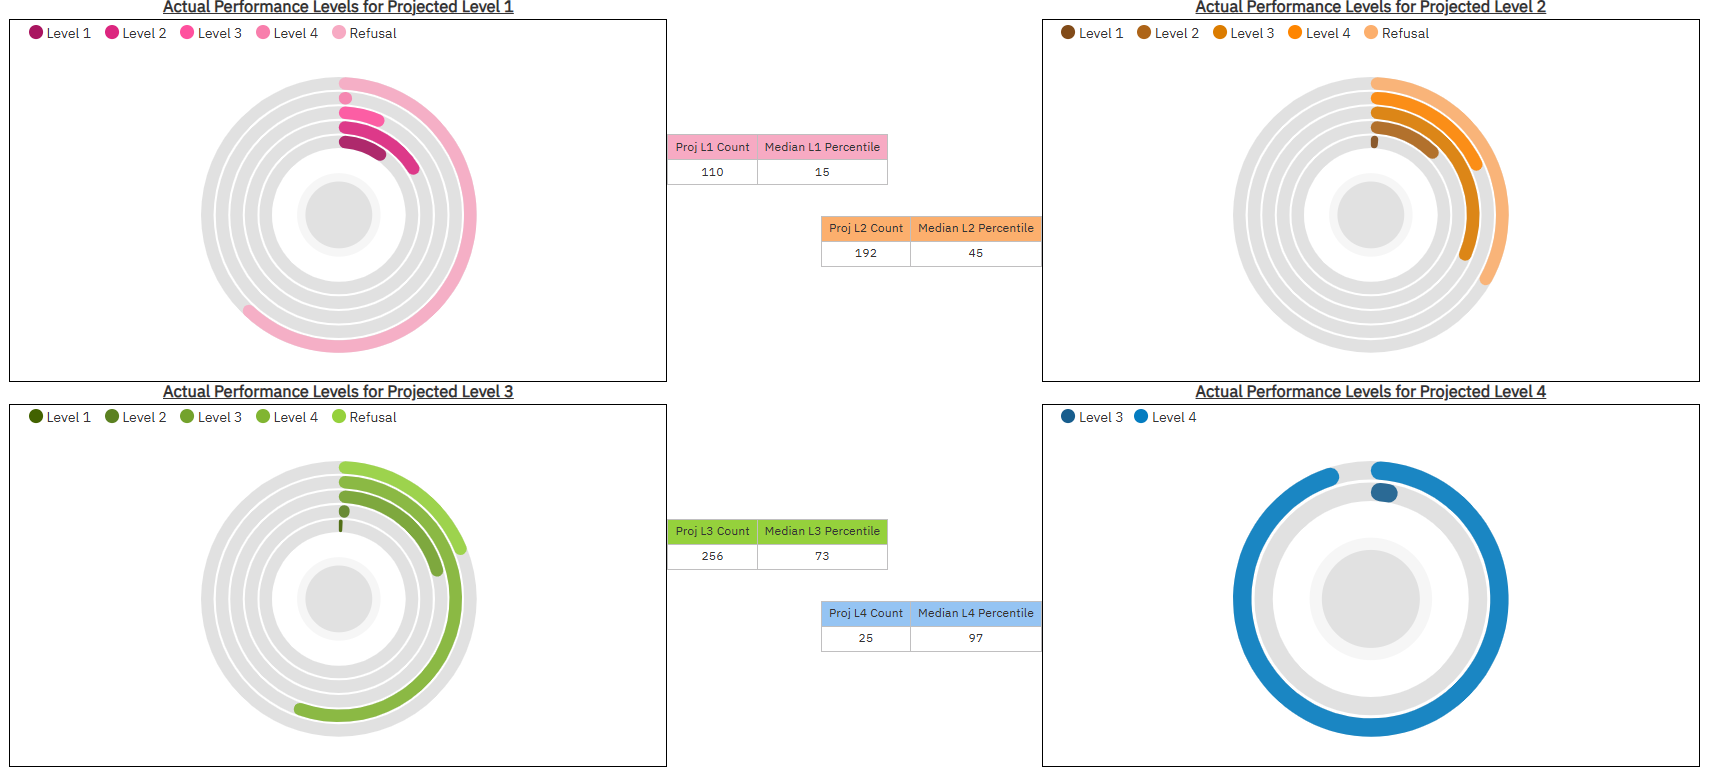
i-Ready NYS Projection Dashboard – Individual Level Summary
|
This dashboard list the percentage of acutal NYS Performance levels vs iReady projected level for individual levels
|
|
|
|
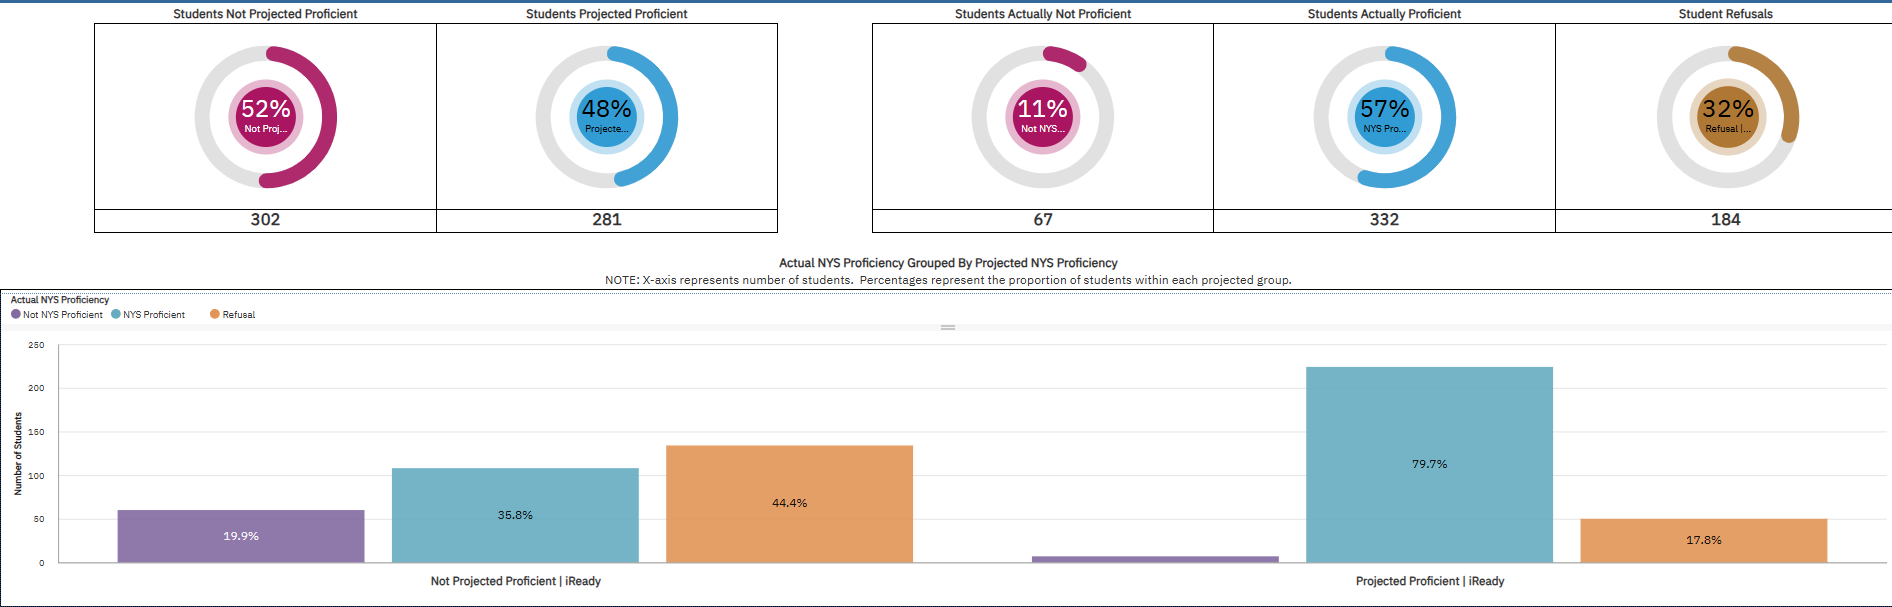
i-Ready NYS Projection Dashboard – Overall Proficiency Summary
|
This dashboad list the percentage of actual NYS proficiency and iReady projected proficiency.
|
|
|
|
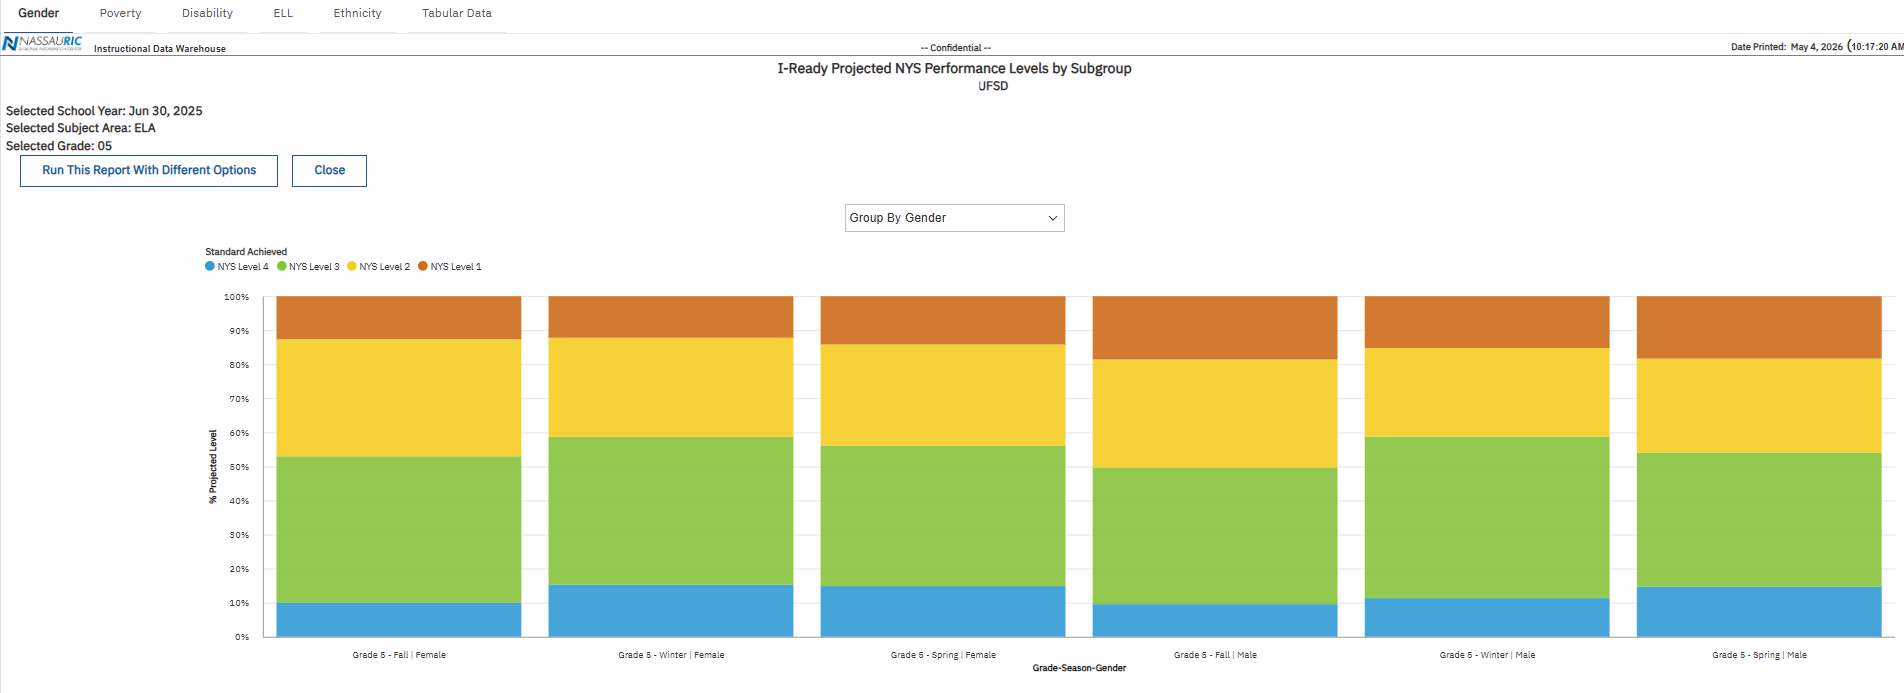
I-Ready Projected NYS Performance Levels by Subgroup
|
The I-Ready Projected NYS Performance Levels by Subgroup Report is a tabbed report that displays aggregated projections of NYS 3-8 proficiency based on student performance on the i-Ready assessments. Data are provided for each grade and season within a single year. Each tab, located at the top of the report page, provides a look at projected performance levels on the NYS assessments for each demographic category
|
|
|
|
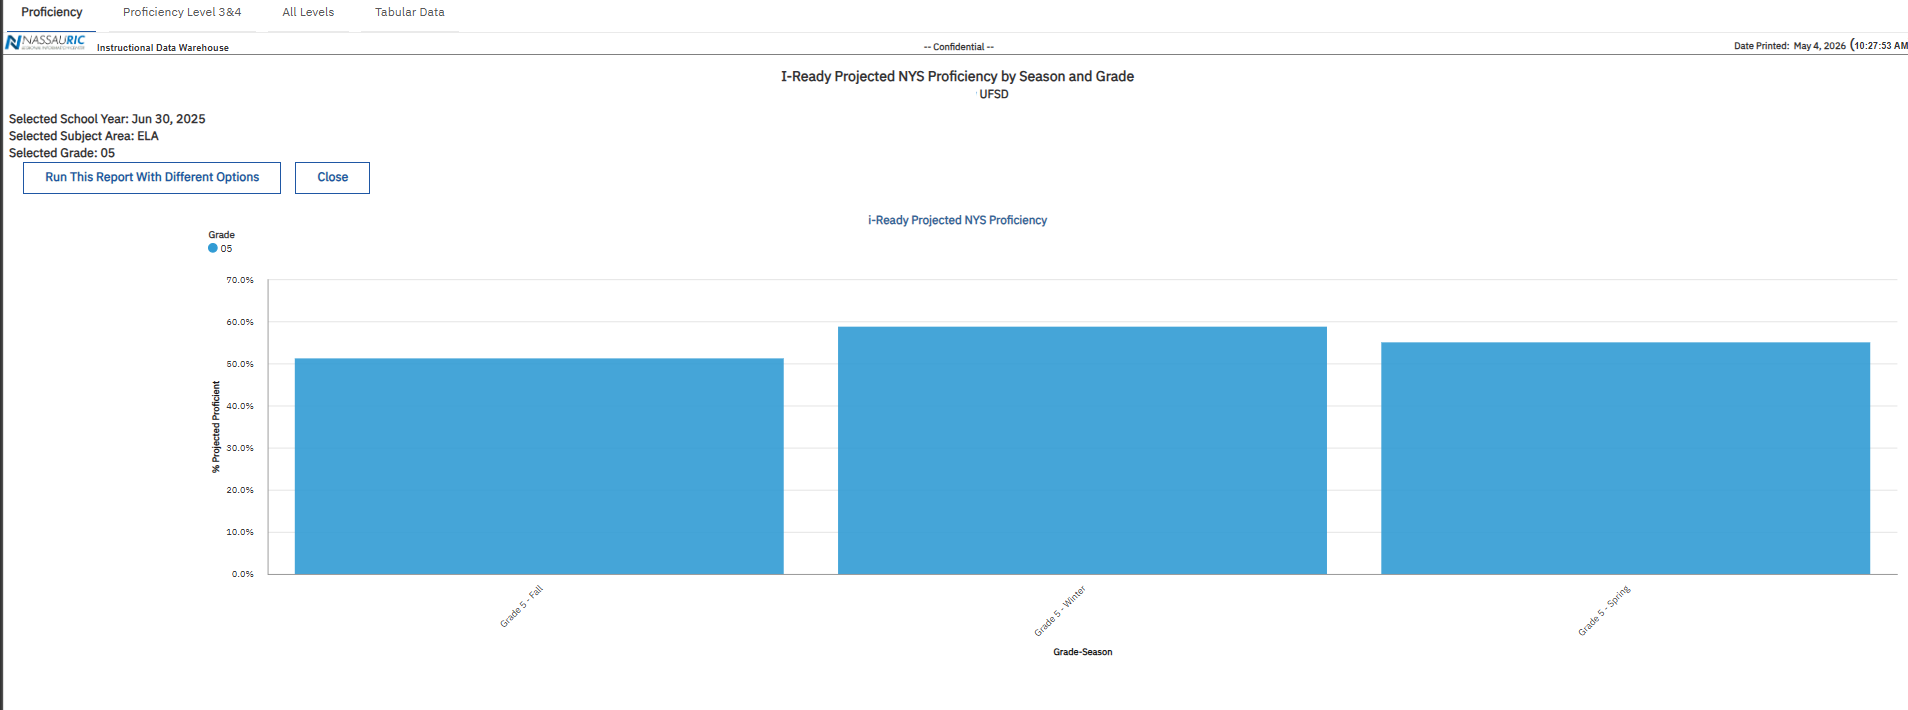
I-Ready Projected NYS Proficiency by Season and Grade
|
The I-Ready Projected NYS Proficiency by Season and Grade Report is a tabbed report that displays aggregated projections of NYS 3-8 proficiency based on student performance on the i-Ready assessments. Data are provided for each grade and season within a single year. Each tab, located at the top of the report page, provides a different look at projected proficiency/performance levels on the NYS assessments.
|
|
|
|
IB Dashboard
|
This dashboard shows statistics on IB tests, including the number of tests taken by student, grades of students,types of subject tests taken, and the number of tests taken by grade level.
|
|
|
|
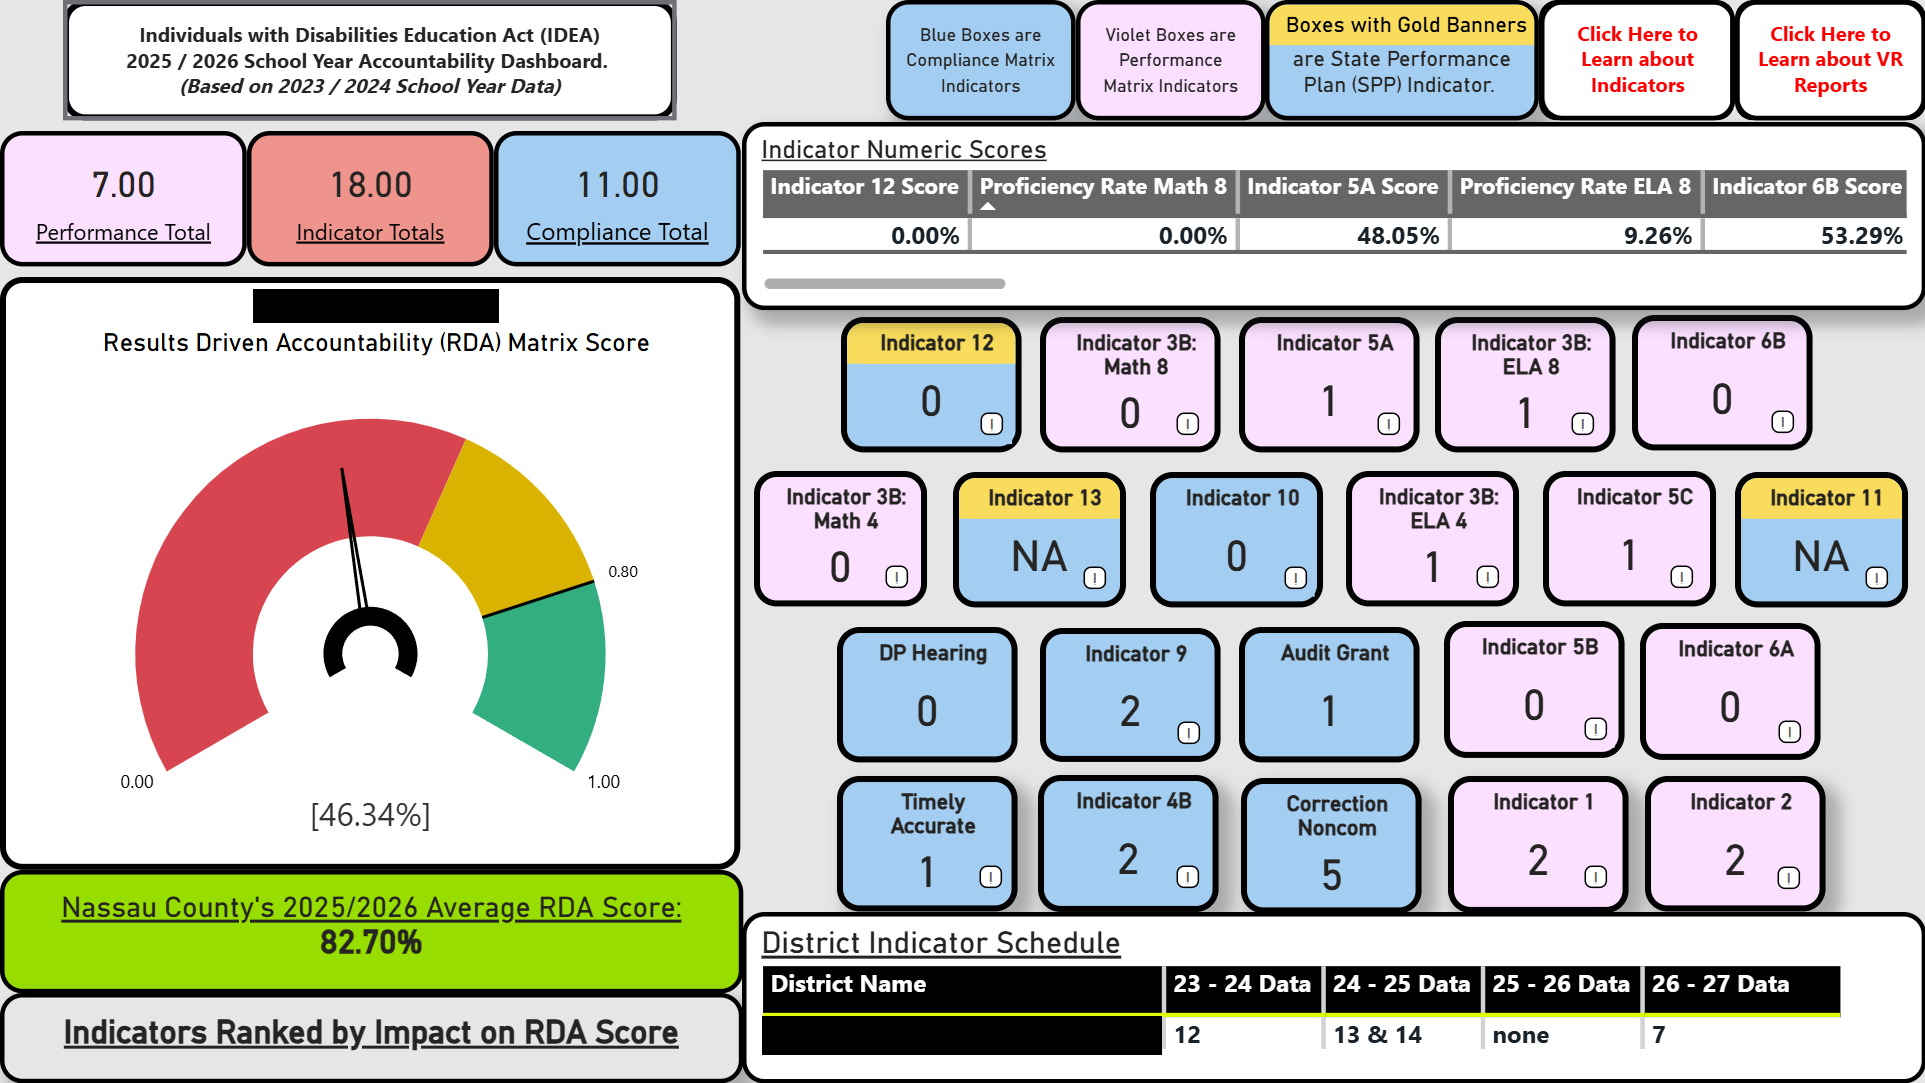
IDEA Accountability Dashboard
|
Visualize the IDEA Accountability data provided in the PD Data system. Easily access indicator documentation and compare your district to the county averages.
|
|
|
|
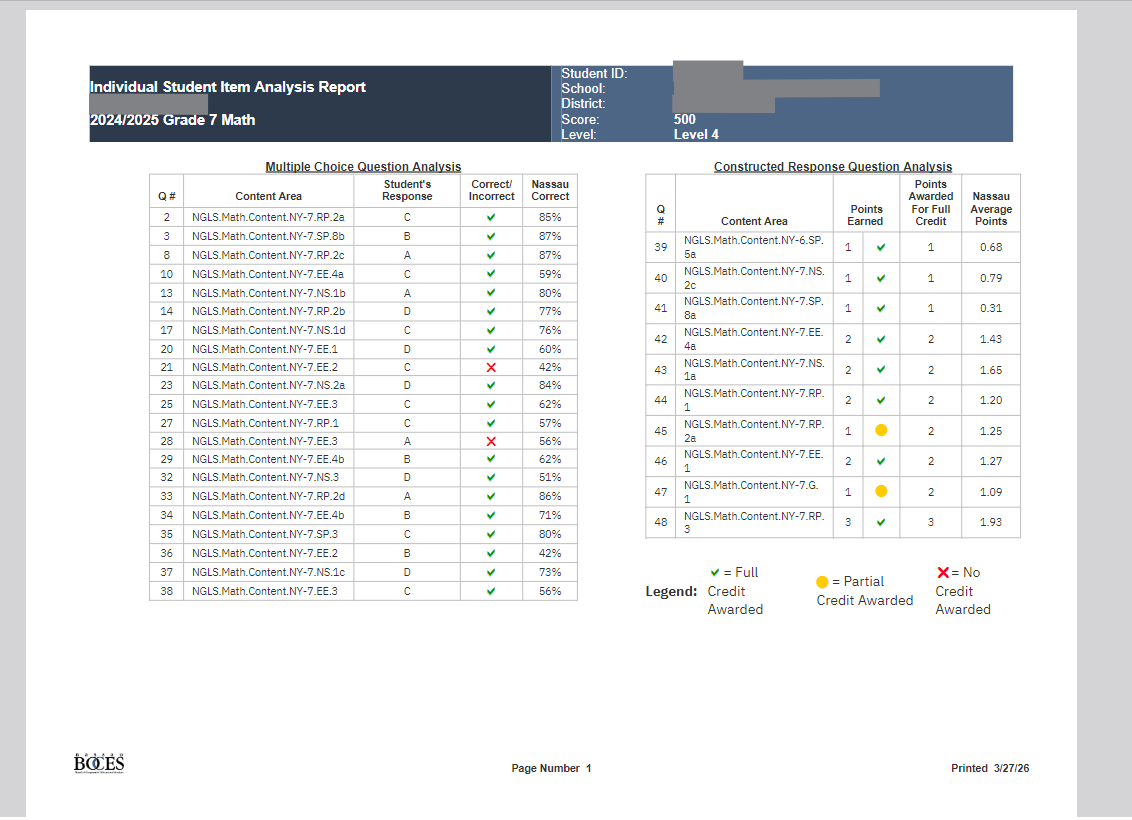
Individual Student Item Analysis Report
|
This report displays released question details for individual students on a particular assessment. It is intended for teachers to review with students and discuss how students performed on each question of a particular assessment.
|
|
|
|
Initial College Enrollment Outcomes (Multiple Colleges)
|
This report allows users to identify the outcomes for students who enroll in a specific college or university.
|
.png)
|
|
|
Initial College Enrollment Outcomes (Nassau County Benchmark)
|
Identify the aggregated outcomes for students in Nassau County who enroll in specific local and New York State colleges or universities.
|
|
|
|
Initial College Enrollment Outcomes (Single College)
|
This report allows users to identify the outcomes for students who enroll in a specific college or university.
|
.png)
|
|
|
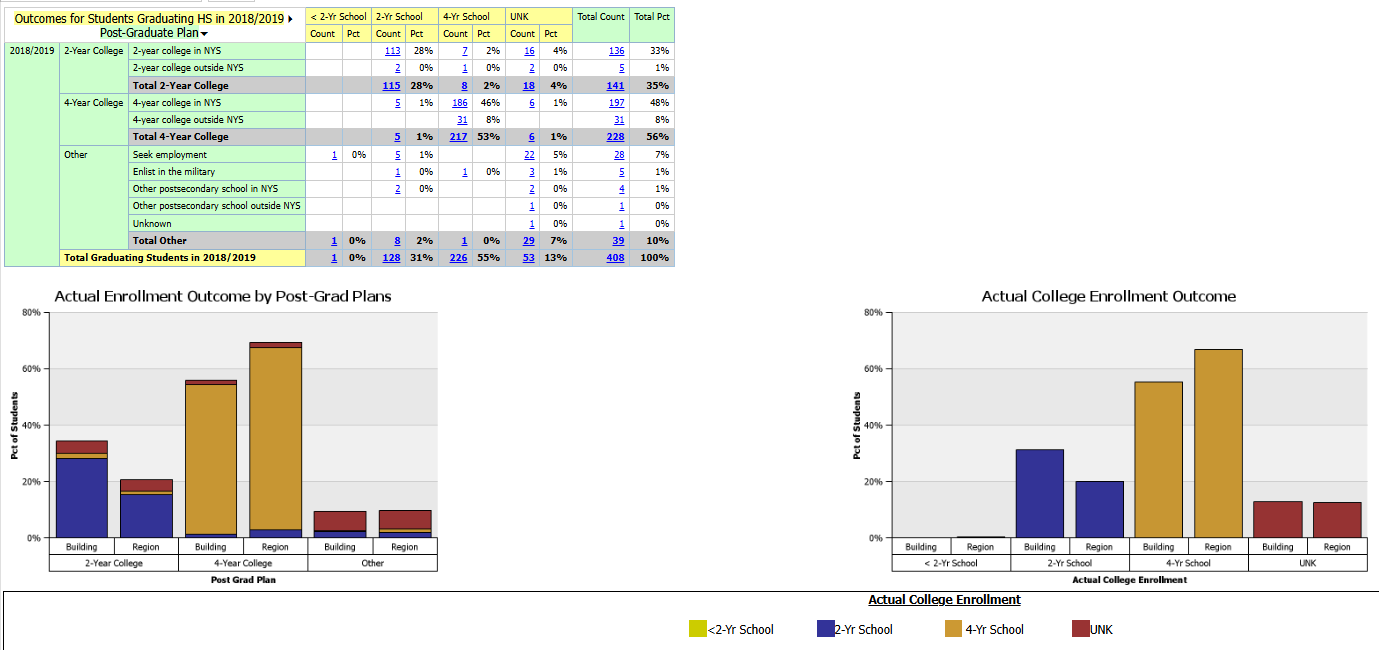
Intended Vs. Actual College Enrollment Summary
|
A college enrollment "dashboard" report comparing student post-grad plans to actual college enrollments. Drill-throughs to student level reports are available.
|
|
|
|
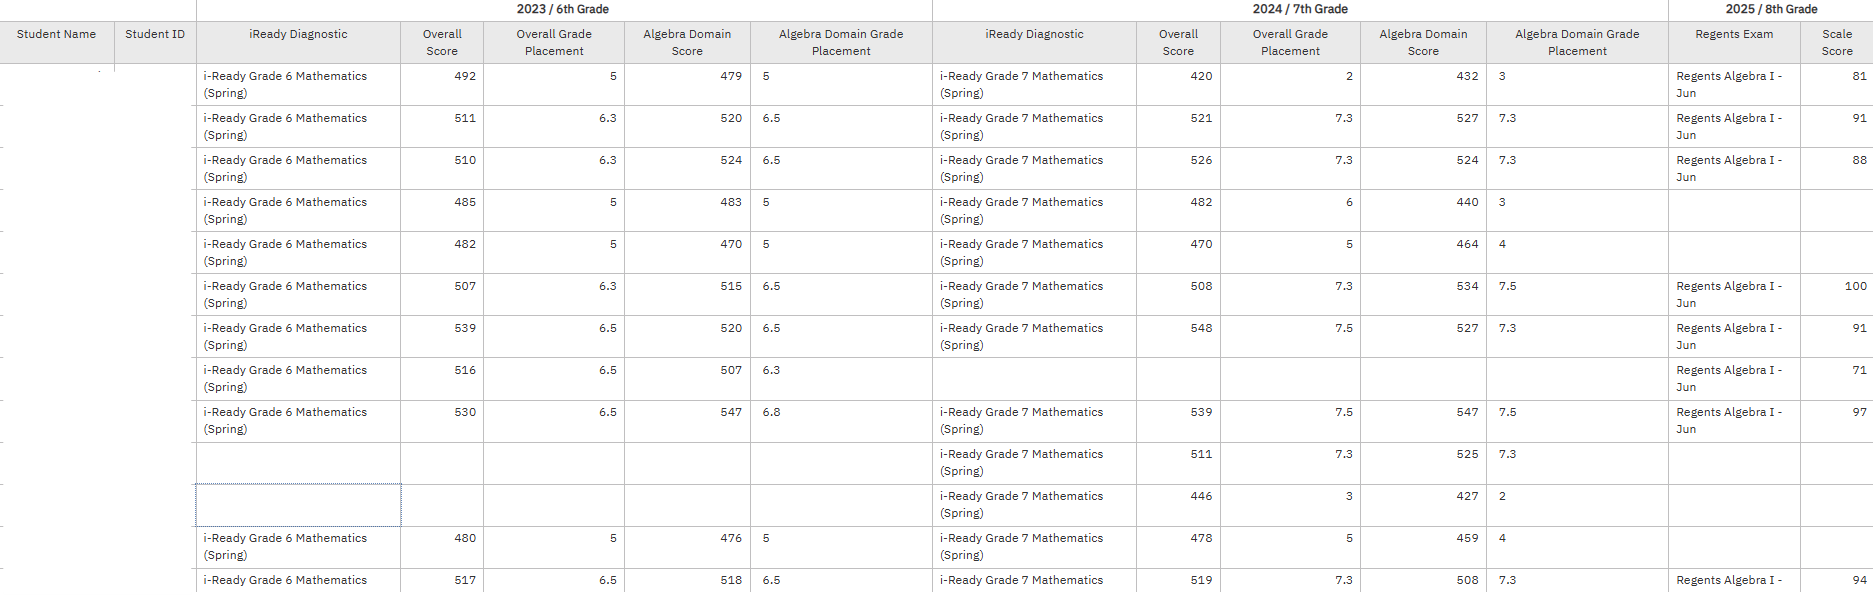
iReady Accelerated Algebra Student Longitudinal iReport
|
This report compares iReady math results for students in 6th and 7th grade with their 8th grade Algebra Regents results
|
|
|
|
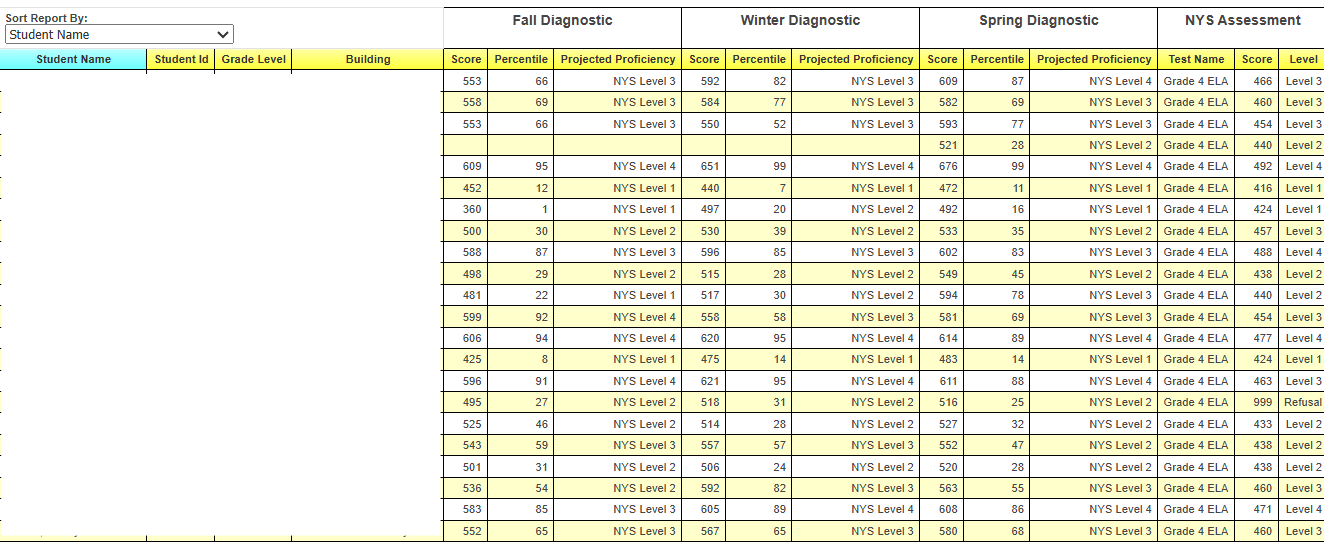
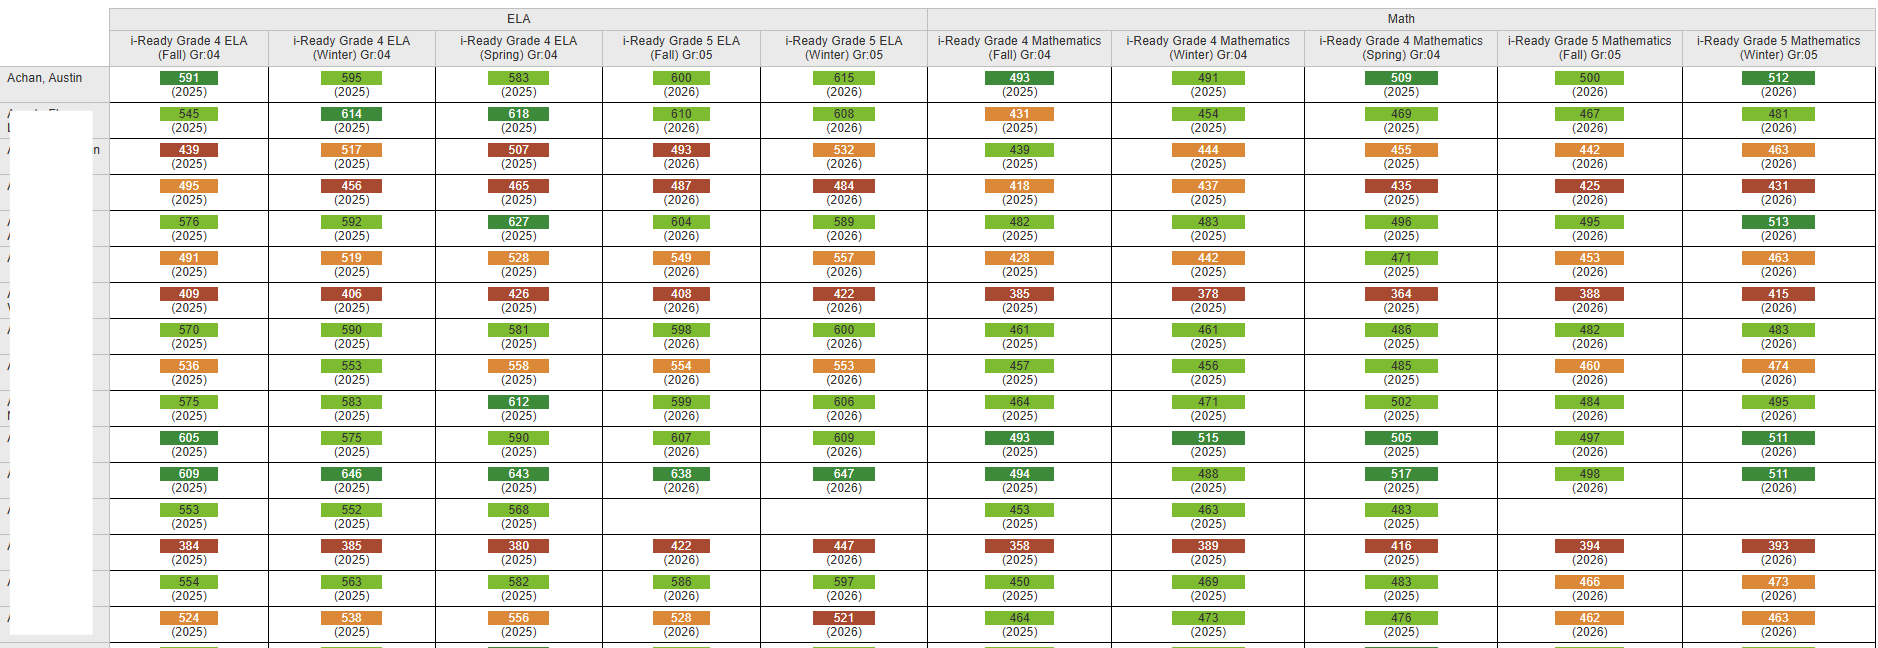
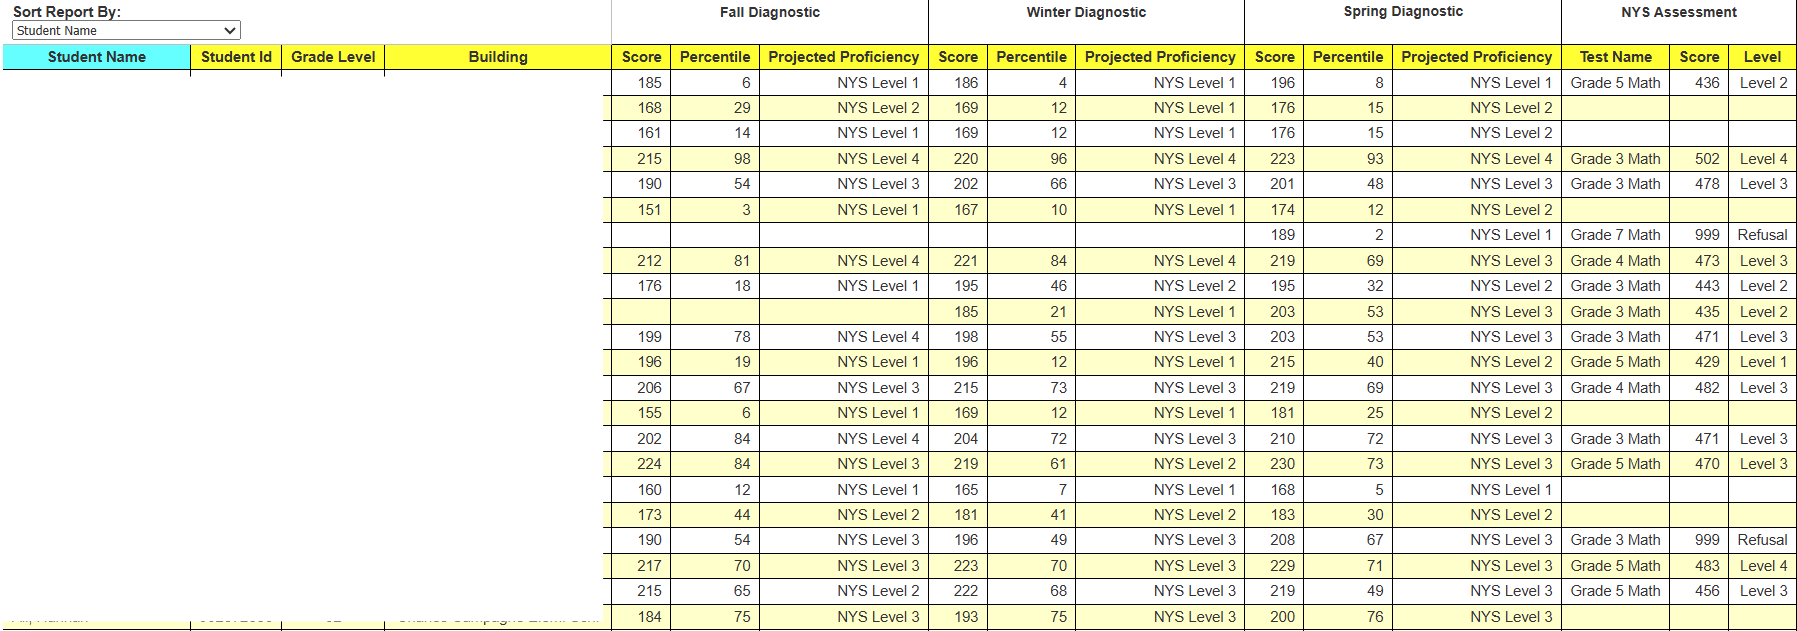
iReady and NYS Assessment Comparison
|
This report displays i-Ready Diagnostic data for all students and their available scores for any term (Fall, Winter, Spring) along with the official NYS results for the same subject area
|
|
|
|
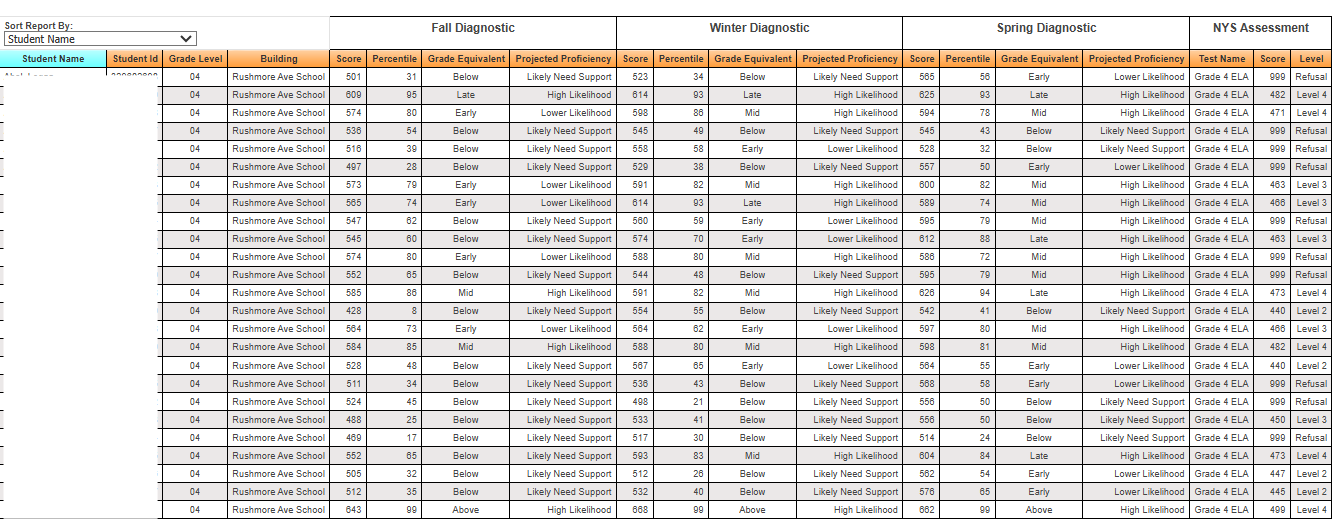
iReady and NYS Assessment Comparison Based on Grade Equivalency
|
This report displays i-Ready diagnostic data for all students and their available scores for any term (Fall, Winter, Spring) along with the official NYS results for the same subject area
|
|
|
|
iReady and NYS Assessment Comparison Download
|
This report displays i-Ready Diagnostic data for all students and their available scores for any term (Fall, Winter, Spring) along with the official NYS results for the same subject area in download Version
|
|
|
|
iReady Assessment Student Longitudinal
|
This report displays a list of all students and their complete historical,iReady scale scores for the selected school year of enrollment.
|
|
|
|
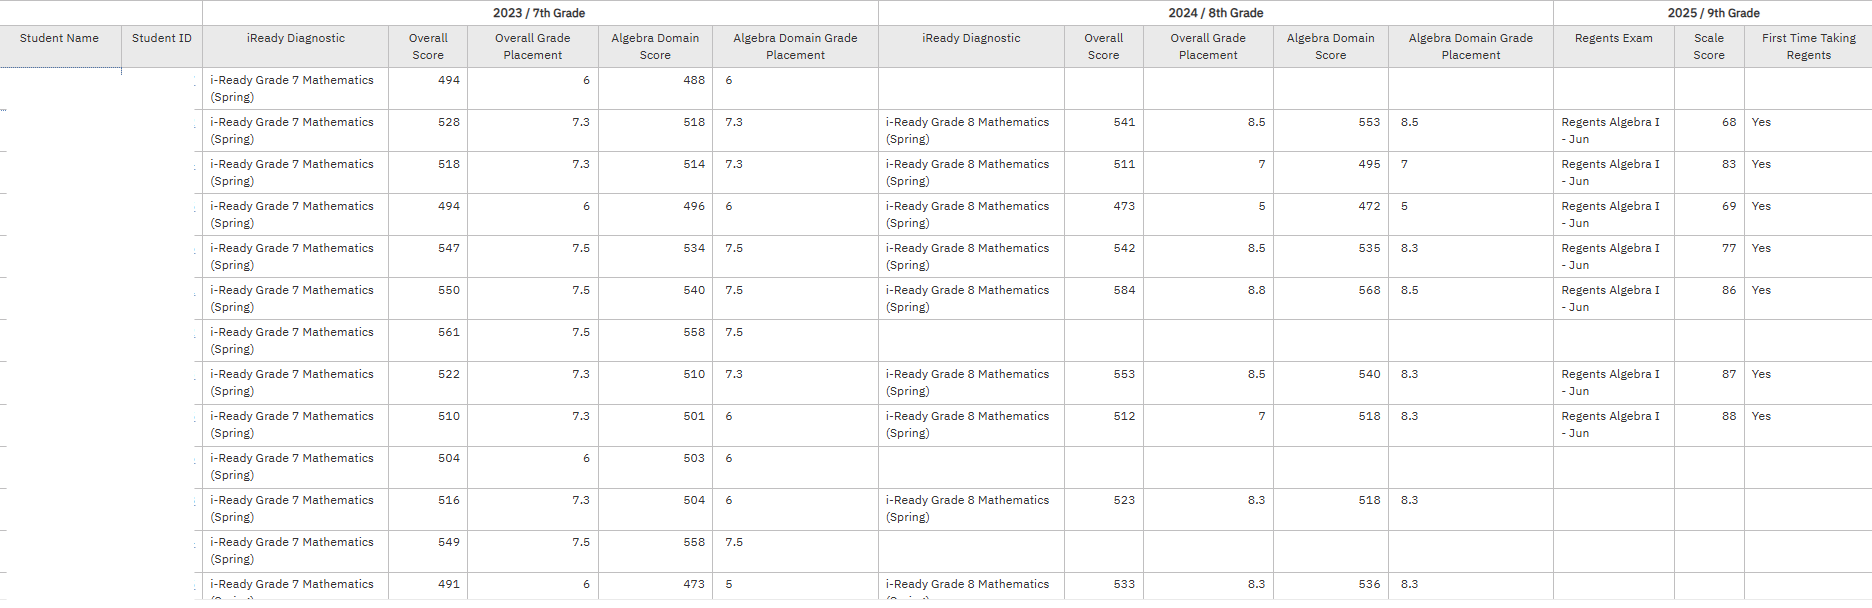
iReady Comparison to 9th Grade Algebra Regents iReport
|
This report compares iReady math results for students in7th and 8th grade with their 9thgrade June AlgegbraRegents rersults.
|
|
|
|
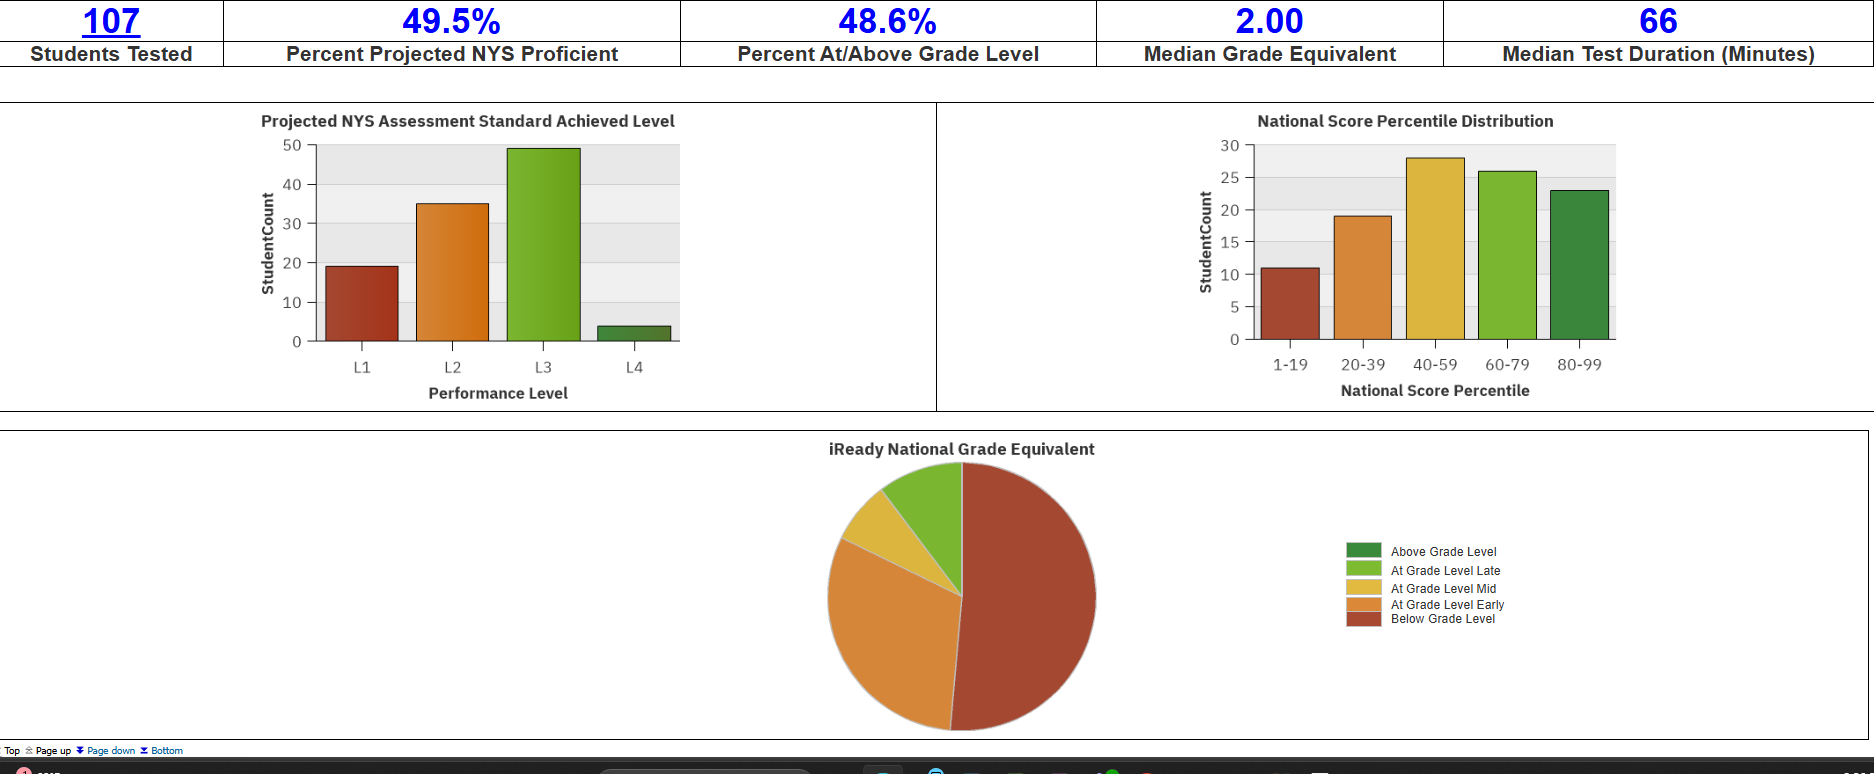
iReady Dashboard
|
This dashboard has 2 bar charts in all the iReady student's performance,national percentile and 1 pie chart in national grade equivalent.
|
|
|
|
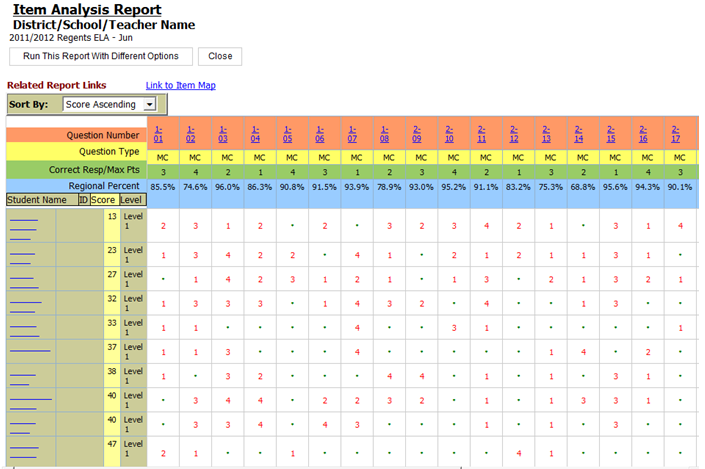
Item Analysis
|
Displays a list of students and their responses to all questions on a particular assessment.
|
|
|
|
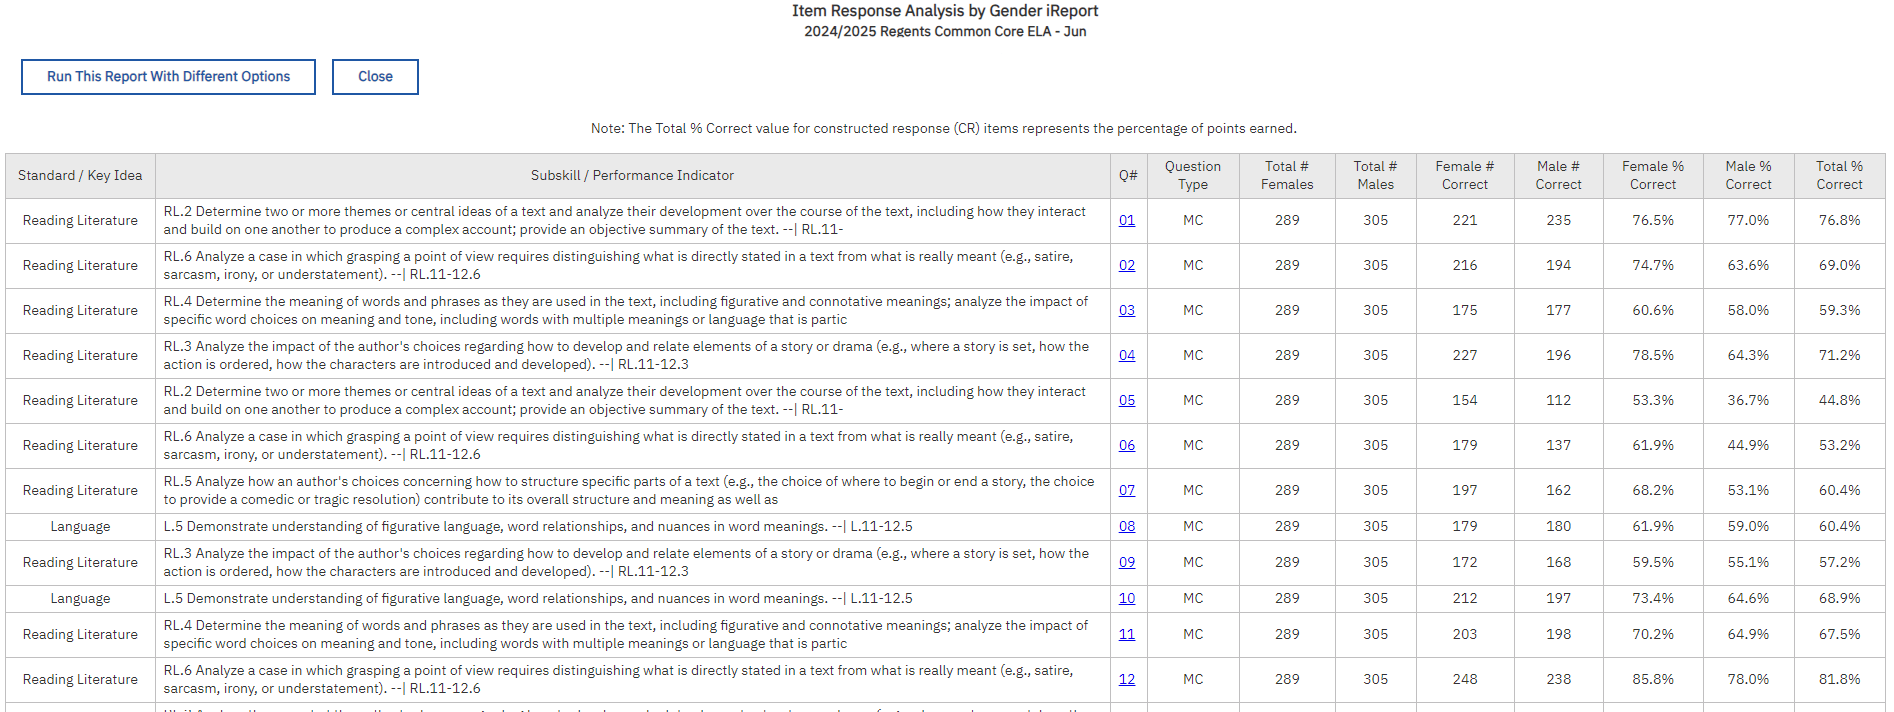
Item Response Analysis by Gender iReport
|
This report analyzes assessment item responses aggregated by gender. It is a interactive report which allows extensive filtering and sorting.
|
|
|
|
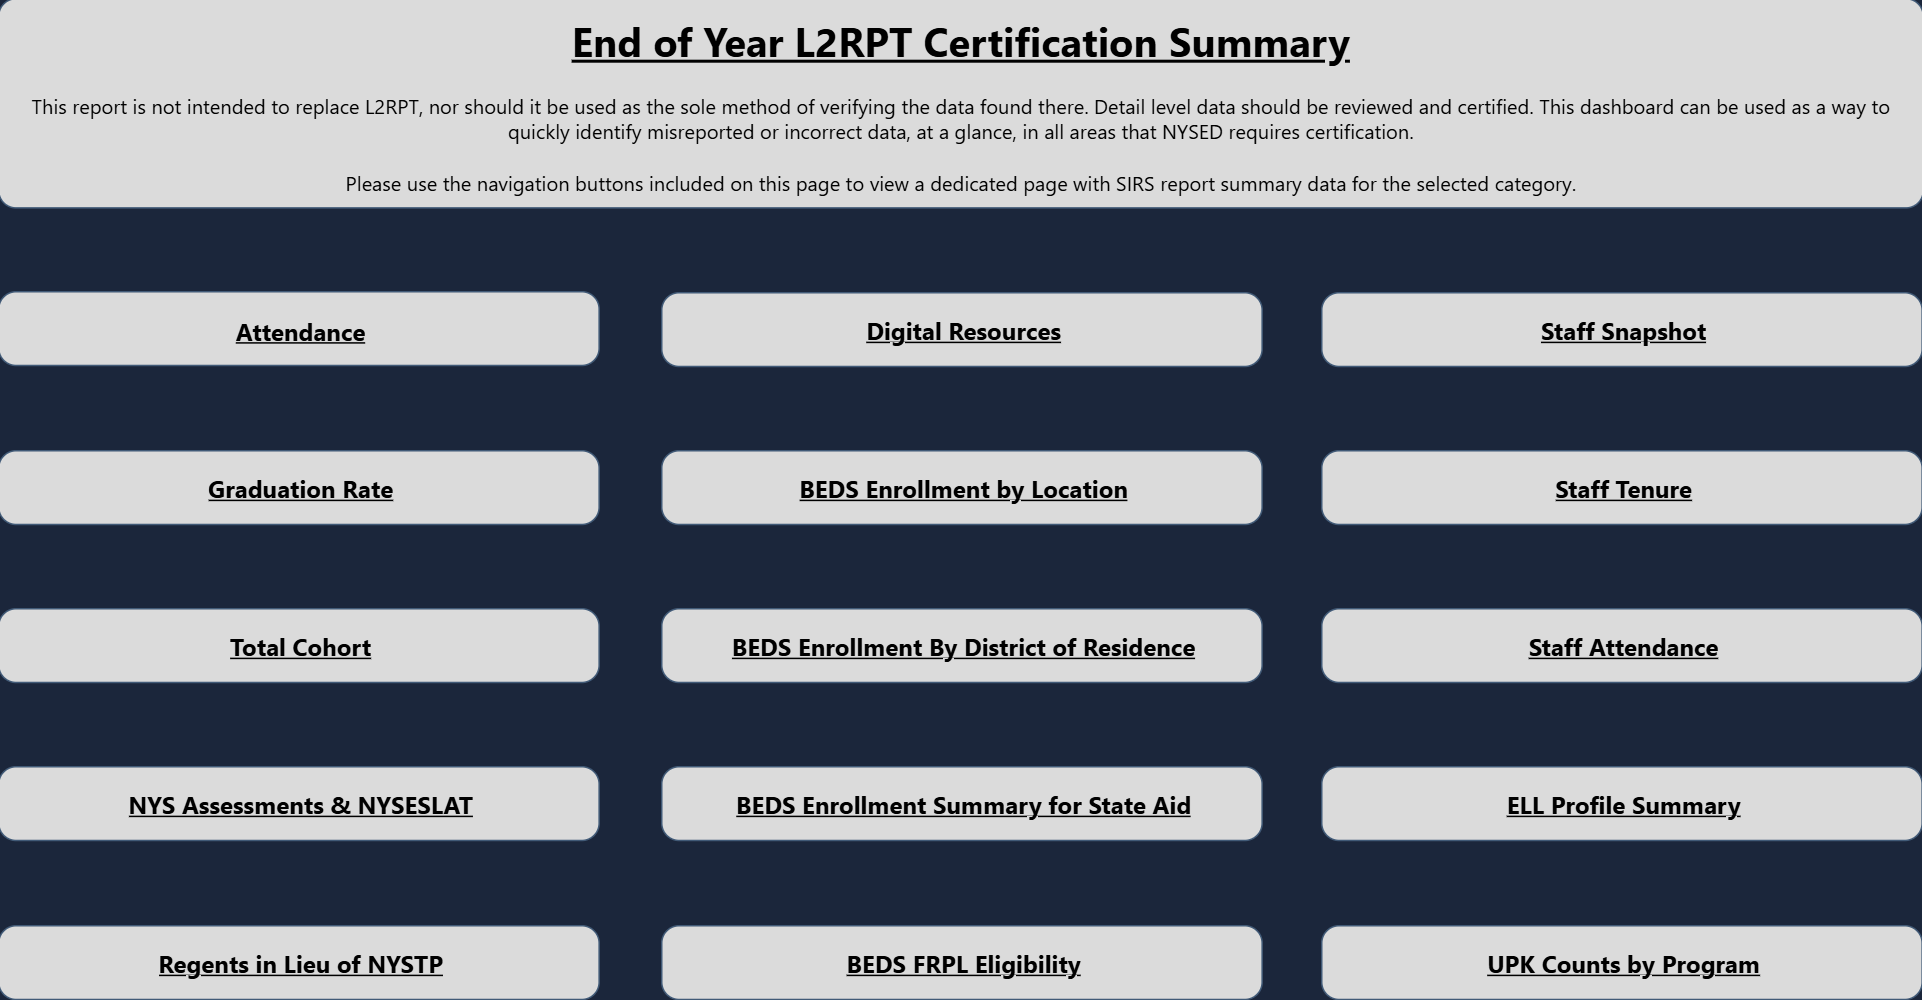
L2RPT EOY Summary
|
A collection of summaries from L2RPT reports related to End-of-Year data reporting and verification.
|
|
|
|
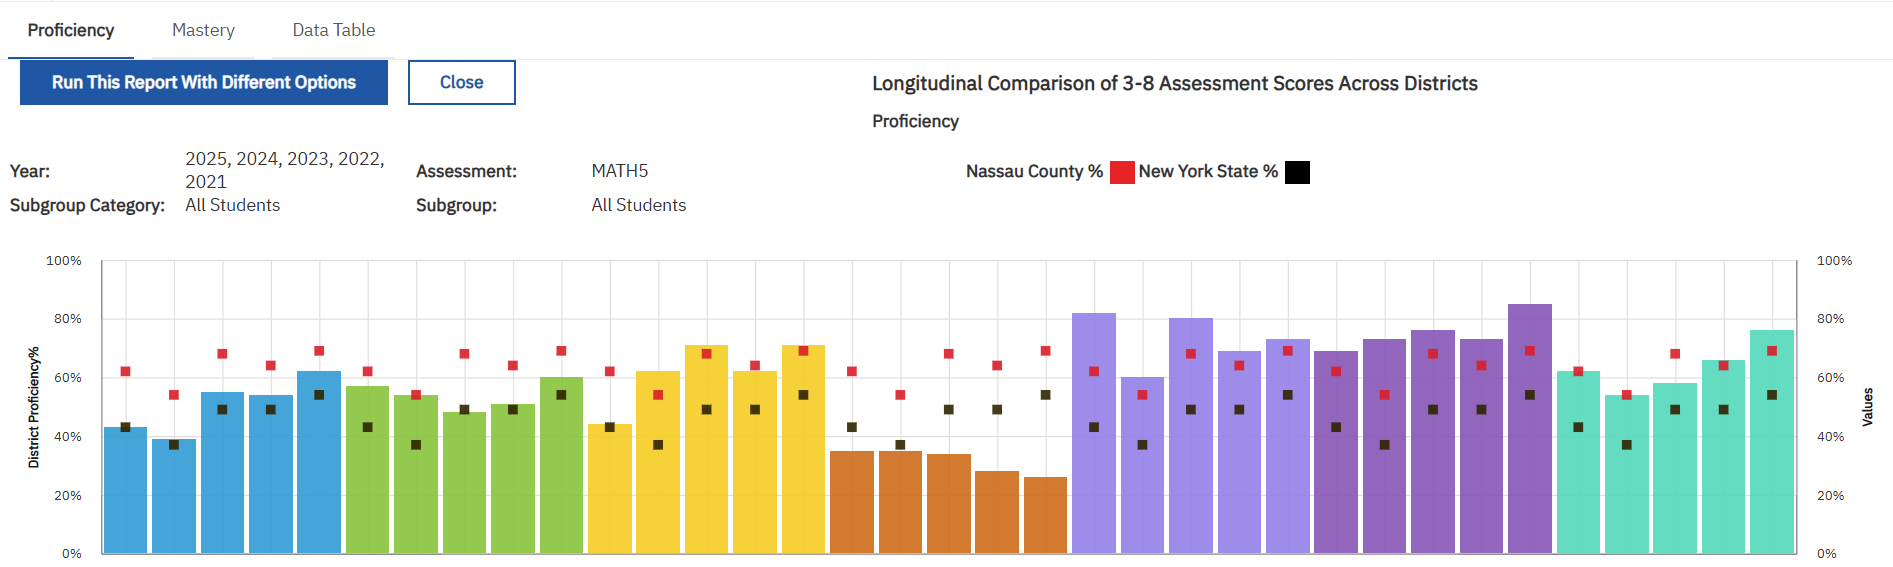
Longitudinal Comparison of 3-8 Assessment Scores Across Districts
|
Multi-tabbed longitudinal comparison of NYS 3-8 ELA, Math, and Science scores across multiple school districts. Based on public data from NYSED Report Card.
|
|
|
|
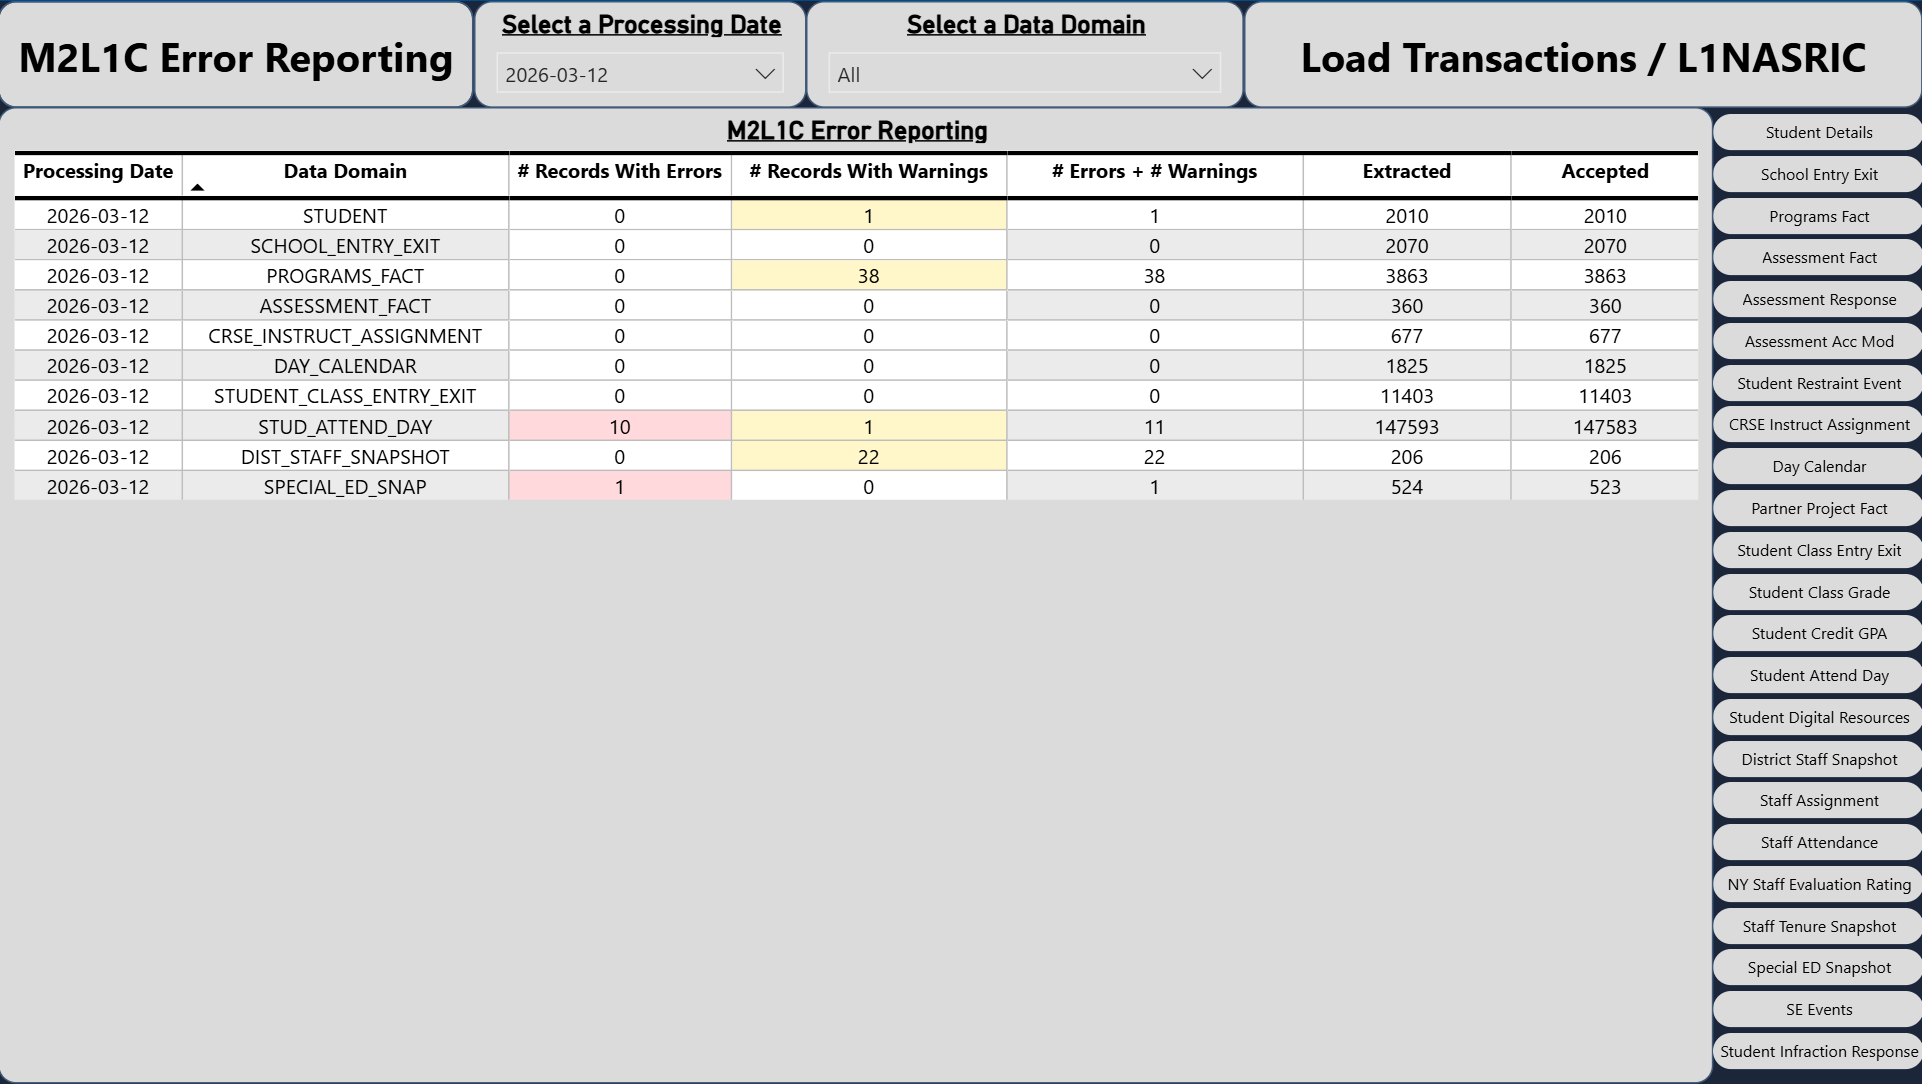
M2L1C Error Dashboard
|
The easiest way to view errors in the Level 1 to Level 2 data migration.
|
|
|
|
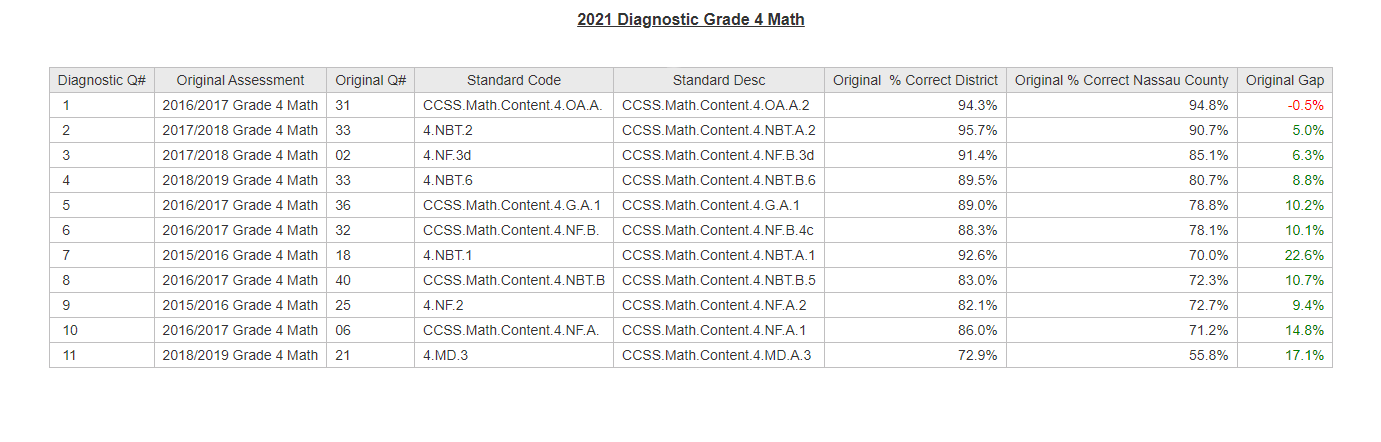
Math and ELA Diagnostic Assessment Mapping
|
This report displays the questions given on the 2020-2021 ELA and math diagnostic assessments and how the students in your district or building originally performed when the questions were first given on the official NYS assessments.
|
|
|
|
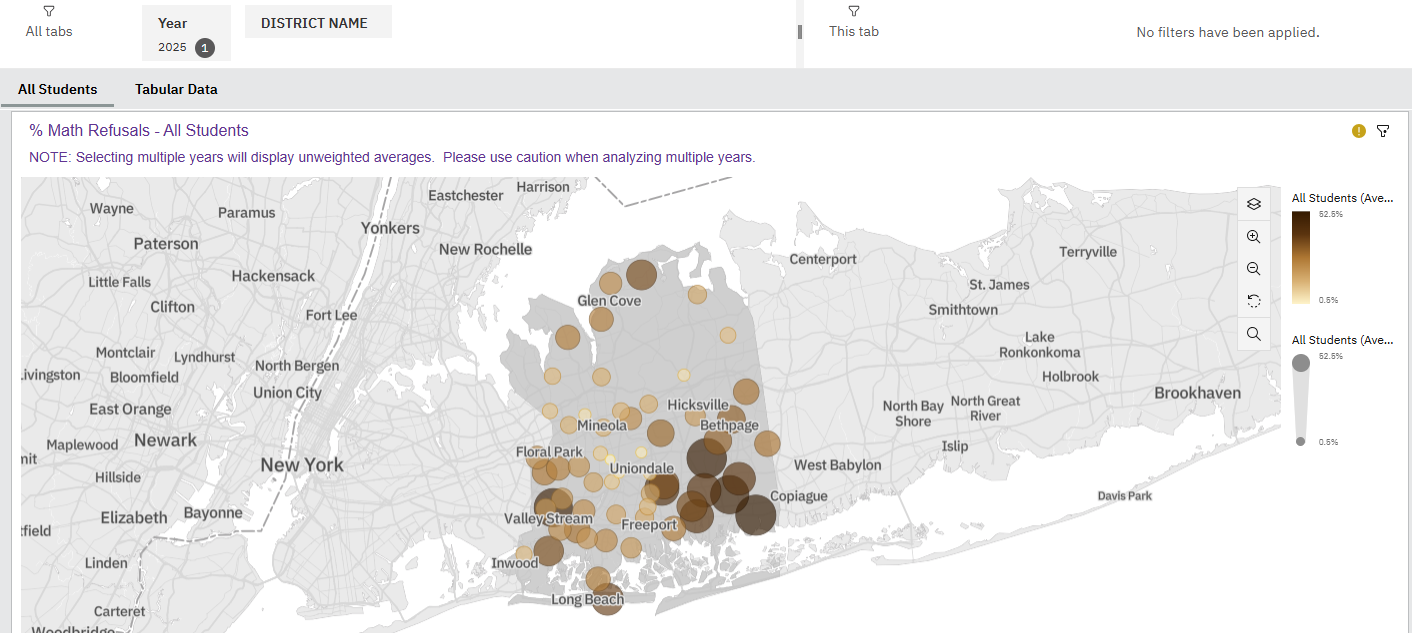
Math Refusals
|
Map that plots 3-8 Math refusal rates for all Nassau County school districts. Based on public data frm the NYSED Report Card.
|
|
|
|
NTPP Report
|
Non-teaching Professional Profile Report - review Staff Snapshot, Assignment and certification information for all non-teaching staff.
|
|
|
|
NWEA Accelerated Algebra Student Longitudinal iReport
|
This report compares NWEA math results for students in 6th and 7th grade with their 8th grade Algebra Regents results
|
|
|
|
NWEA and NYS Assessment Comparison
|
This report displays NWEA Diagnostic data for all students and their available scores for any term (Fall, Winter, Spring) of an NWEA Diagnostic. The user has the ability to filter by a particular grade level or any of the demographic
|
|
|
|
NWEA and NYS Assessment Comparison Download
|
This report displays NWEA Diagnostic data for all students and their available scores for any term (Fall, Winter, Spring) of an NWEA Diagnostic in dowlnload version
|
|
|
|
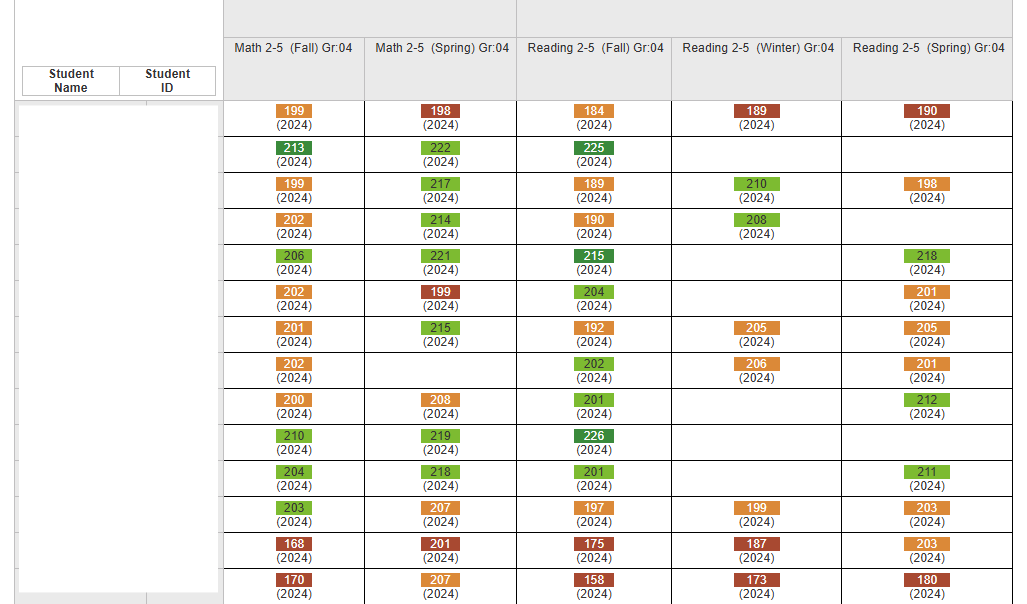
NWEA Assessment Student Longitudinal
|
This report displays a list of all students and their complete historical NWEA RIT scores for the selected school year of enrollment. Data are grouped longitudinally by subject area.
|
|
|
|
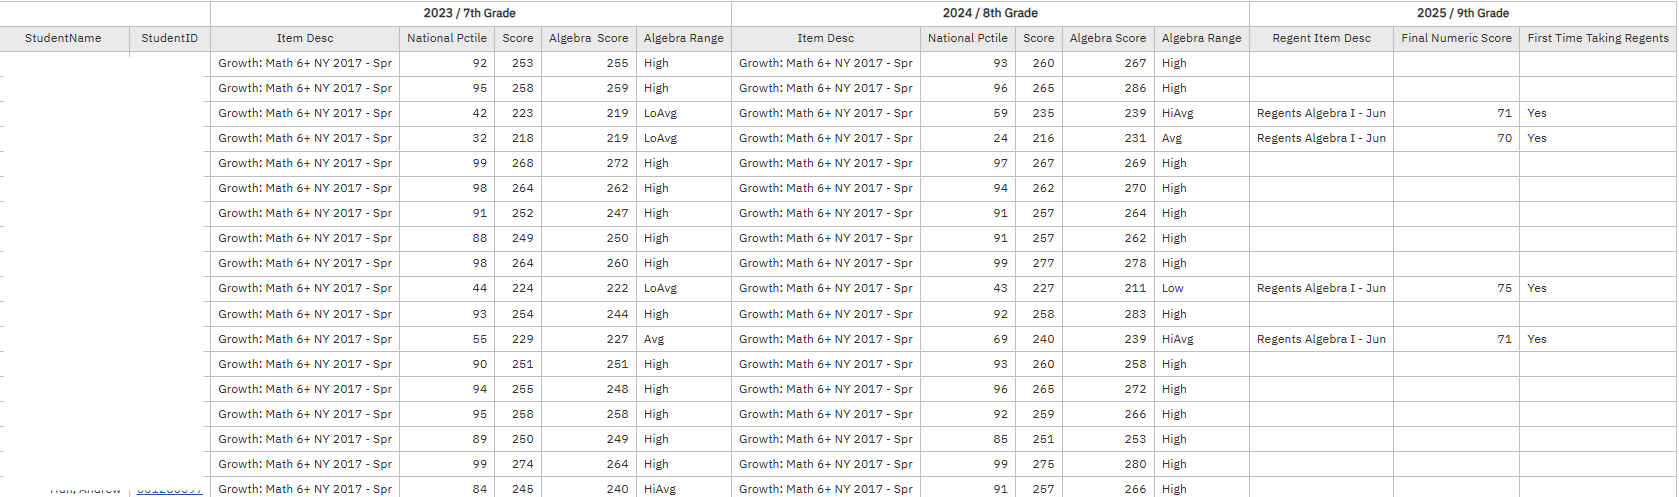
NWEA Comparison to 9th Grade Algebra Regents iReport
|
This report compares NWEA math results for students in 7th and 8th grade with their 9th grade June Algebra Regents results.
|
|
|
|
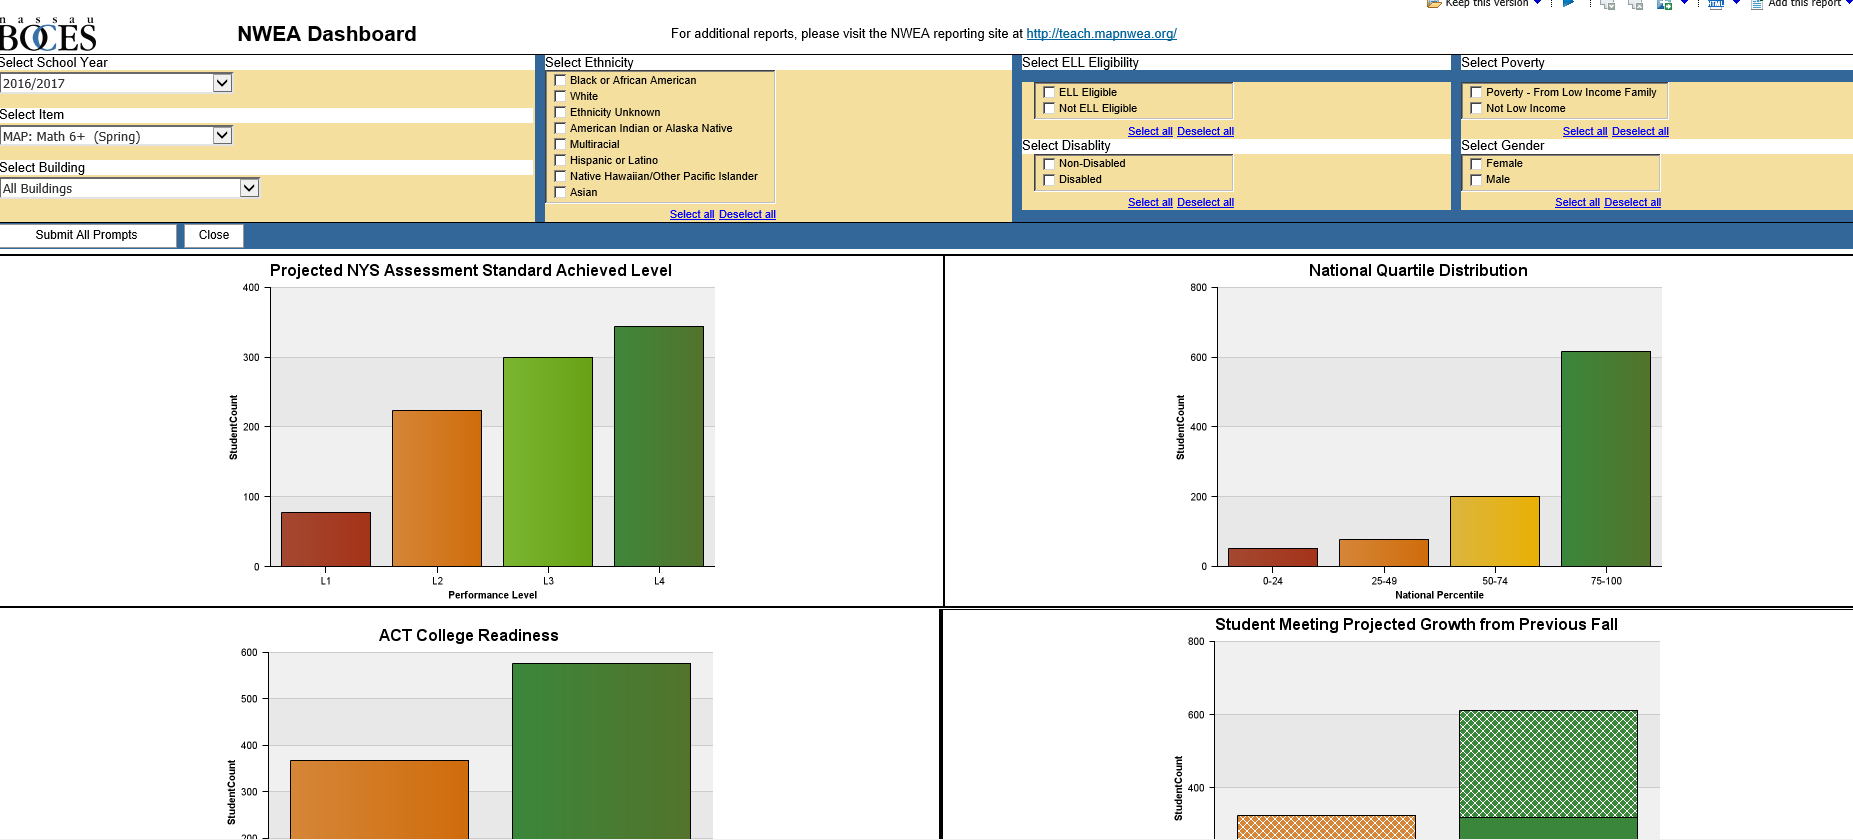
NWEA Dashboard
|
This dashboard has 3 bar charts in all the NWEA students' performance, national quintile distrubution, ACT and 1 stack bar chart in projected growth for each season with demographic filter
|
|
|
|
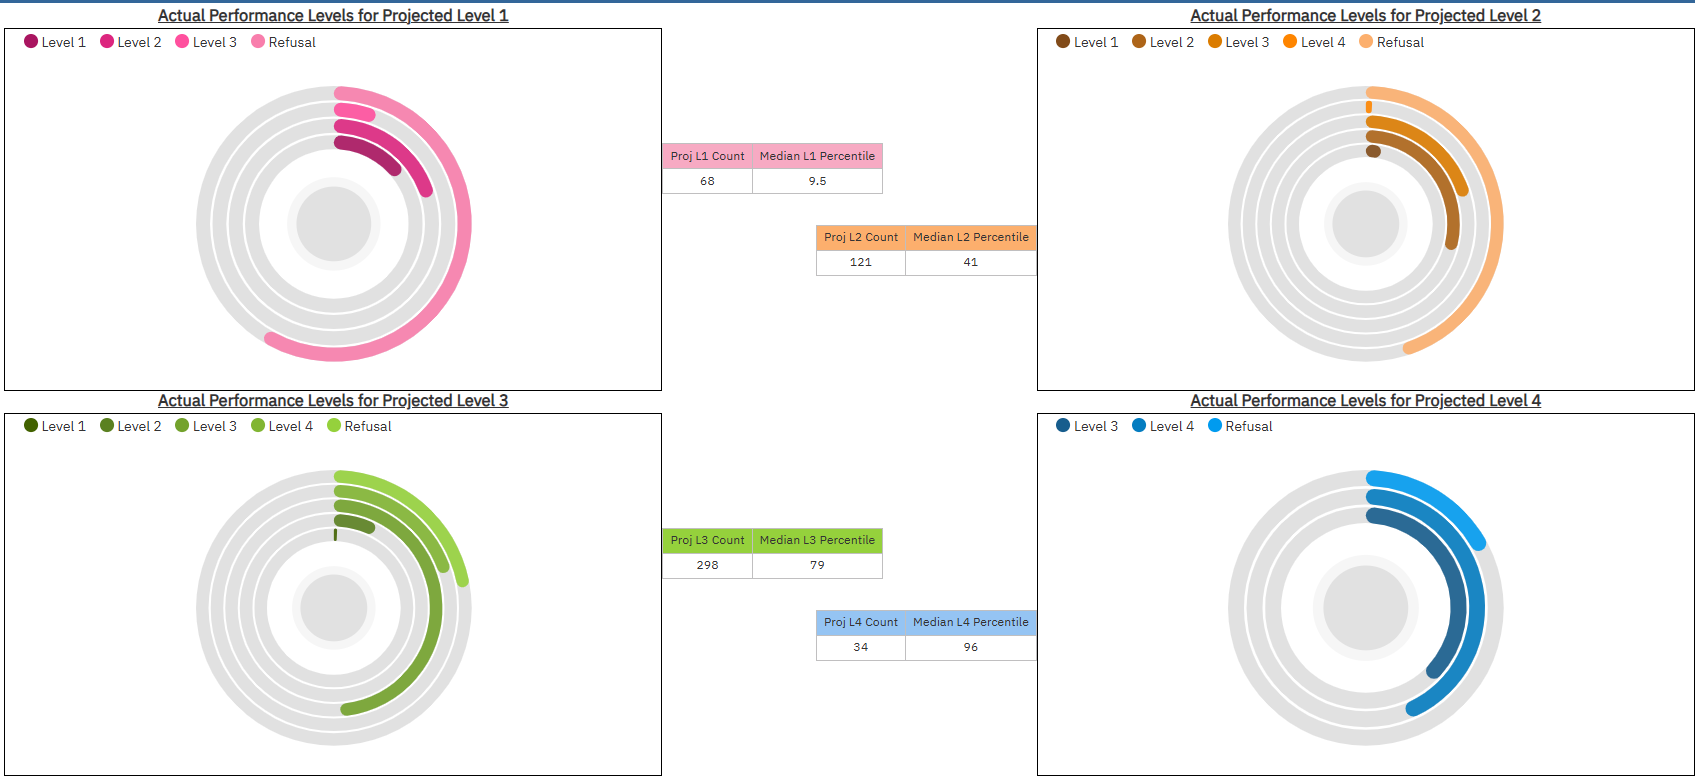
NWEA NYS Projection Dashboard – Individual Level Summary
|
This dashboard list the percentage of acutal NYS Performance levels vs NWEA projected level for individual levels
|
|
|
|
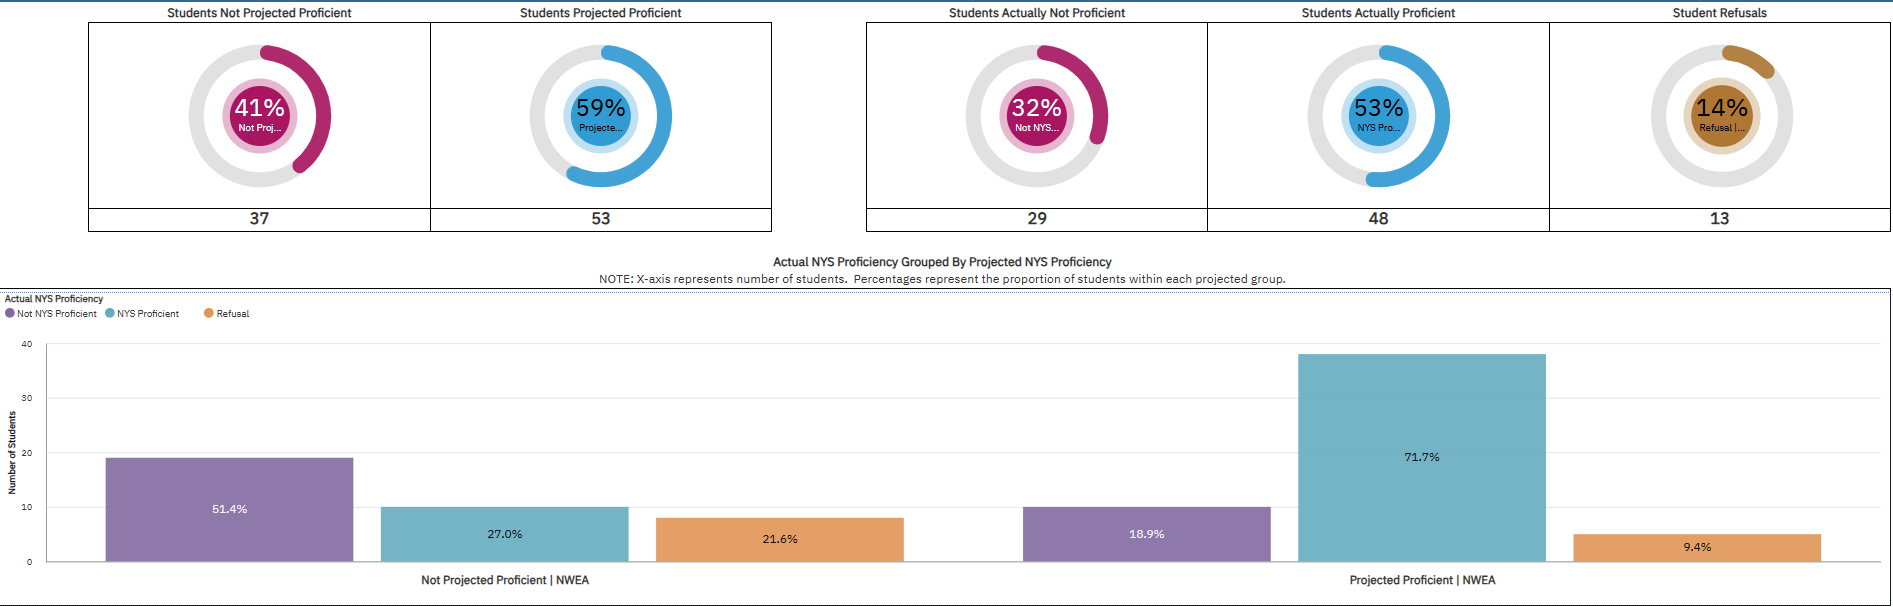
NWEA NYS Projection Dashboard – Overall Proficiency Summary
|
This dashboard list the percentage of actual NYS proficiency and NWEA projected proficiency.
|
|
|
|
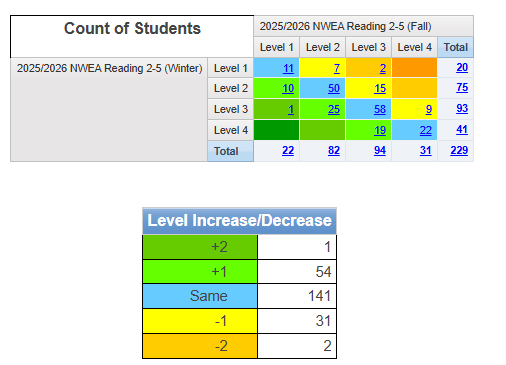
NWEA Projected NYS Performance Level Change
|
This report examines changes in student projected NYS proficiency over two different administrations of the NWEA assessment. Projected proficiency estimates how a student will perform on the NYS 3-8 ELA and Math assessments. Only students taking both selected NWEA assessments will be included.
|
|
|
|
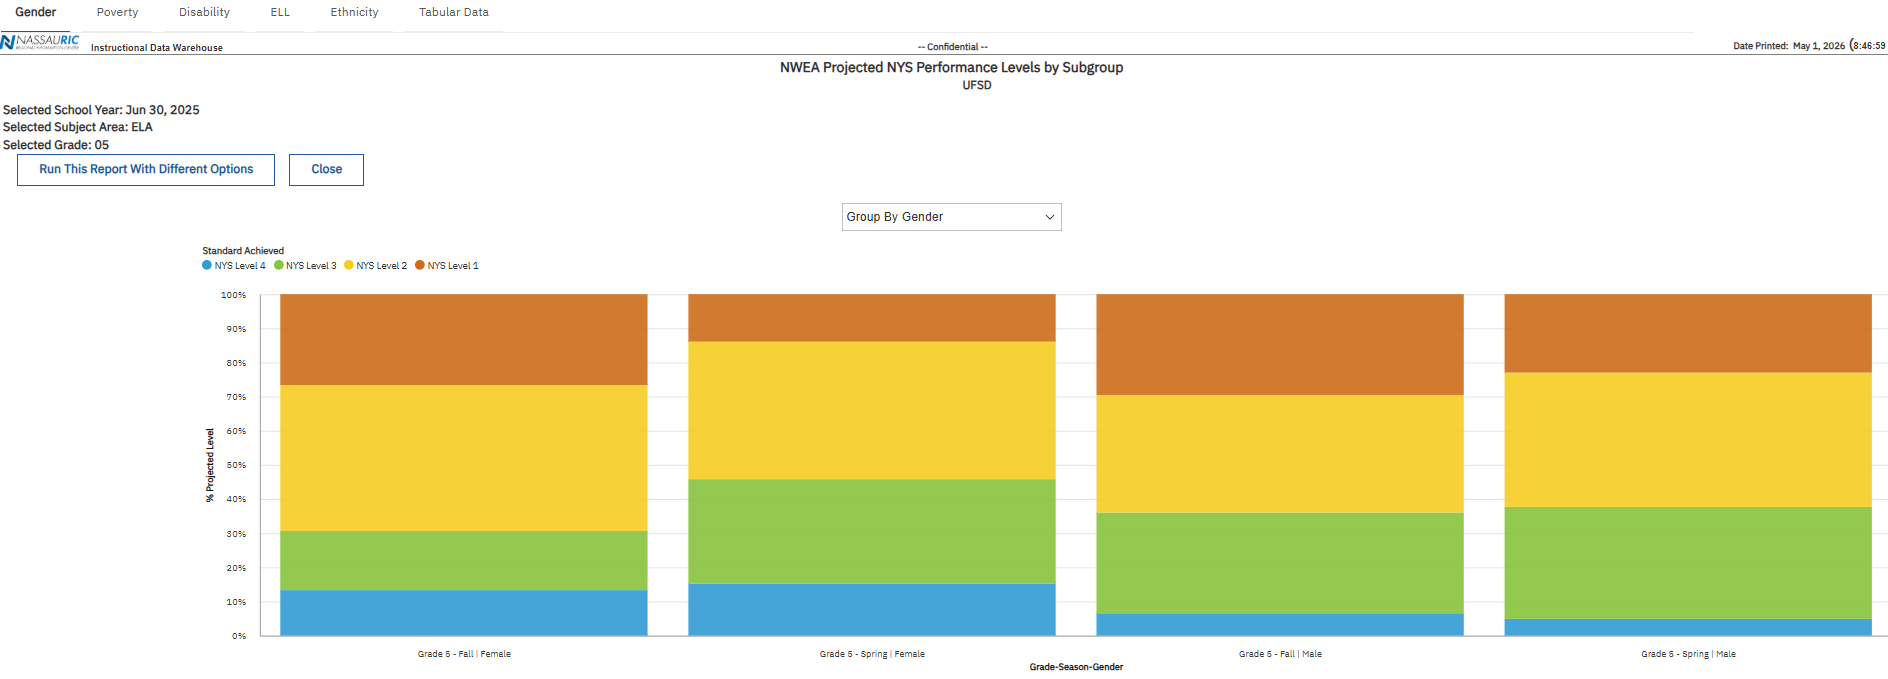
NWEA Projected NYS Performance Levels by Subgroup
|
The NWEA Projected NYS Performance Levels by Subgroup report is a tabbed report that displays aggregated achievement level projections on the NYS 3-8 assessments based on student performance on the NWEA assessments. Data are provided for each season, within a single year and grade. Each tab, located at the top of the report page, displays a different demographic subgroup: gender, poverty, disability, ELL, and ethnicity
|
|
|
|
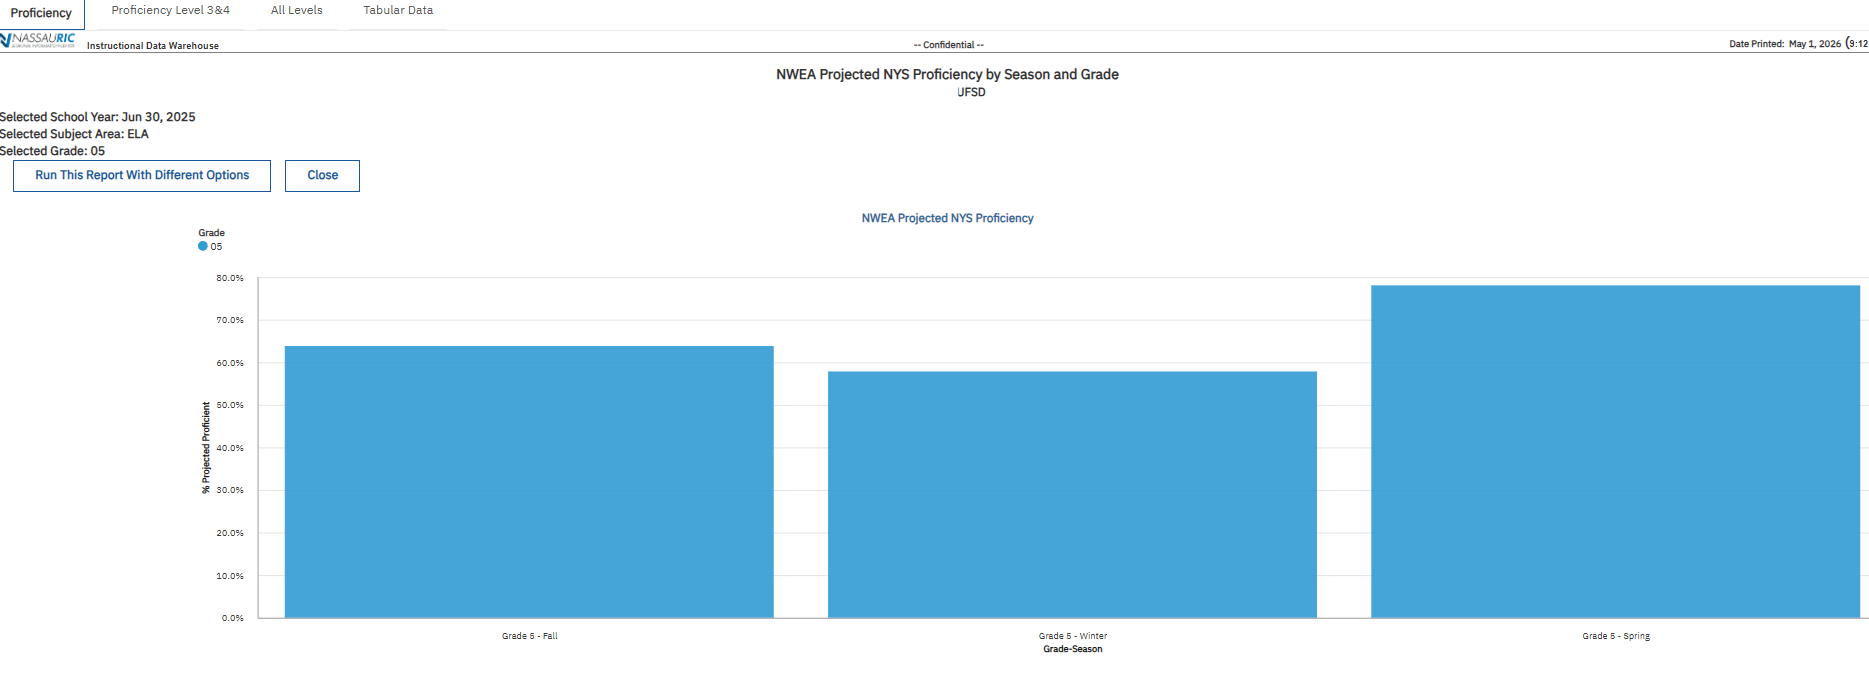
NWEA Projected NYS Proficiency by Season and Grade
|
The NWEA Projected NYS Proficiency by Season and Grade Report is a tabbed report that displays aggregated projections of NYS 3-8 proficiency based on student performance on the NWEA assessments. Data are provided for each grade and season within a single year. Each tab, located at the top of the report page, provides a different look at projected proficiency/performance levels on the NYS assessments. The
|
|
|
|
NYS & Regents Annual Assessment Summary
|
This report allows users to look at performance on all NYS ELA, NYS Math, and Regents exams for your home district and one comparison district for a particular School Year. Based on public data from the NYSED Report Card.
|
|
|
|
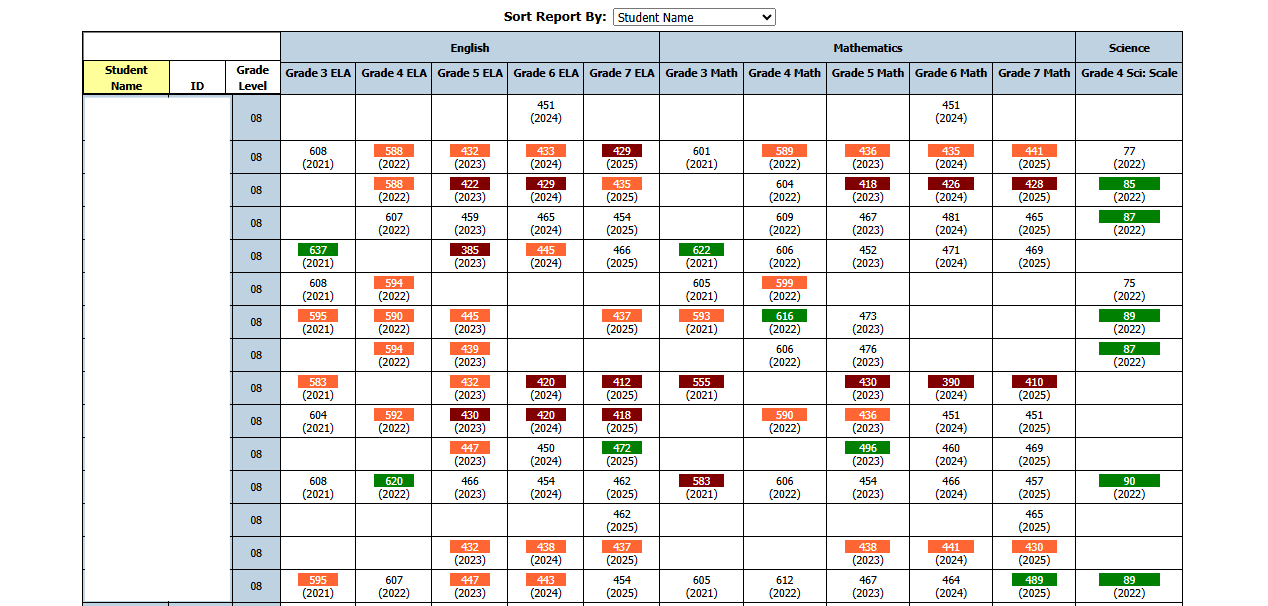
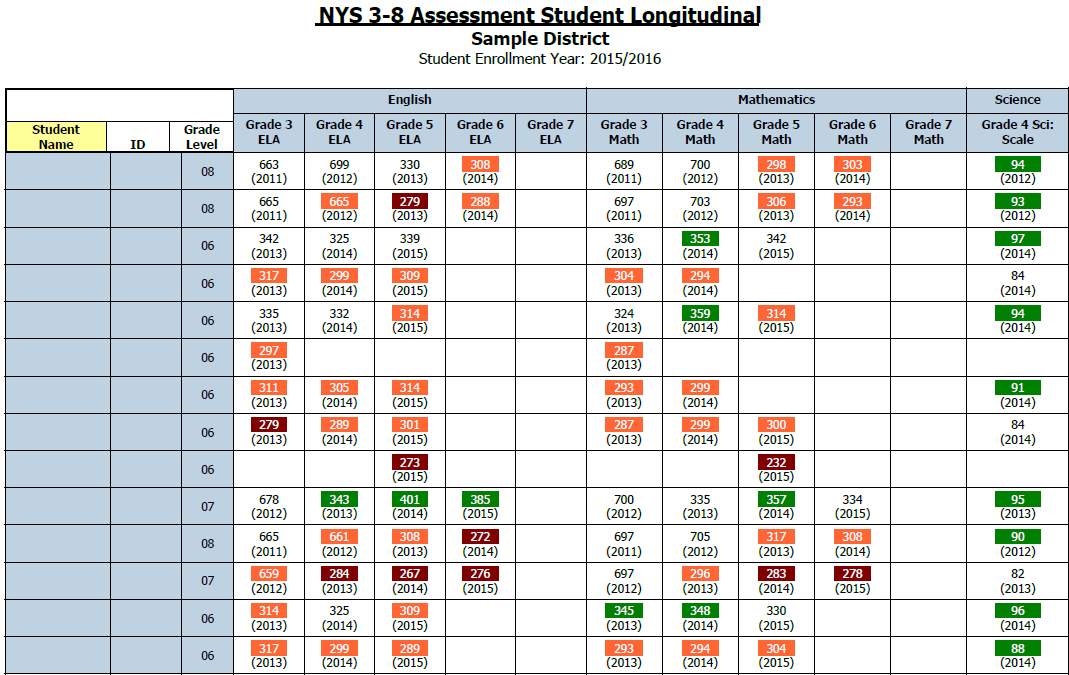
NYS 3-8 Assessment Student Longitudinal
|
This report displays grades 3-8 NYS Assessment for all students longitudinally; students results are displayed over multiple years.
|
|
|
|
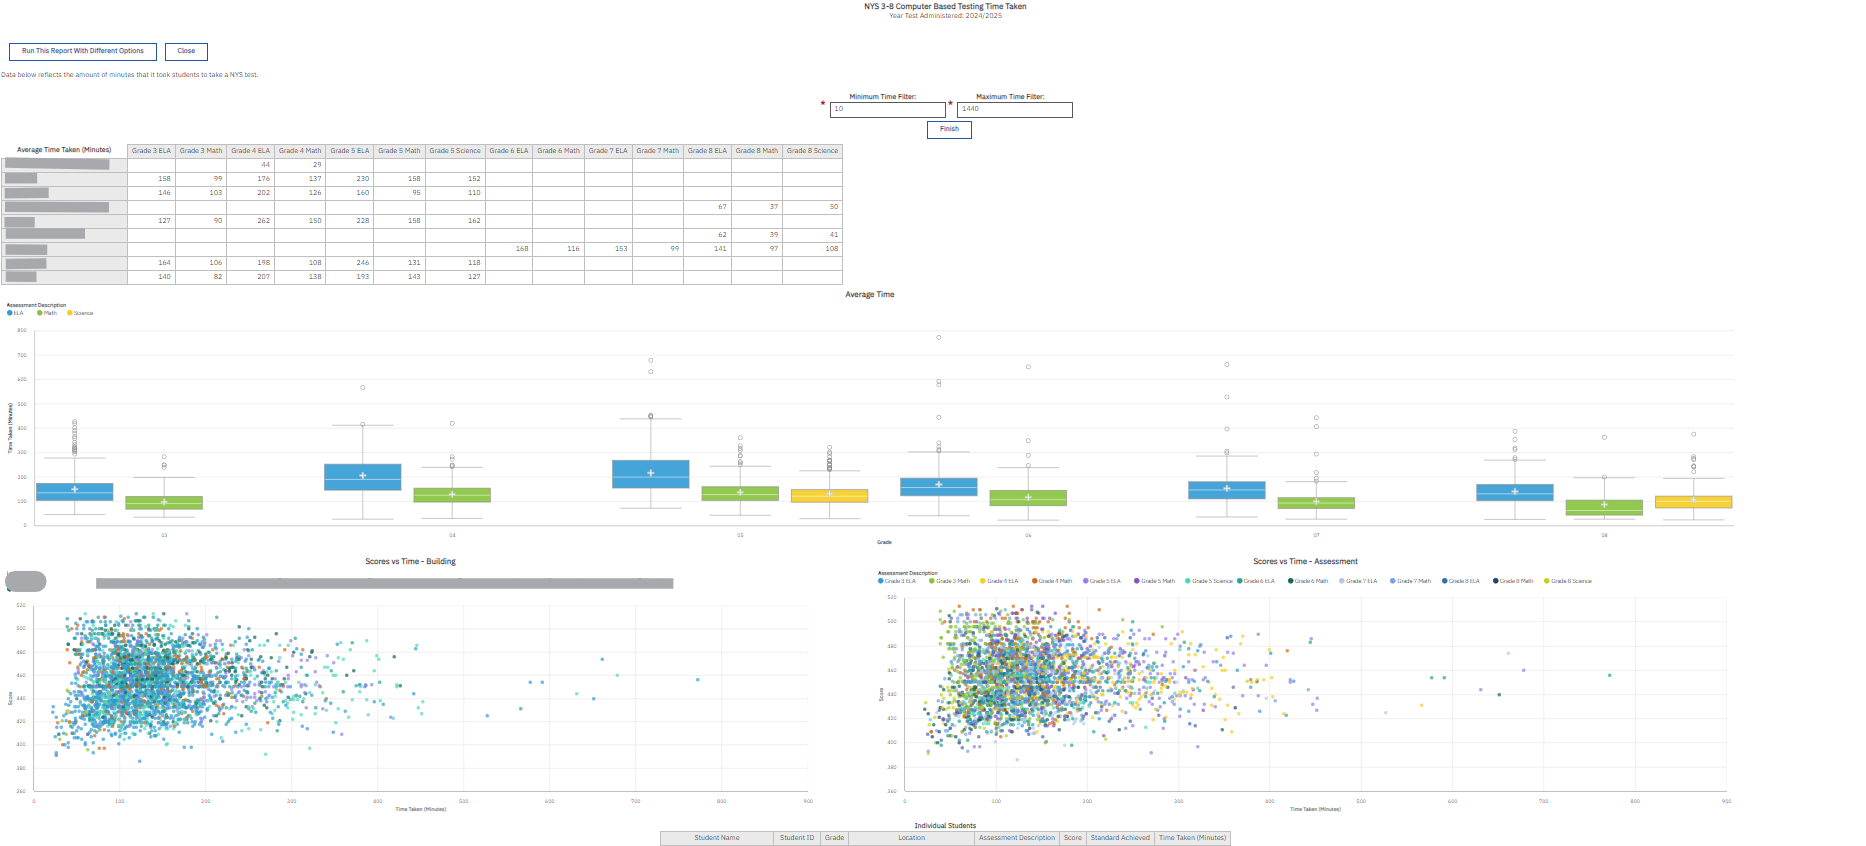
NYS 3-8 Computer Based Testing Time Taken
|
This report provides summary statistics for time taken on NYS assessments (grades 3 through 8). The report comprises students who took a NYS test, and the scores they received. This report reflects students identified in Assessment Fact as having taken a computer based NYS examination.
|
|
|
|
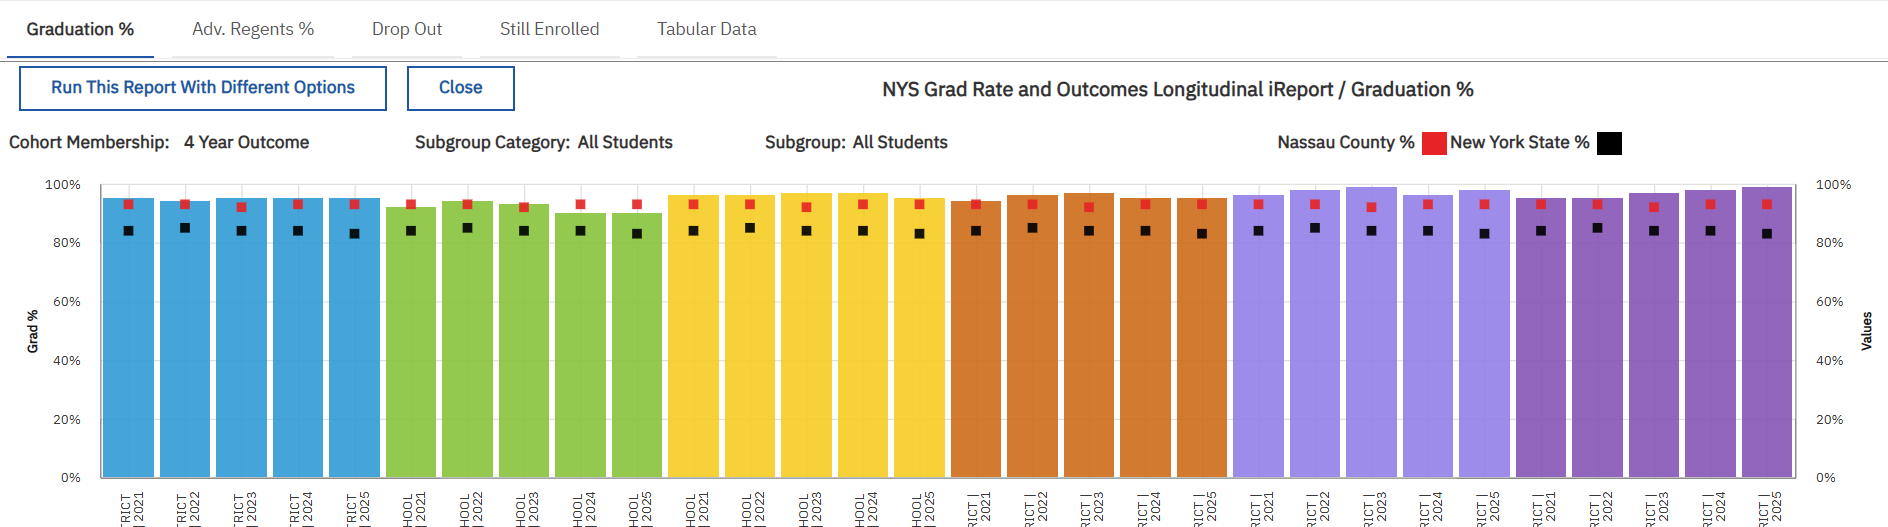
NYS Grad Rate and Outcomes Longitudinal iReport
|
Longitudinal comparison of graduation rate data across multiple school districts. Based on public data from NYSED Report Card.
|
|
|
|
NYSESLAT and NYSITELL Dashboard
|
Various charts with performance level and level change in NYSESLAT and NYSITELL. Includes demographic filters.
|
|
|
|
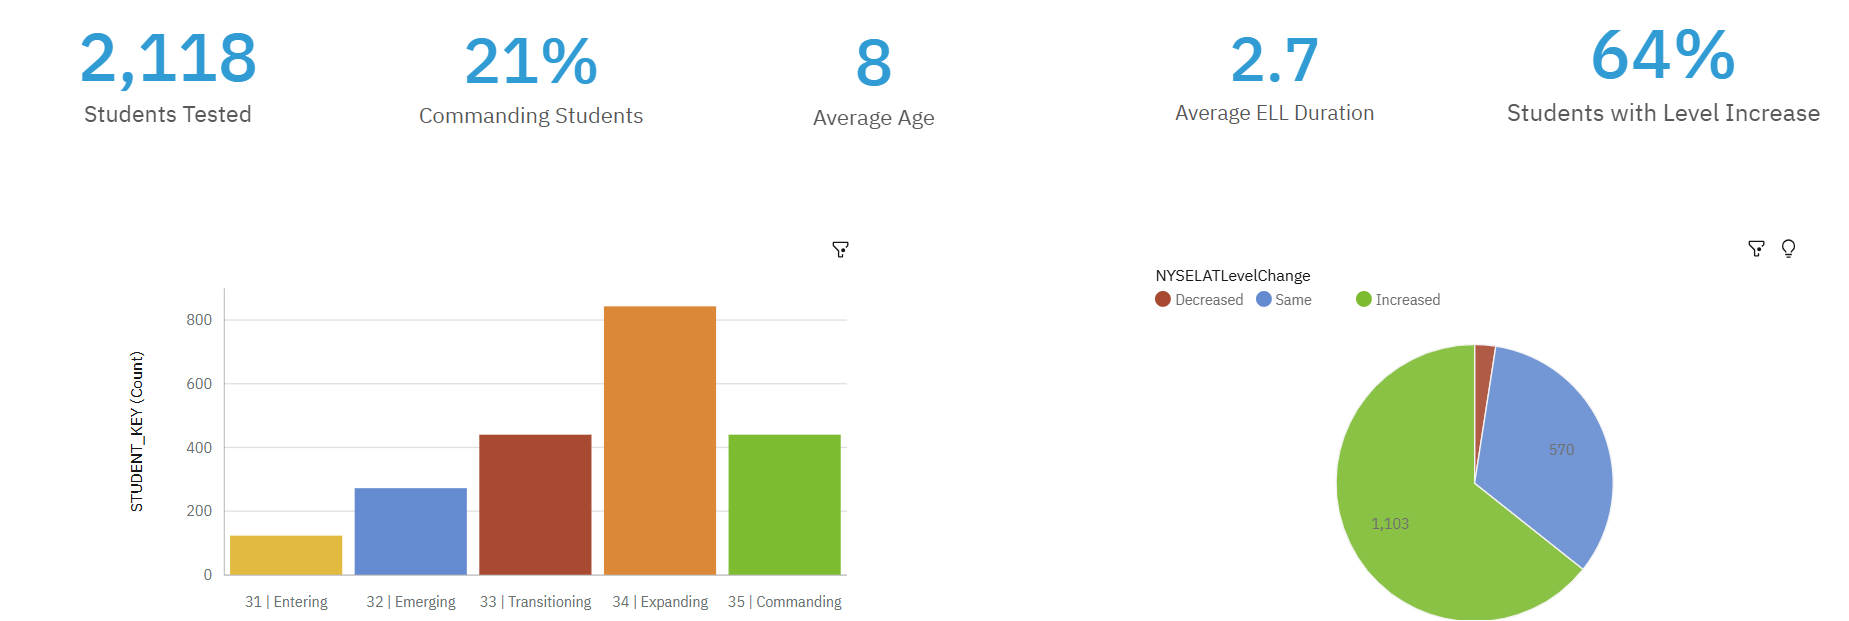
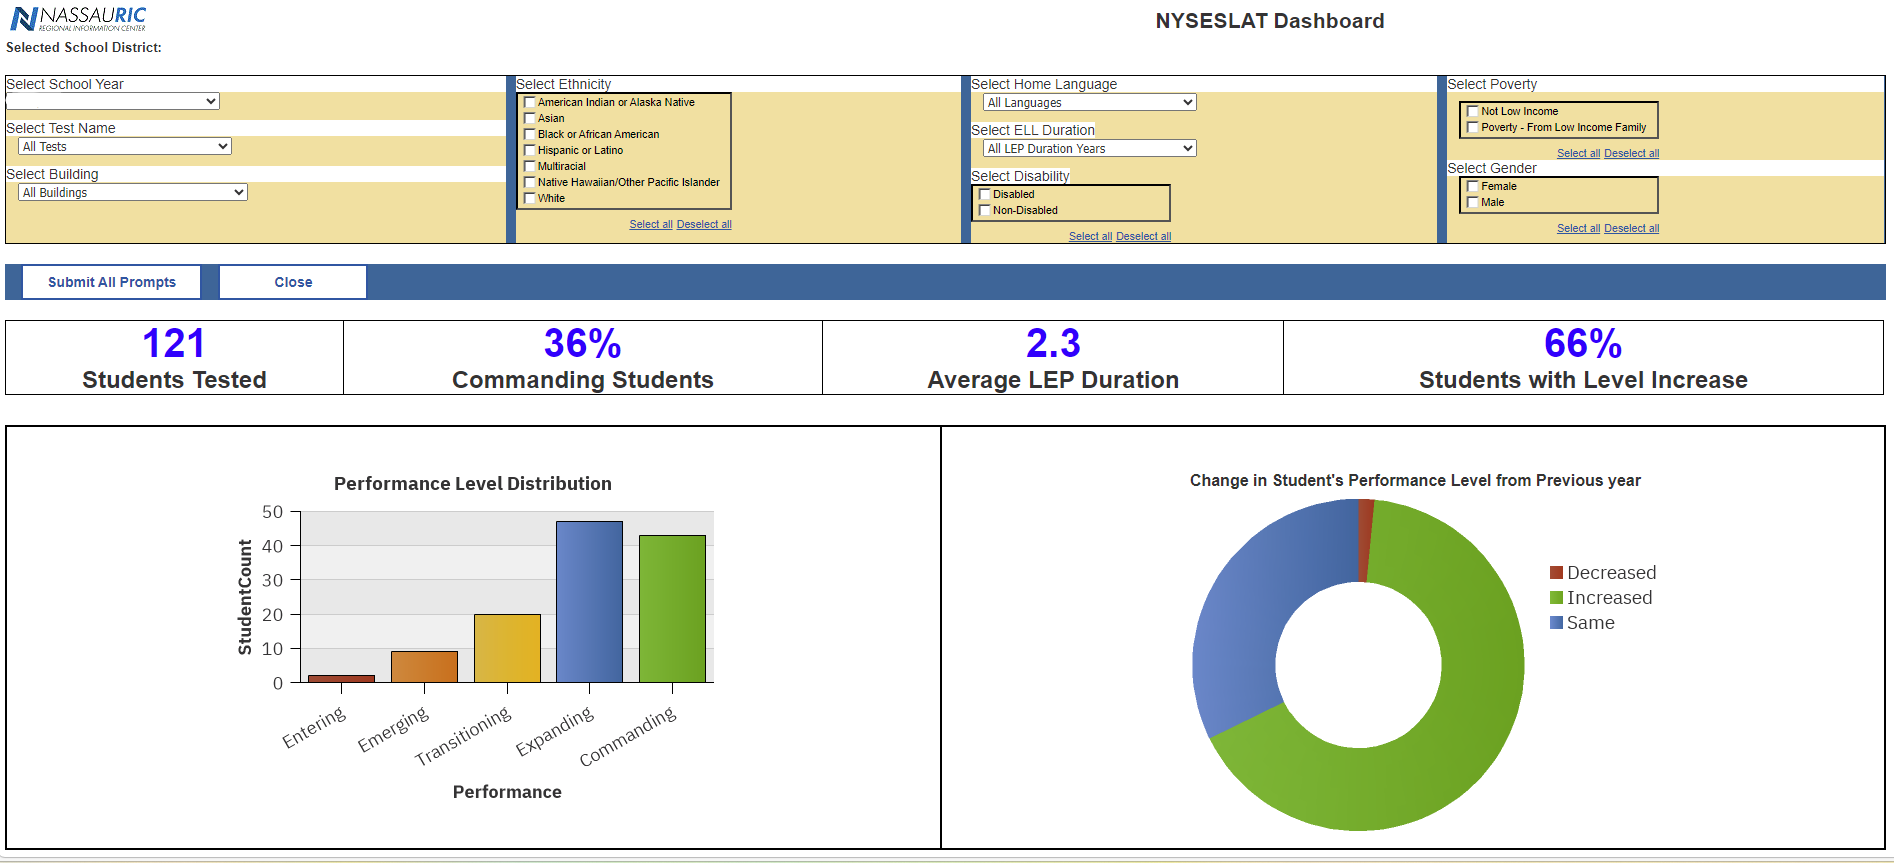
NYSESLAT Dashboard
|
NYSESLAT proficiency statistics are displayed in a bar chart and donut chart. Levels of performance by number of students in the bar chart and the increase or decrease in performance level change in the donut chart.
|
|
|
|
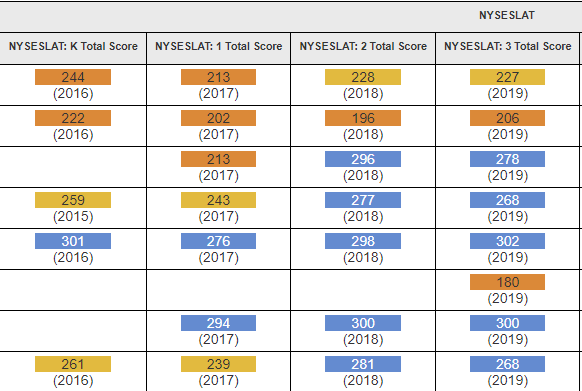
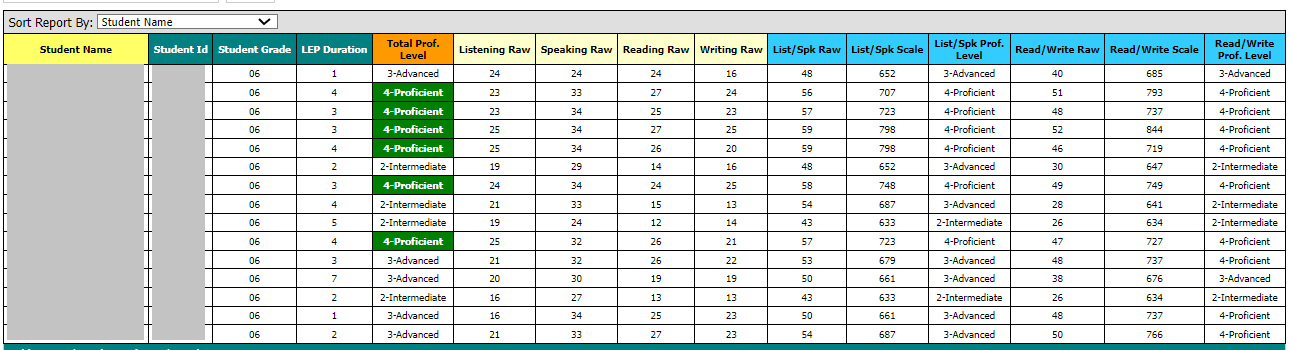
NYSESLAT Multi-Year Student Longitudinal
|
This report displays a history of NYSESLAT assessments for all students. Scores are available starting in the 2013 school year.
|
|
|
|
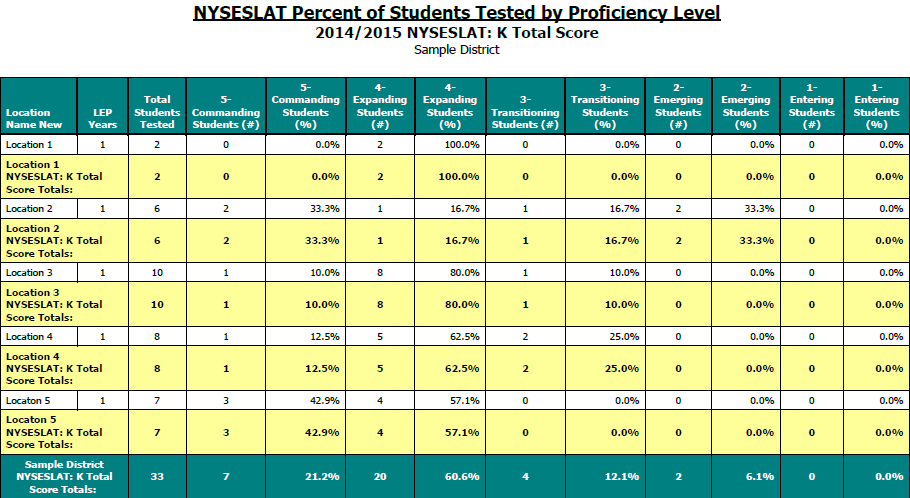
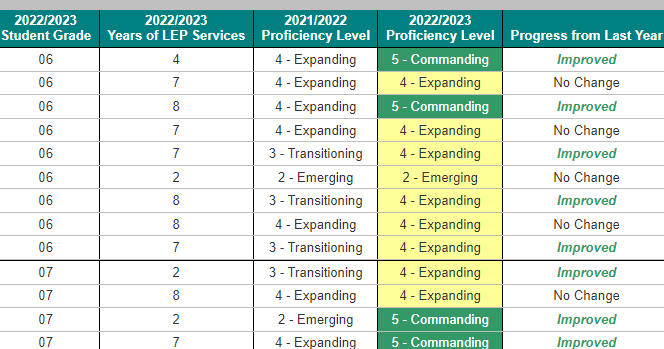
NYSESLAT Percent of Students Tested by Proficiency Level
|
Displays the number and percentage of NYSESLAT students in each proficiency level, grouped by the number of LEP Years within Building, for the selected year.
|
|
|
|
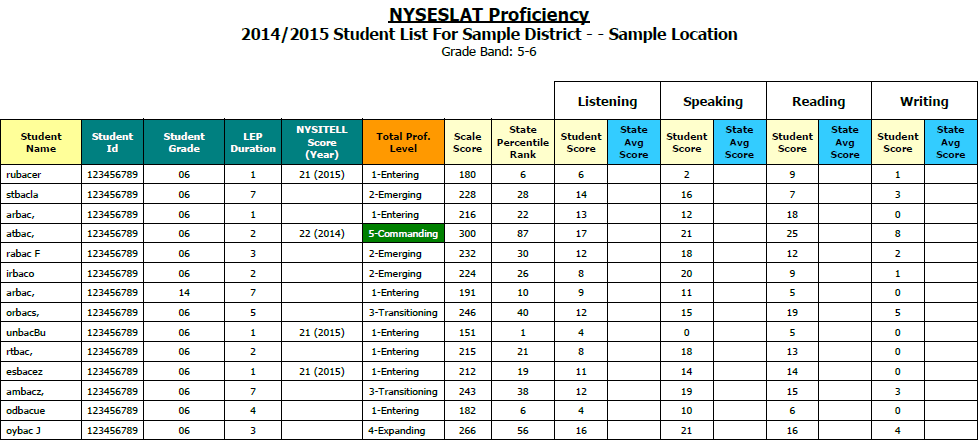
NYSESLAT Proficiency
|
The NYSESLAT Proficiency Report displays NYSESLAT scores (starting with h 2013) by student for the year selected.
|
|
|
|
NYSESLAT Proficiency for Years Prior to 2013
|
The NYSESLAT Proficiency Report displays NYSESLAT scores (for years prior to 2013) by student for the year selected
|
|
|
|
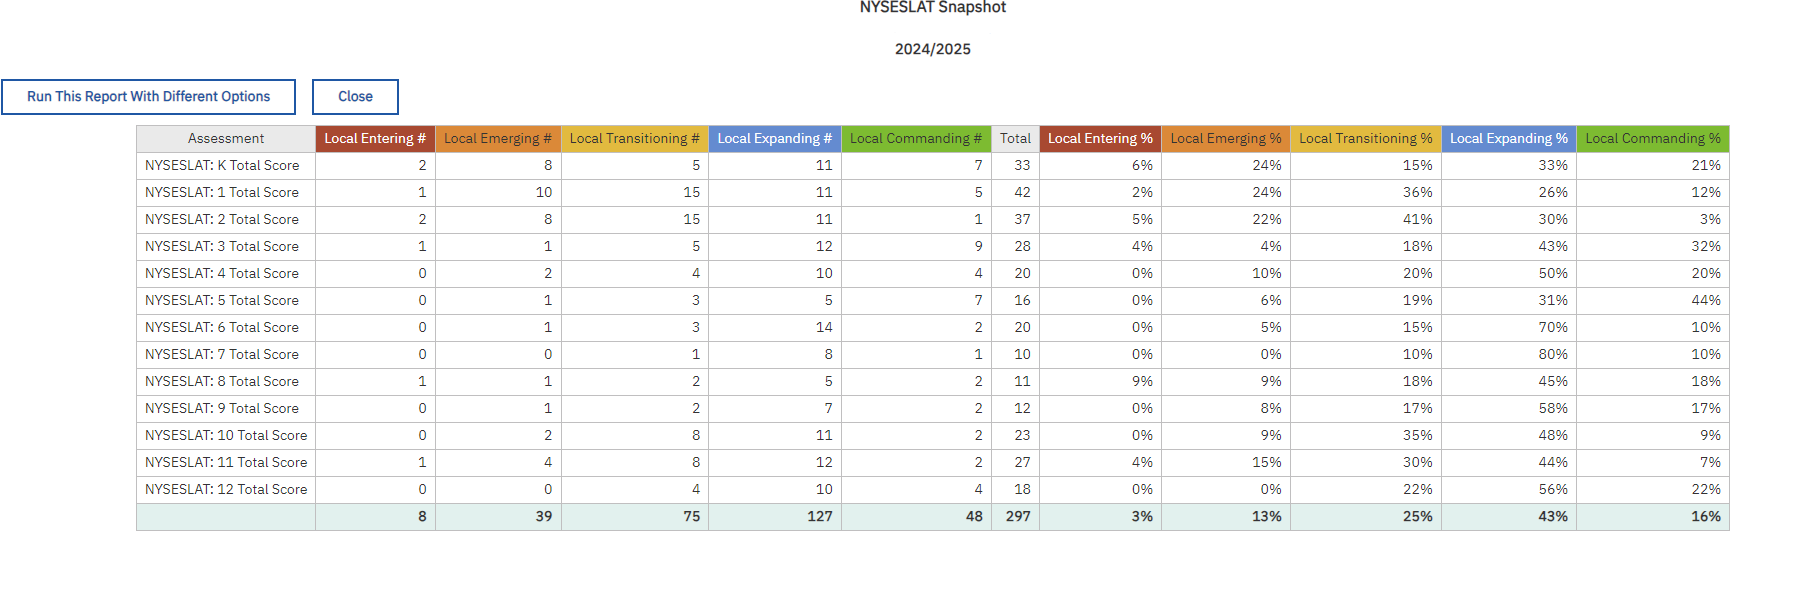
NYSESLAT Snapshot
|
This report compares aggregated NYSESLAT scores across all grades for a specific district or building. The first tab of this report shows both total numbers and percentages for the selected district or building. The second tab compares percentages for the selected district or building to the Nassau County region.
|
|
|
|
NYSESLAT Two-Year Longitudinal
|
The NYSESLAT Longitudinal Report compares NYSESLAT students scores for the year selected to the previous year
|
|
|
|
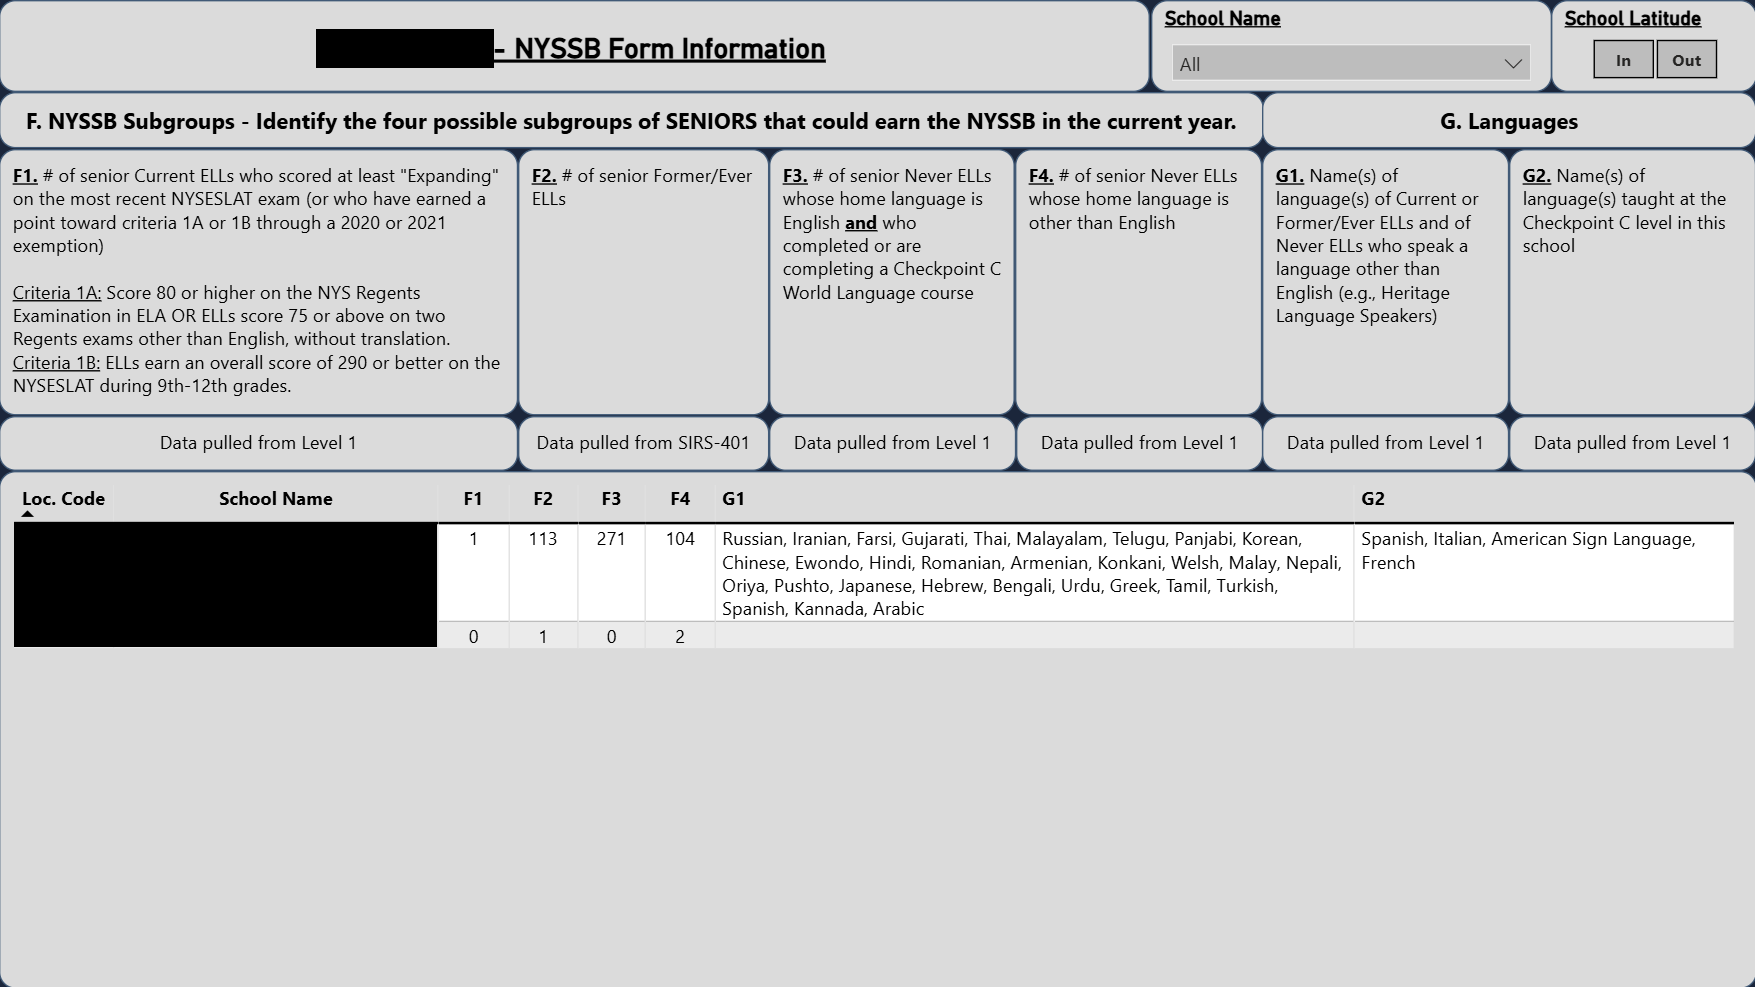
NYSSB Form Support
|
Question sets F and G pulled directly from district submitted demographic data.
|
|
|
|
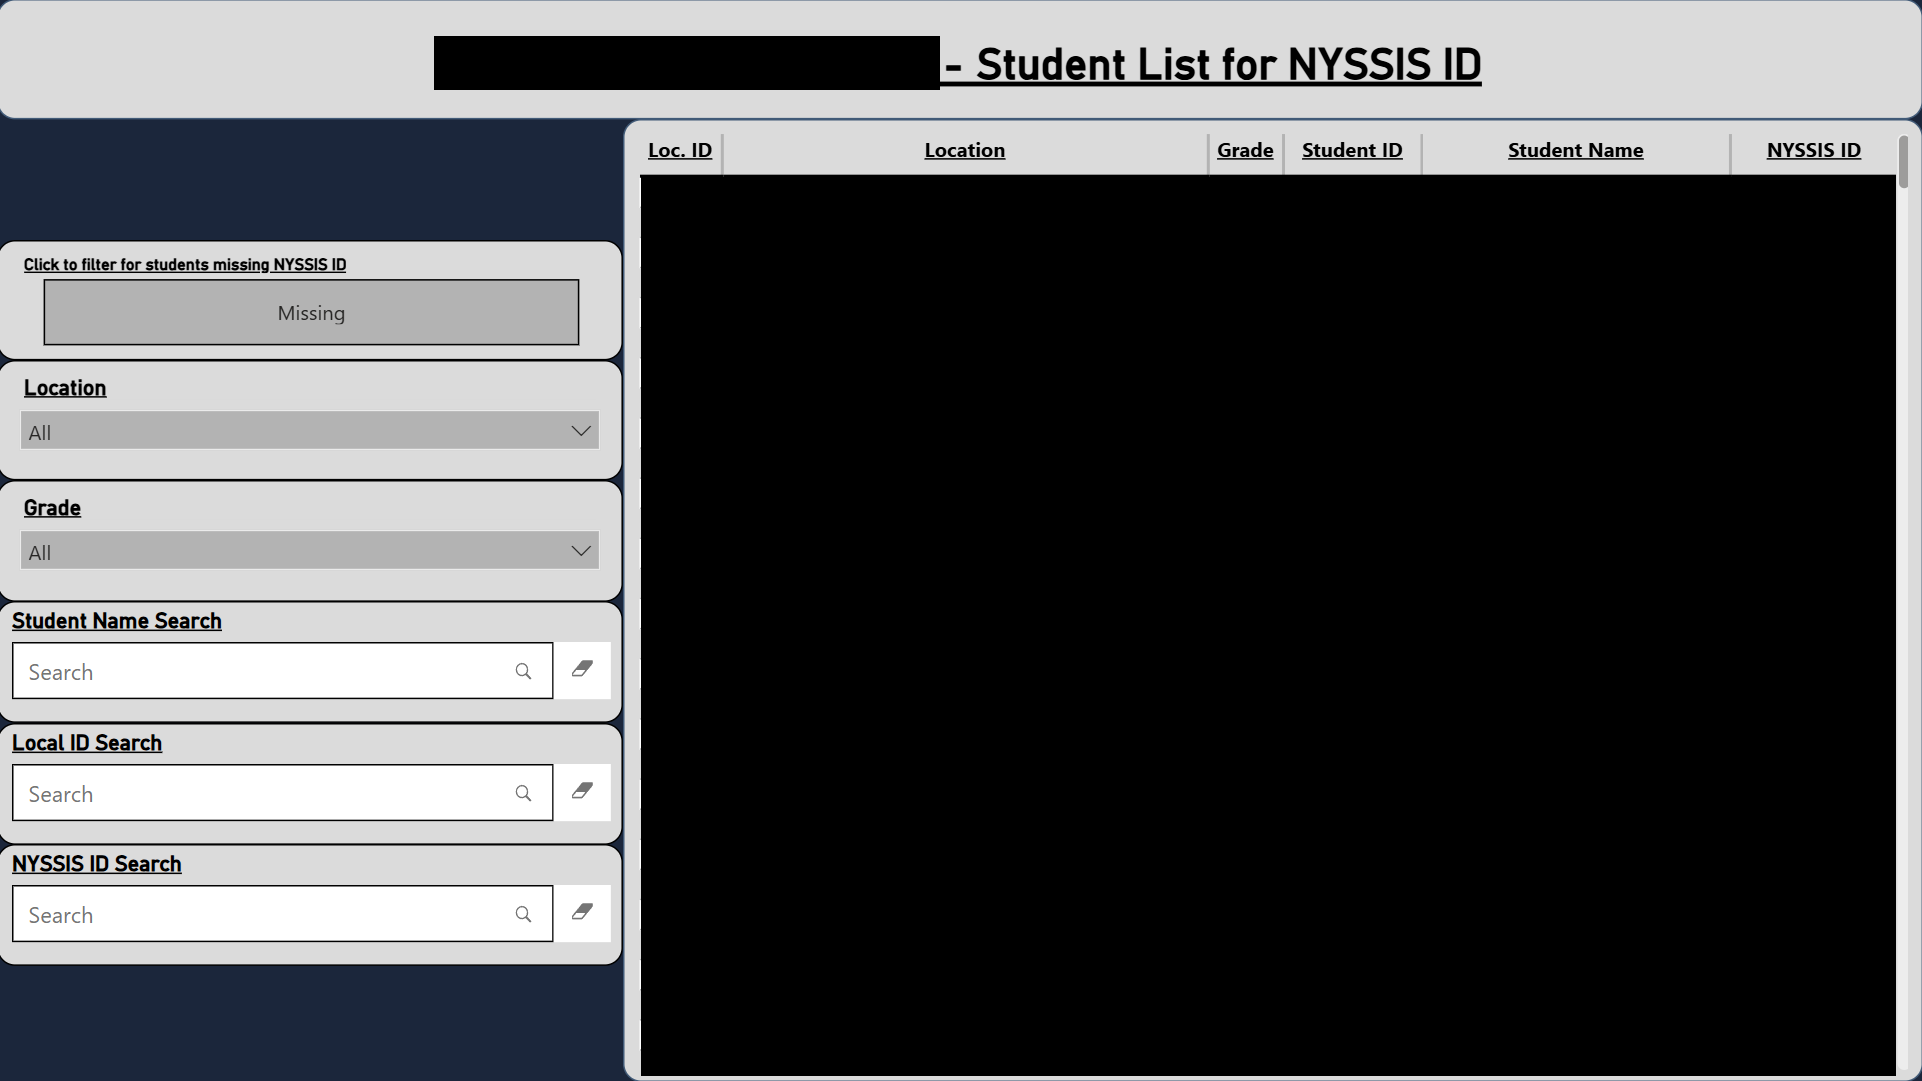
NYSSIS ID Lookup
|
Quickly check the NYSSIS ID for any reported student.
|
|
|
|
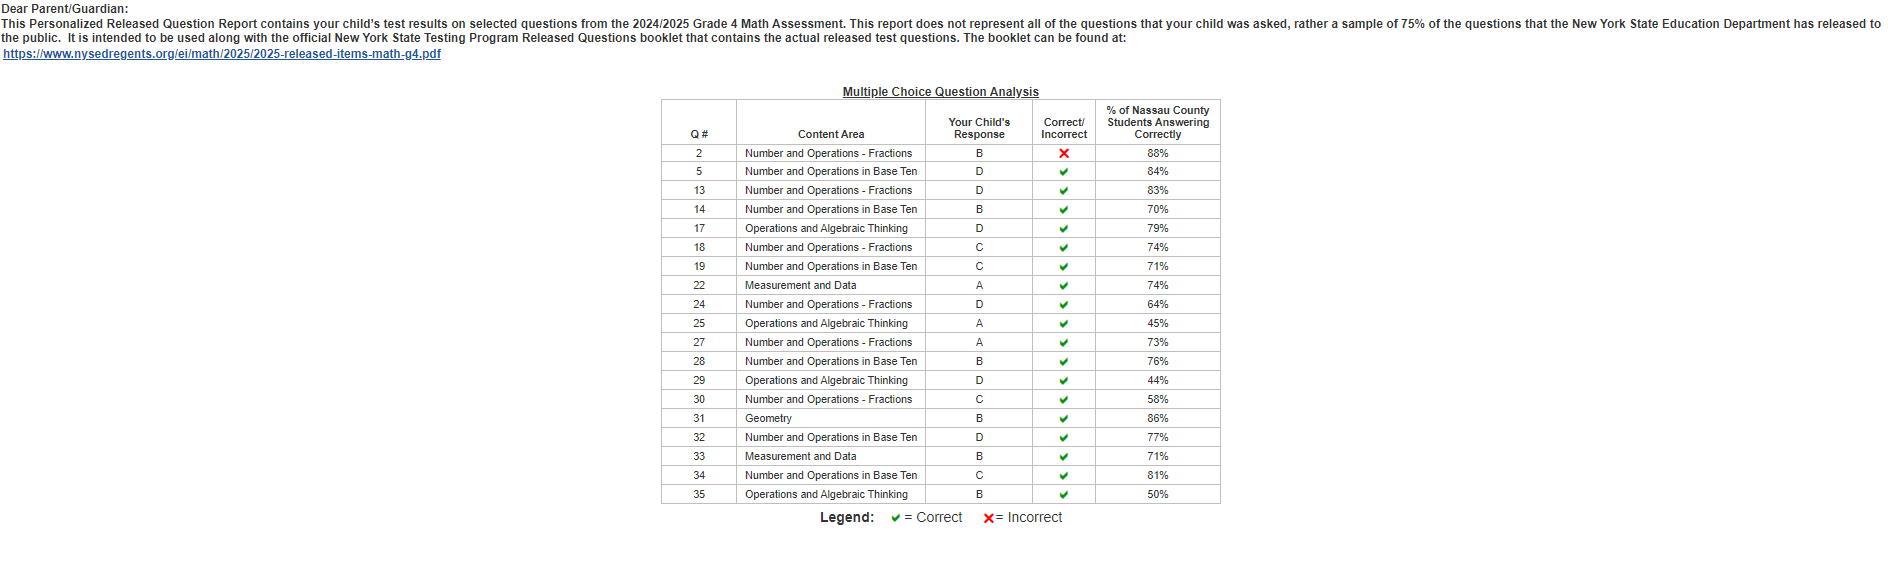
Parent Personalized Released Question
|
This report displays released question details for individual students on a particular assessment and is intended to be shared with parents.
|
|
|
|
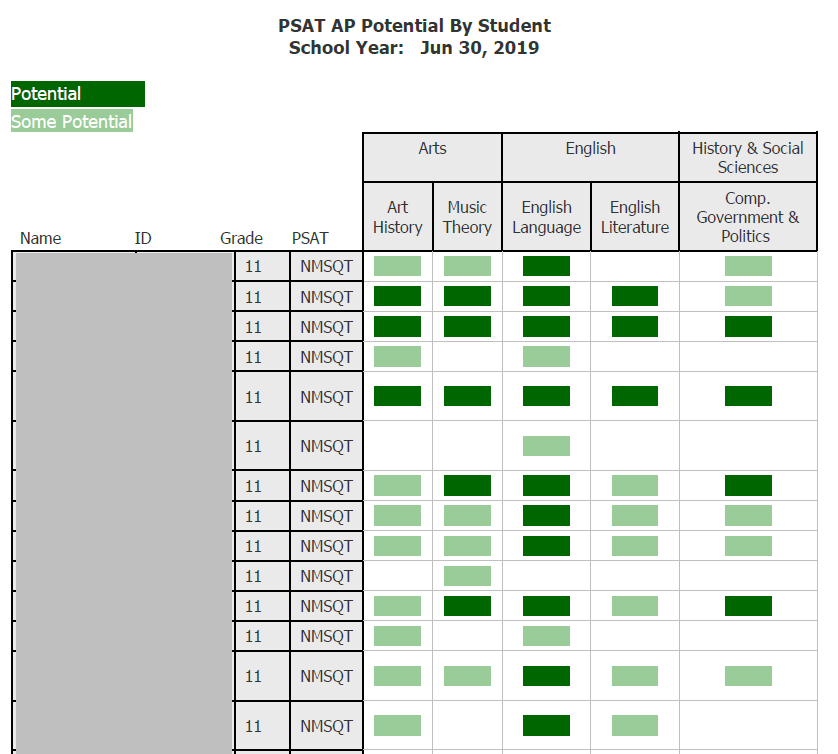
PSAT AP Potential By Student
|
Displays students likely to score a 3 or higher on specific AP exams. Based on data from the PSAT.
|
|
|
|
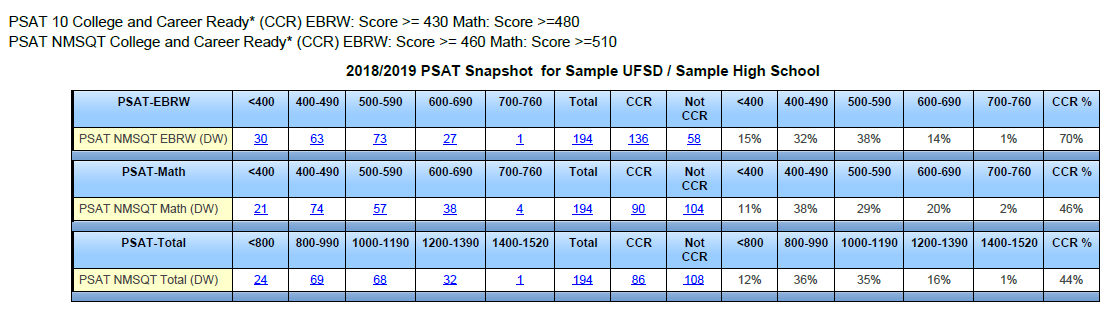
PSAT Snapshot
|
Displays aggregate PSAT ranges and CCR benchmarks for a single year. Drills down to individual students.
|
|
|
|
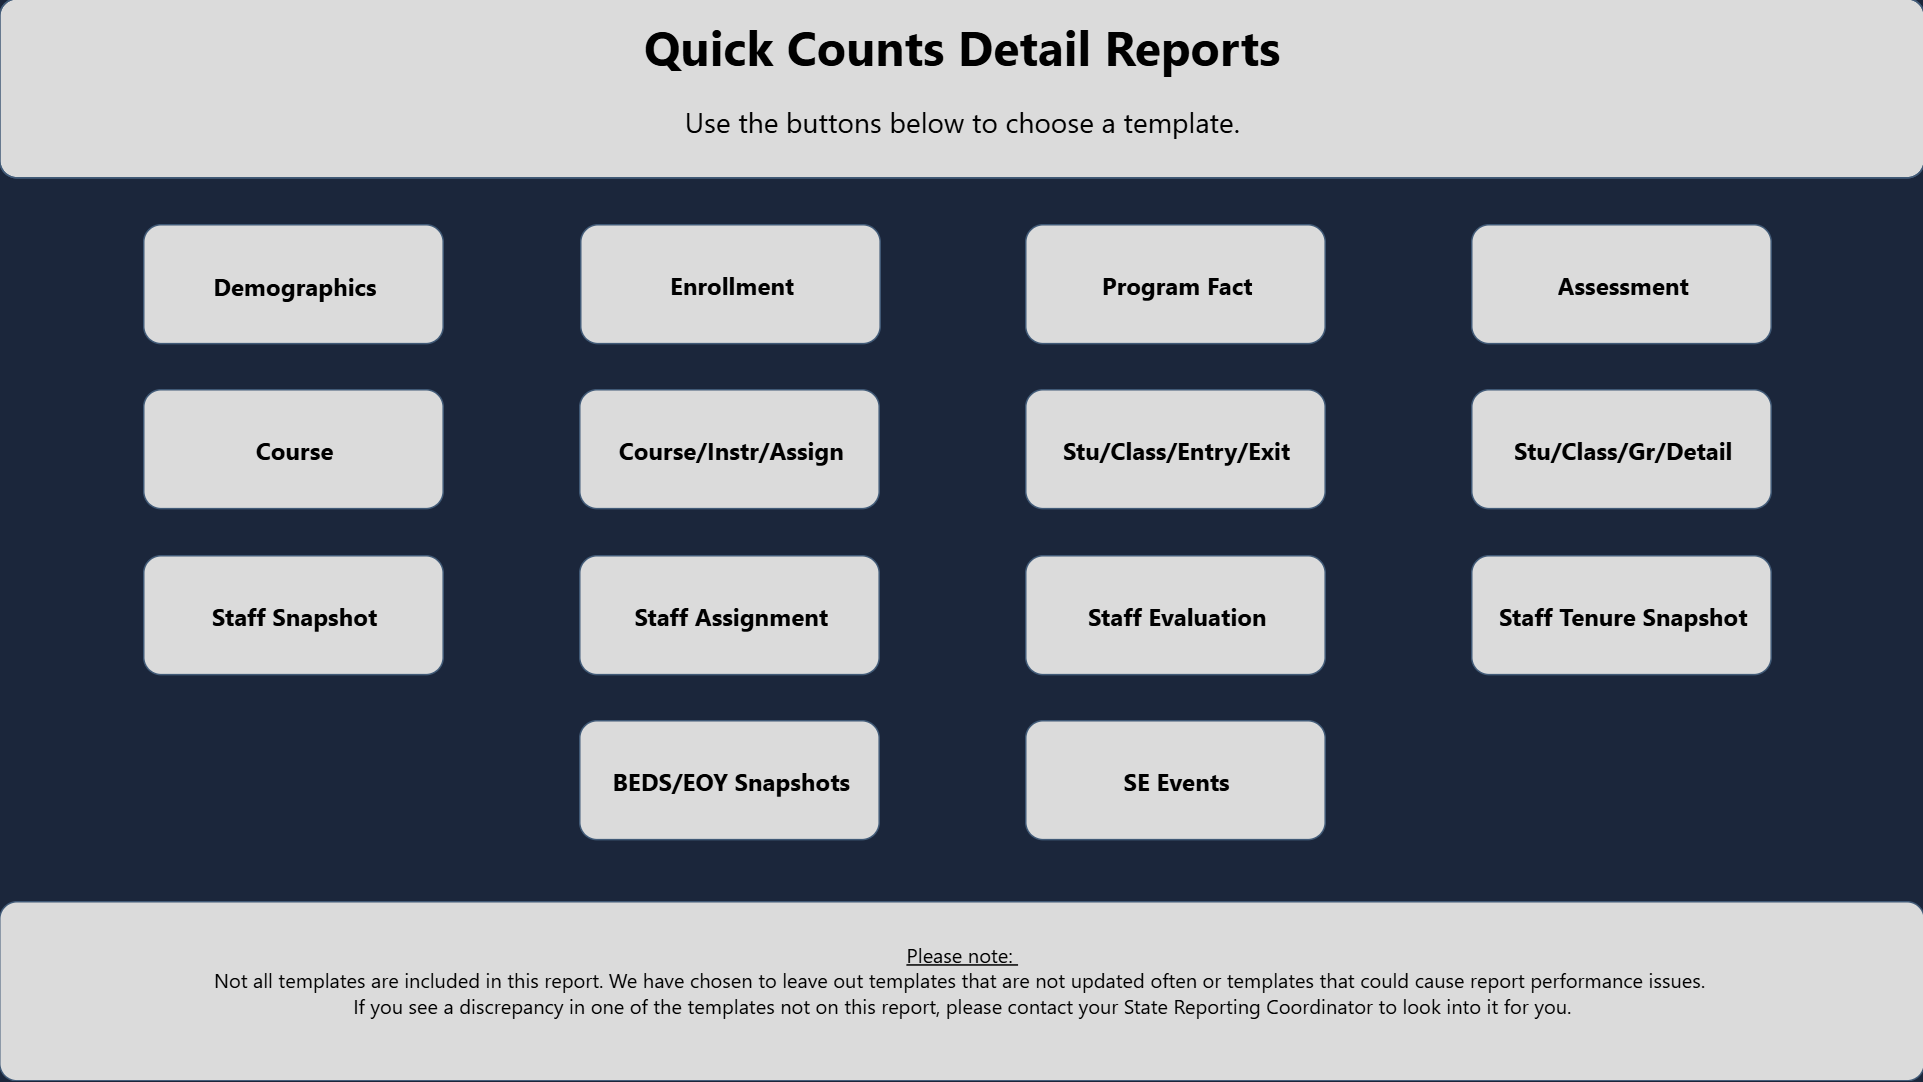
Quick Counts Detail Report
|
Identify discrepancies in the number of records found in the Quick Counts Summary report.
|
|
|
|
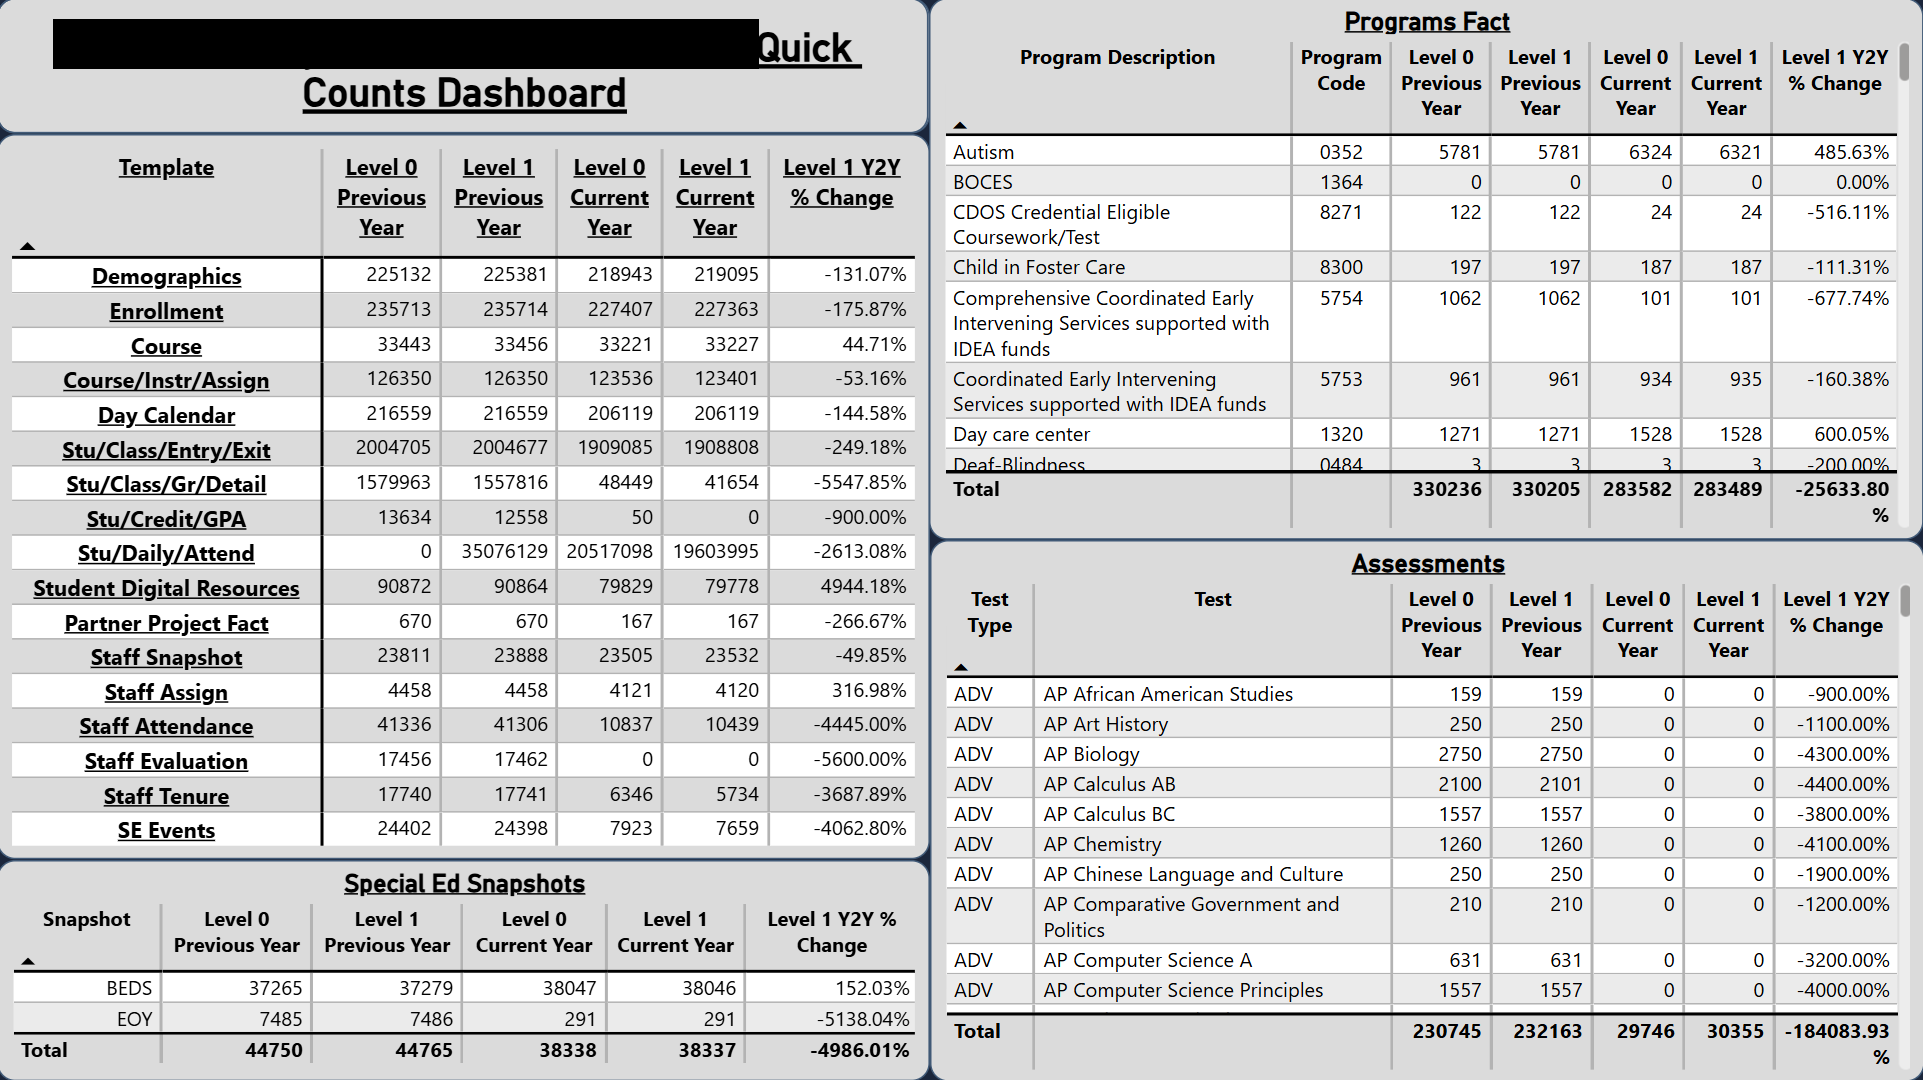
Quick Counts Summary Report
|
View the number of records submitted for each template across two school years and levels.
|
|
|
|
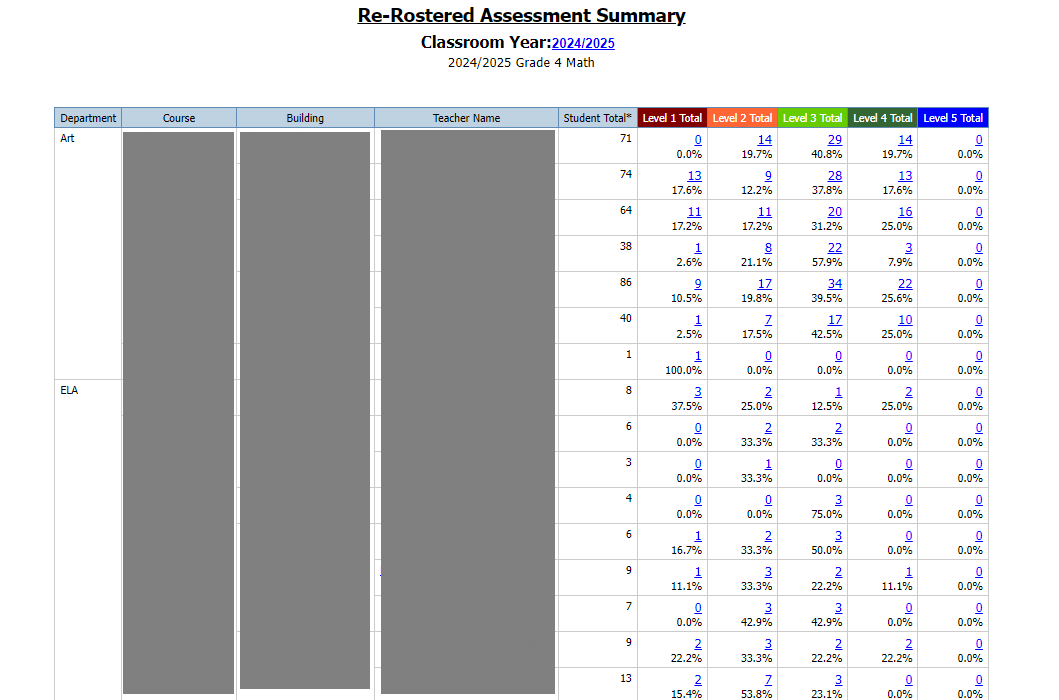
Re-Rostered Assessment Summary
|
Displays list of teachers and performance levels of their current students on a previously taken assessment. Contains links to other "re-rostered" reports.
|
|
|
|
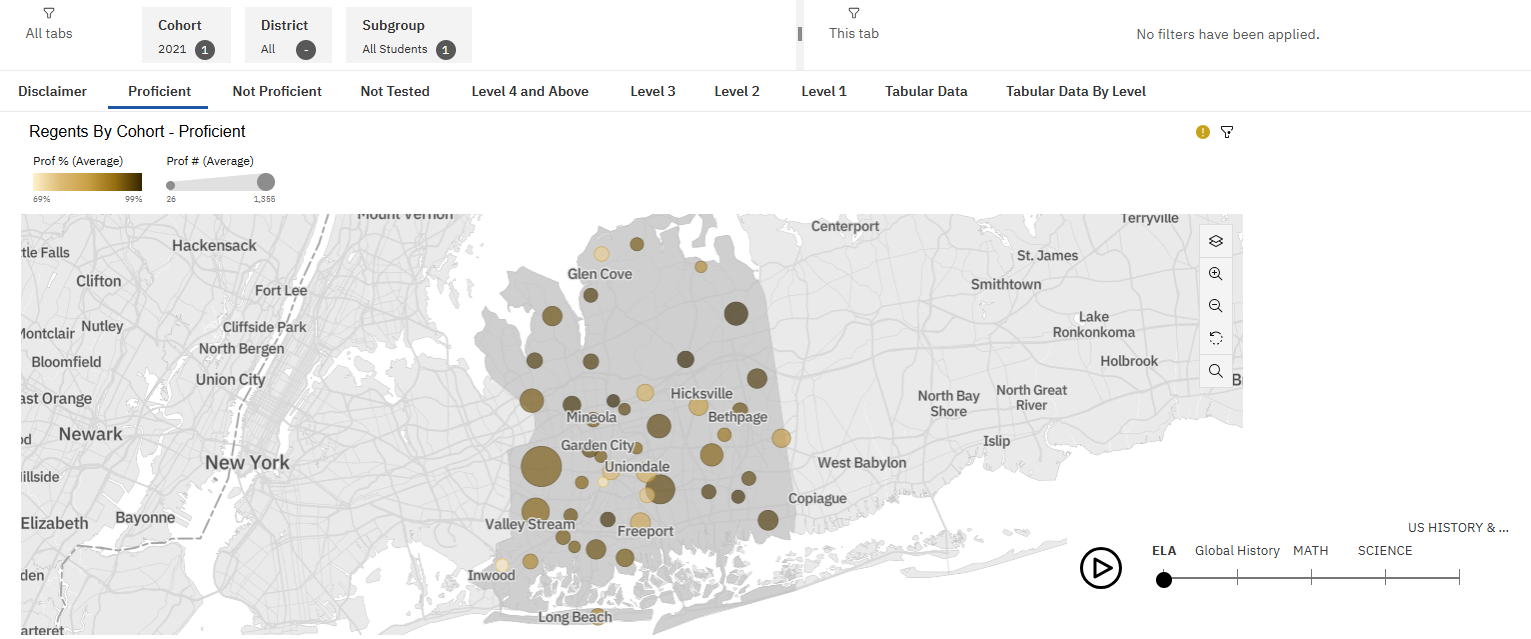
Regents Cohort Dashboard
|
Multi-tabbed dashboard with maps and tables that Regents assessment results for all Nassau County school districts. Based on public data frm the NYSED Report Card.
|
|
|
|
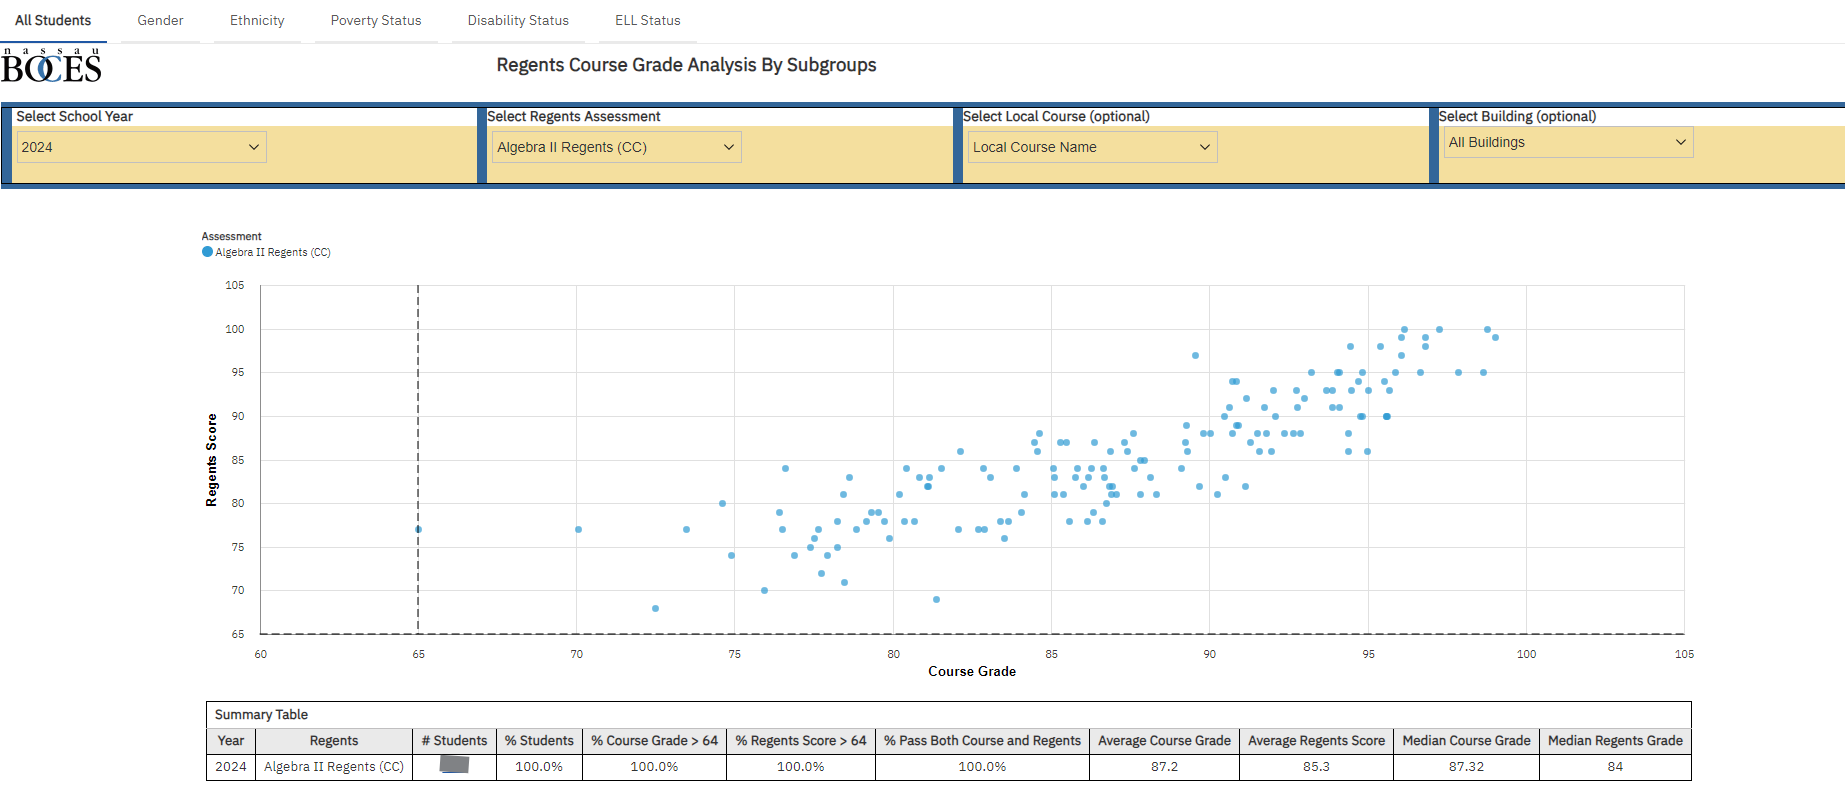
Regents Course Grade Analysis By Subgroups
|
This report compares students final course grades with their June Regents assessment scores. Only 'first-time' Regents test-takers are included in this report.
|
|
|
|
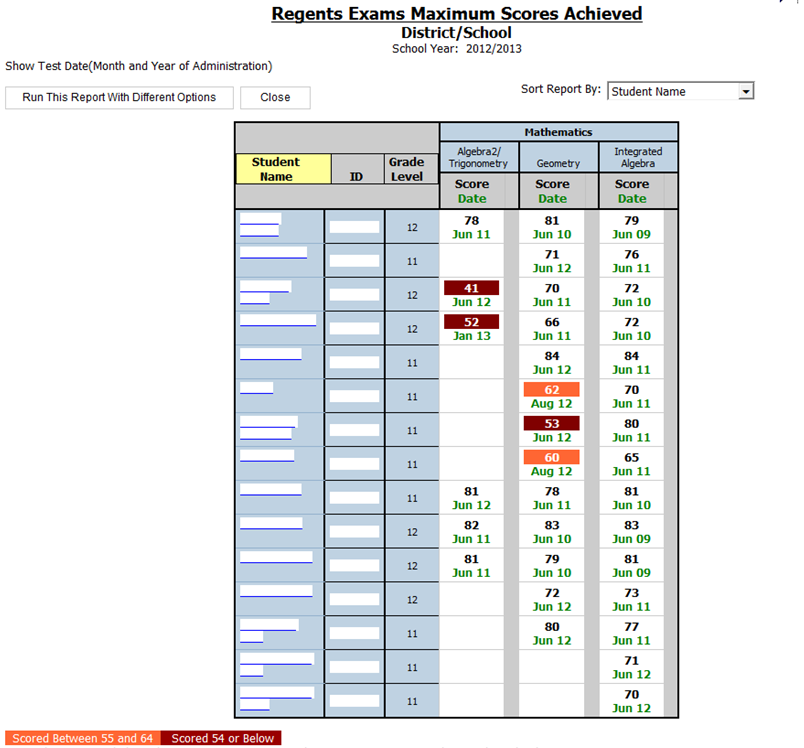
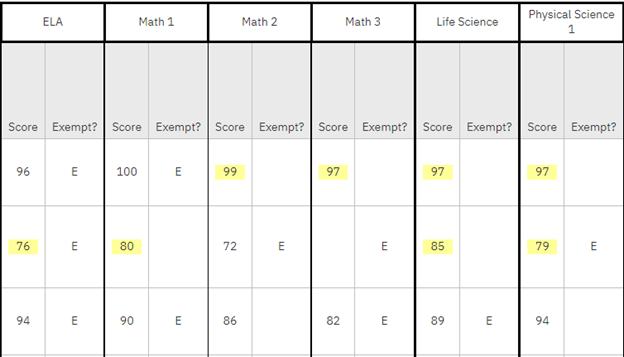
Regents Exams Maximum Scores Achieved
|
Displays each student's highest score for each Regents Exam taken in the district.
|
|
|
|
Regents Exams Maximum Scores Achieved Download
|
This Excel 2007 download displays the highest Regents score for all students from the selected enrollment school year.
|
|
|
|
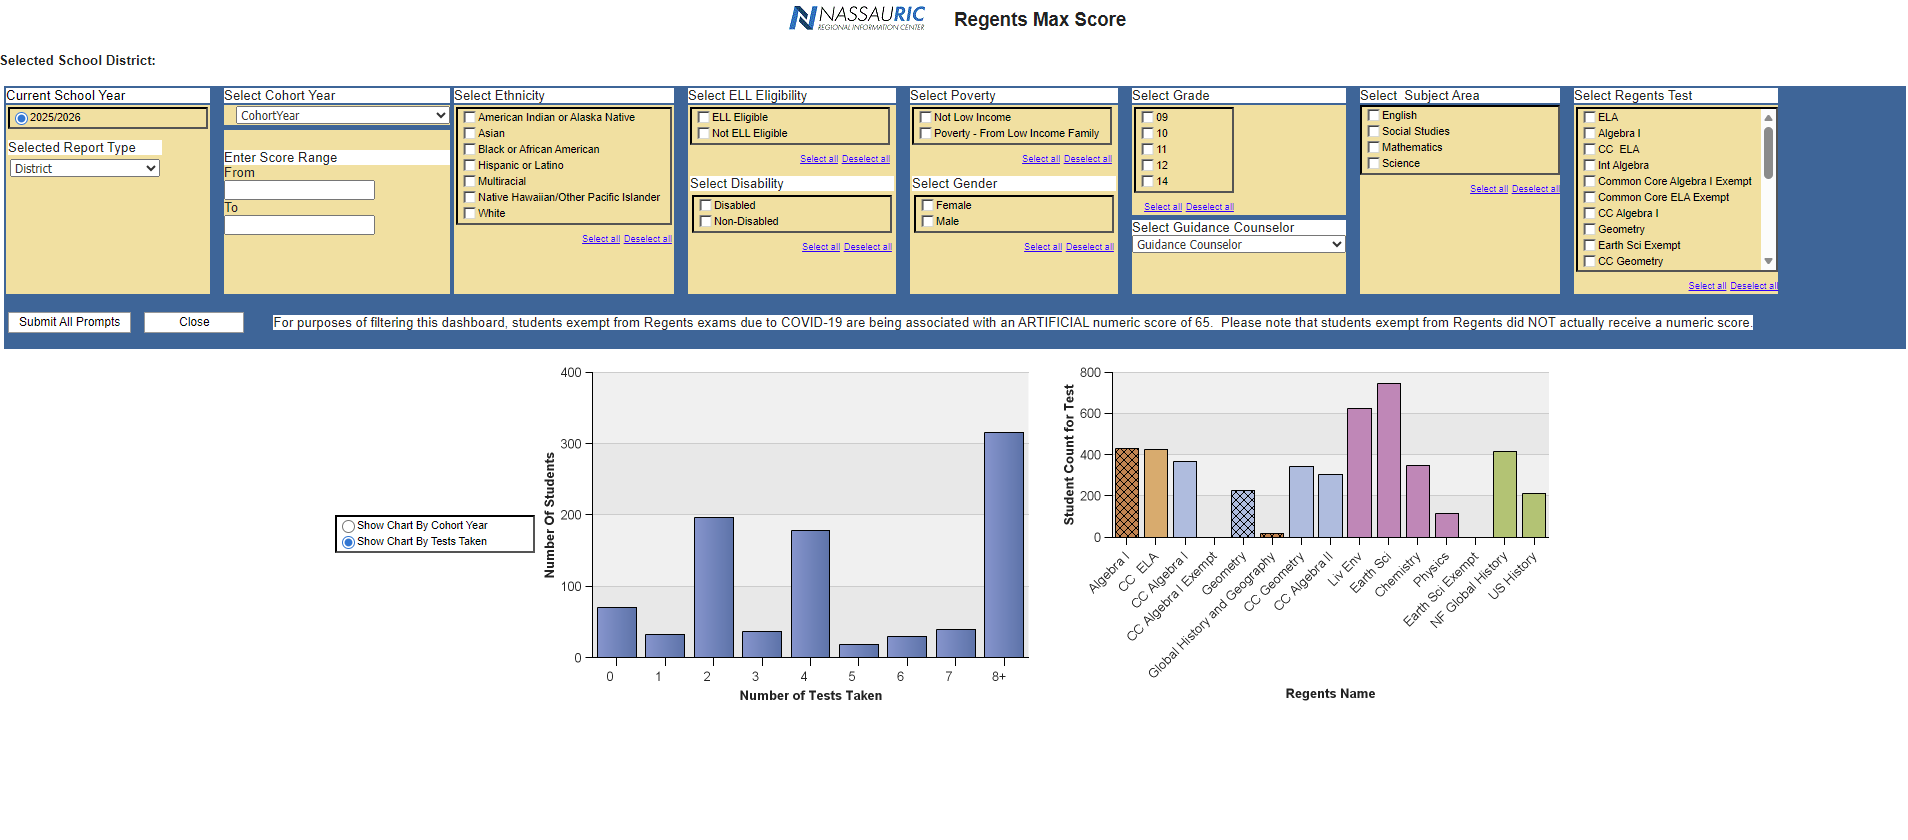
Regents Exams Maximum Scores Dashboard
|
This dashboard breaks down the number of regents tests taken and types of regents test taken for each student within bar charts.
|
|
|
|
Regents Honors Endorsement Analysis
|
This Regents Honors Endorsement Analysis Report looks at a student’s potential eligibility of earning an Advanced Regents Diploma or Regents Diploma with an honors credential.
|
|
|
|
Regents Honors Endorsement Analysis Download
|
This excel download looks at a student’s potential eligibility of earning an Advanced Regents Diploma or Regents Diploma with an honors credential.
|
|
|
|
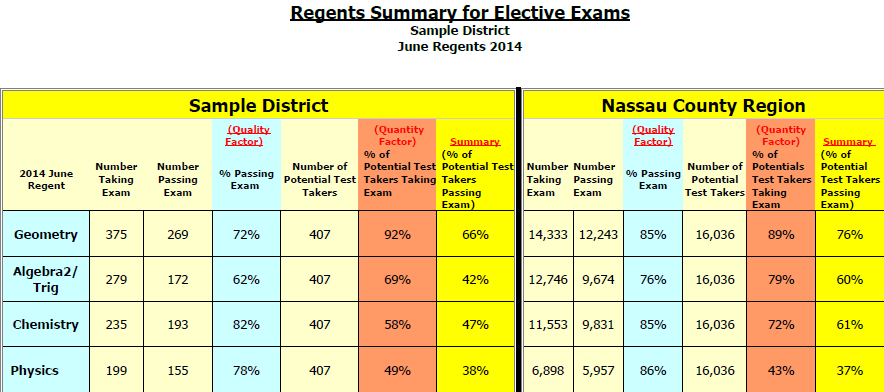
Regents Summary for Elective Exams
|
Displays the number of students taking and passing the June Regents in Geometry, Algebra 2/Trigonometry, Chemistry and Physics for a selected year.
|
|
|
|
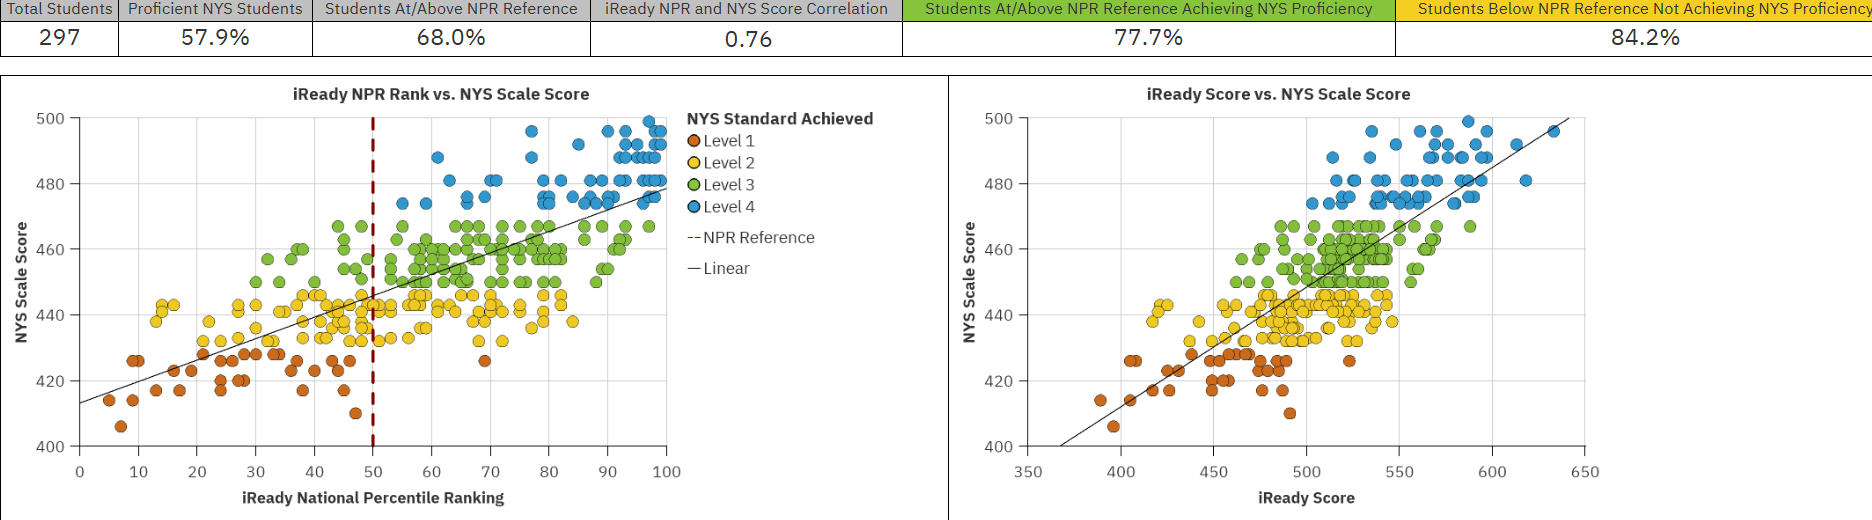
Relationship Between i-Ready NPR and NYS Scores Dashboard
|
This dashboard compares students who took both the iReady diagnostic and NYS assessment. The correlation provided uses Spearman's rho and indicates the strength of the relationship between the iReady diagnostic national percentile and NYS assessment scale scores.
|
|
|
|
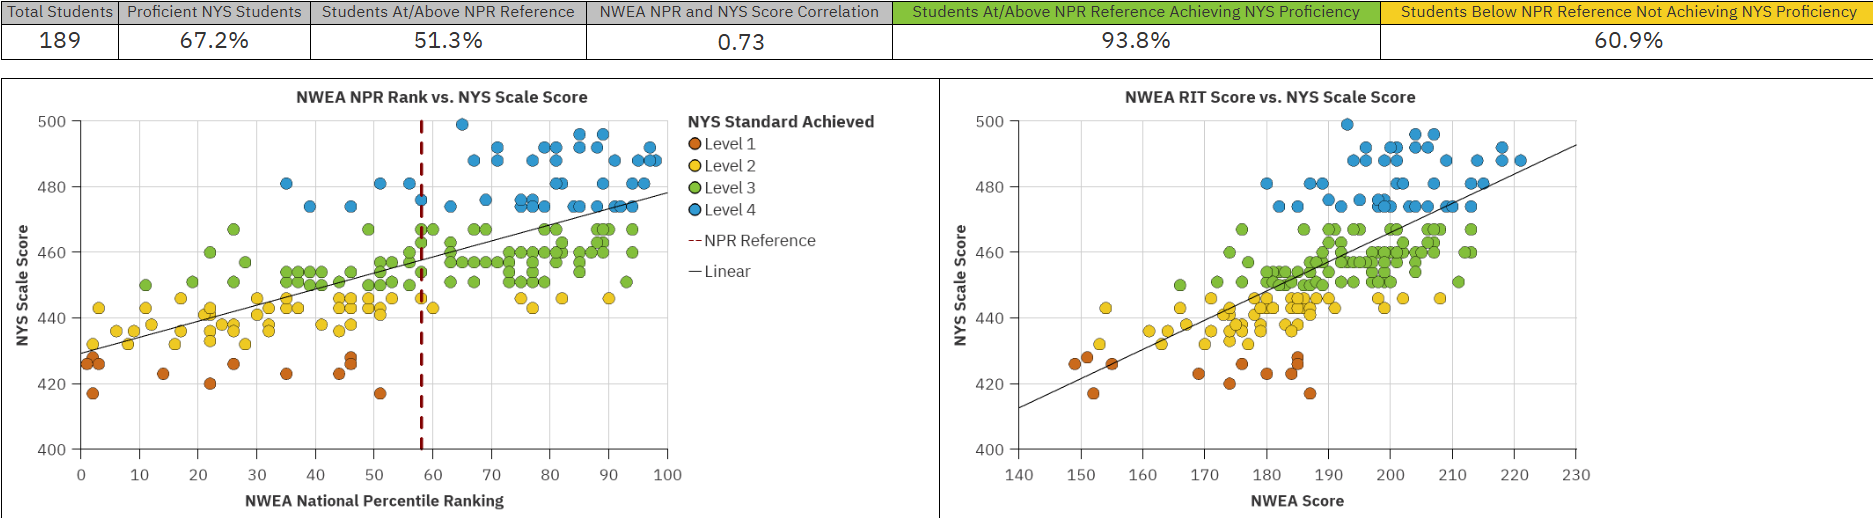
Relationship Between NWEA NPR and NYS Scores Dashboard
|
This dashboard compares students who tollk both the NWEA diagnostic and the NYS assessment. Student refusals are not included. The correlation provides used Spearman's rho and indicates the strength of the relationship between the NWA diagnostic scores and NYS assessment scale scores.
|
|
|
|
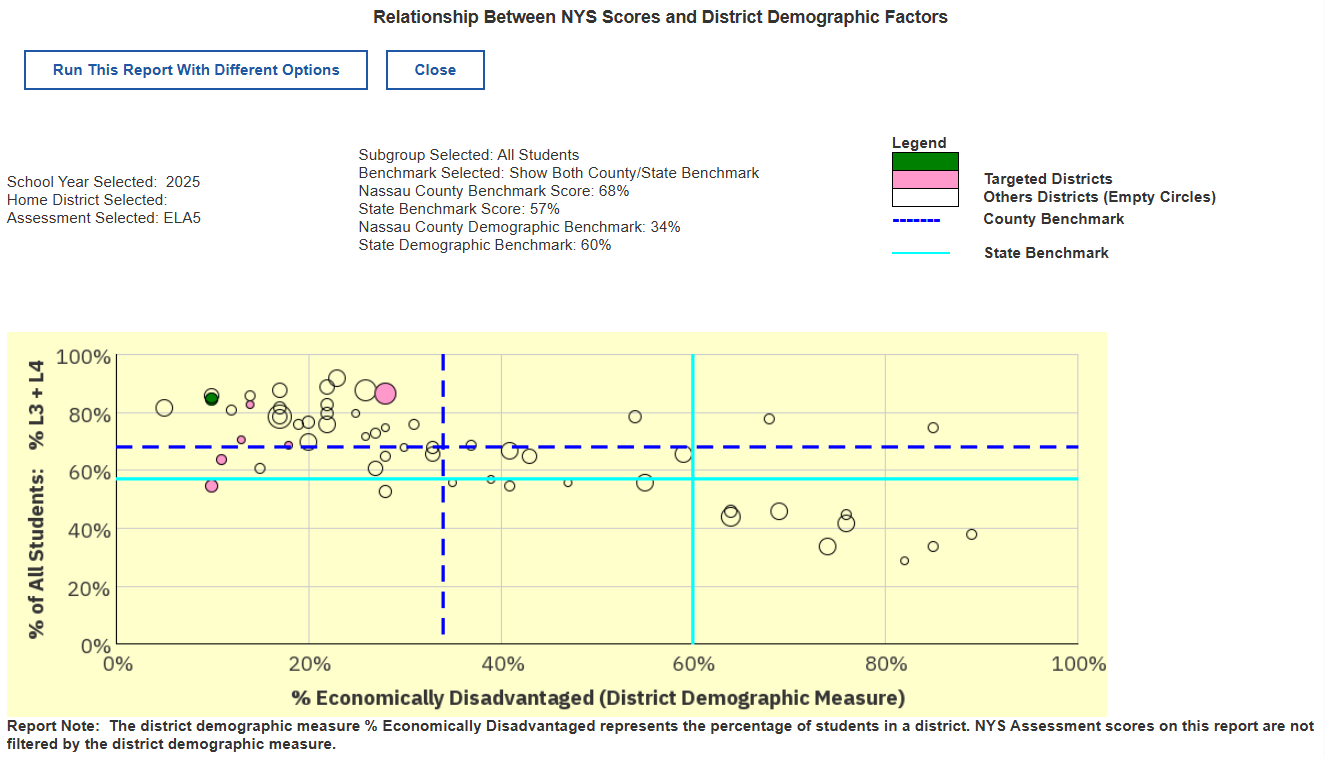
Relationship Between NYS Scores and District Demographic Factors
|
Scatterplot examining the relationship between NYS 3-8 assessment scores and district demographic makeup. Based on public data from the NYSED Report Card.
|
|
|
|
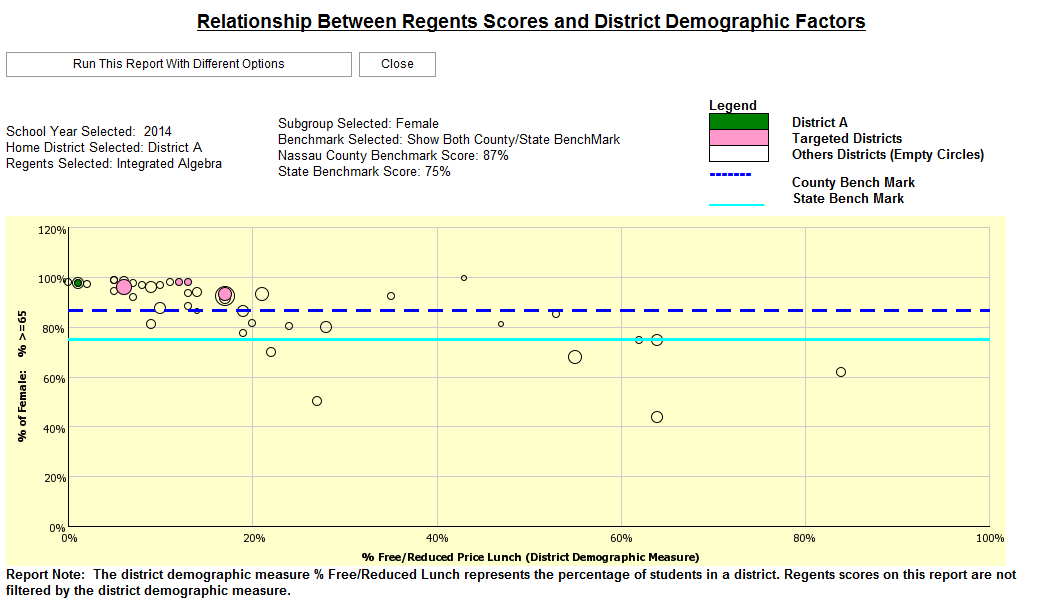
Relationship Between Regents Scores and District Demographic Factors
|
Scatterplot examining the relationship between Regents assessment scores and district demographic makeup. Based on public data from the NYSED Report Card.
|
|
|
|
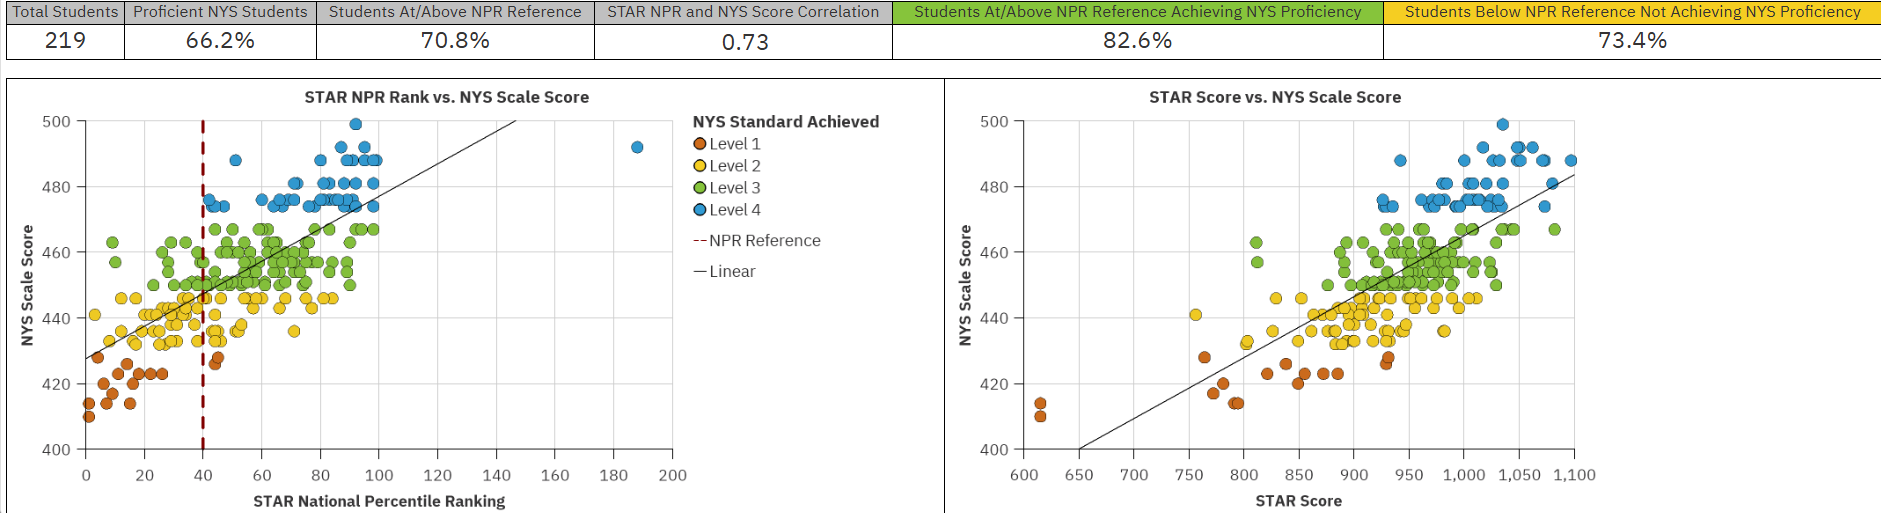
Relationship Between STAR NPR and NYS Scale Scores Dashboard
|
This dashboard comapres students who took both the STAR diagnostic and the NYS assessment. Student refusals are not included. The correlation provided uses Spearman's rho and indicates the strength of the relationship between the STAR diagnostic national percentile ranking and NYS assessment scale scores.
|
|
|
|
SAT Maximum Scores Achieved
|
This report displays the highest (maximum) SAT scores for all students enrolled in the selected school year.
|
|
|
|
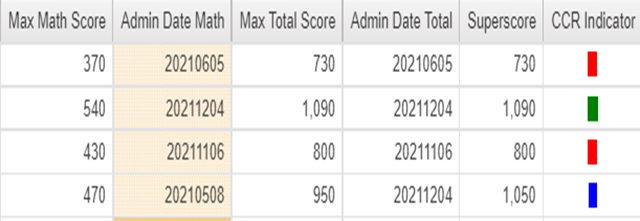
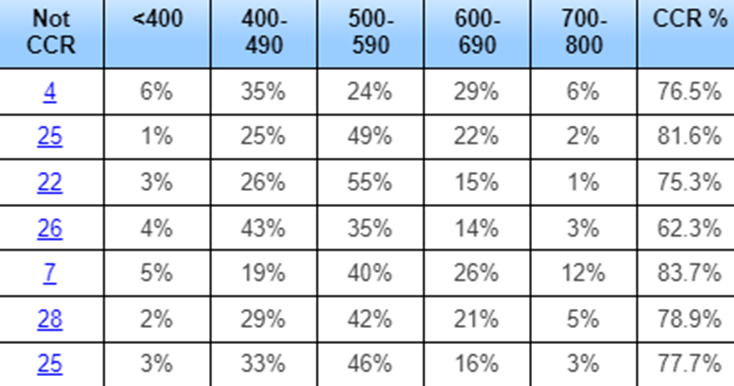
SAT Snapshot
|
This report displays a summary of SAT scores for all students enrolled in the selected school year.
|
|
|
|
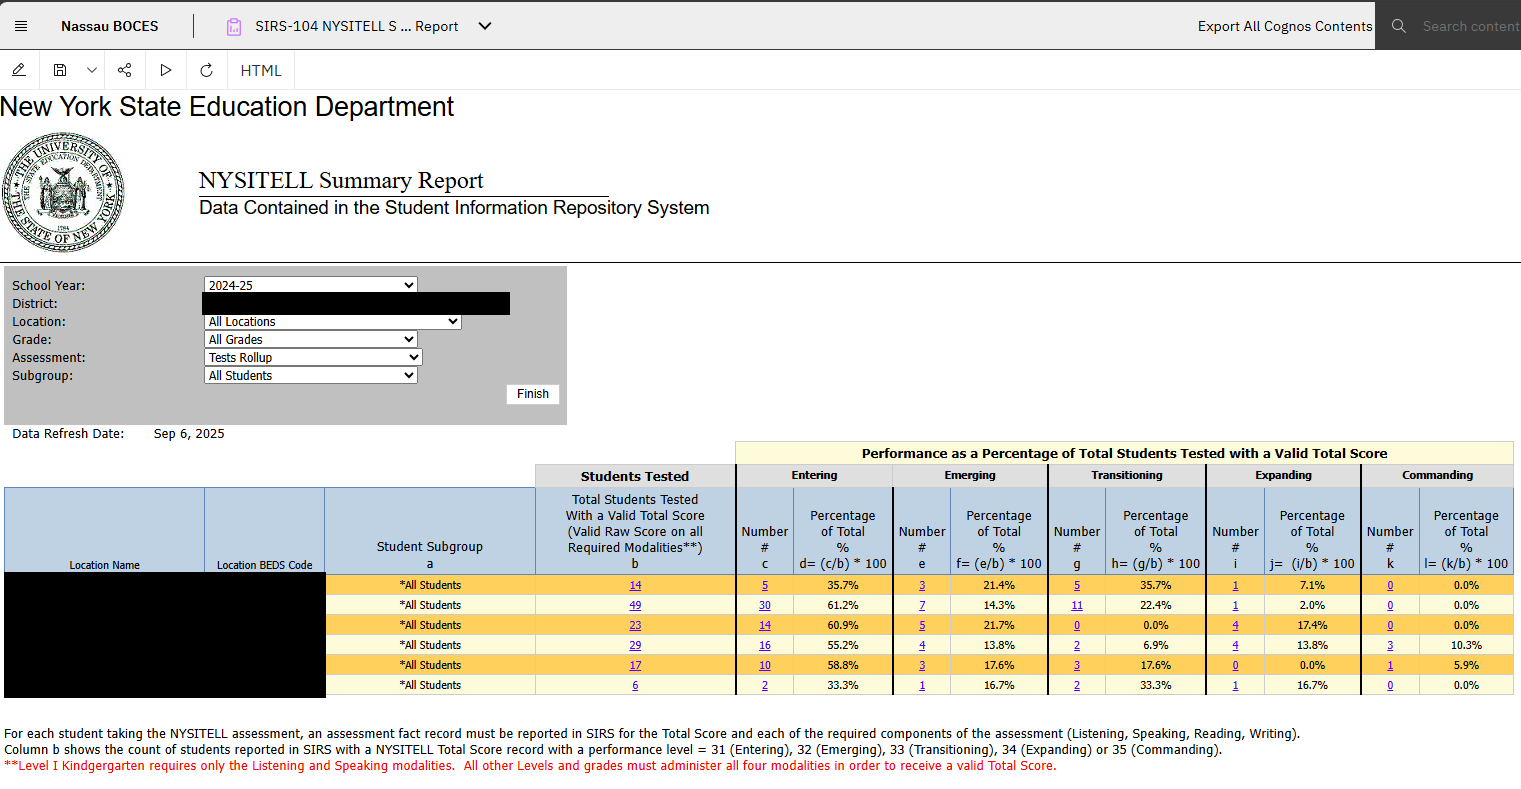
SIRS-104 NYSITELL Summary Report
|
District and school counts of students taking the NYSITELL assessment and performance
|
|
|
|
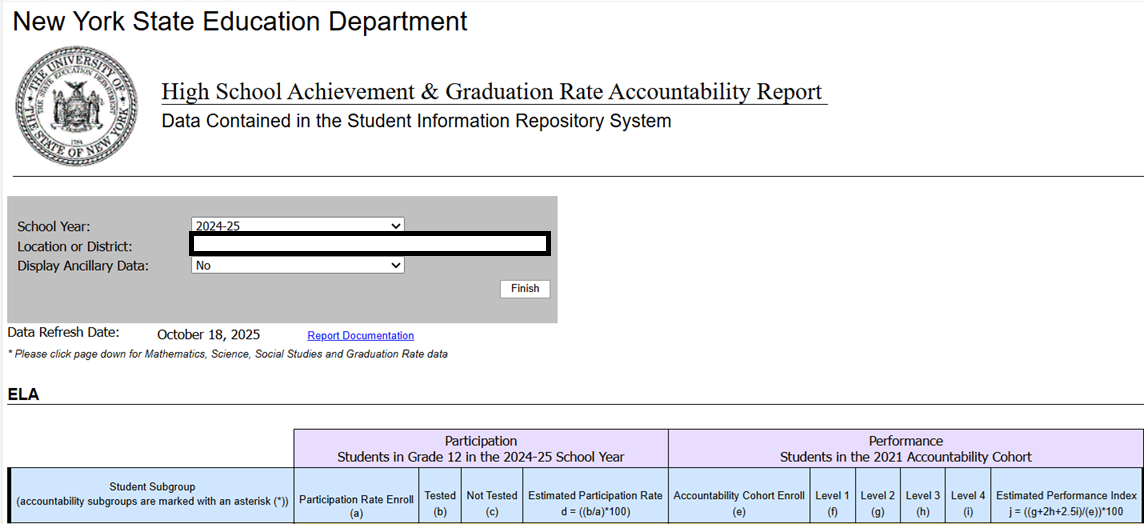
SIRS-105 High School Achievement & Graduation Rate Accountability Report
|
High School assessment and graduation data related to the ESSA Accountability system
|
|
|
|
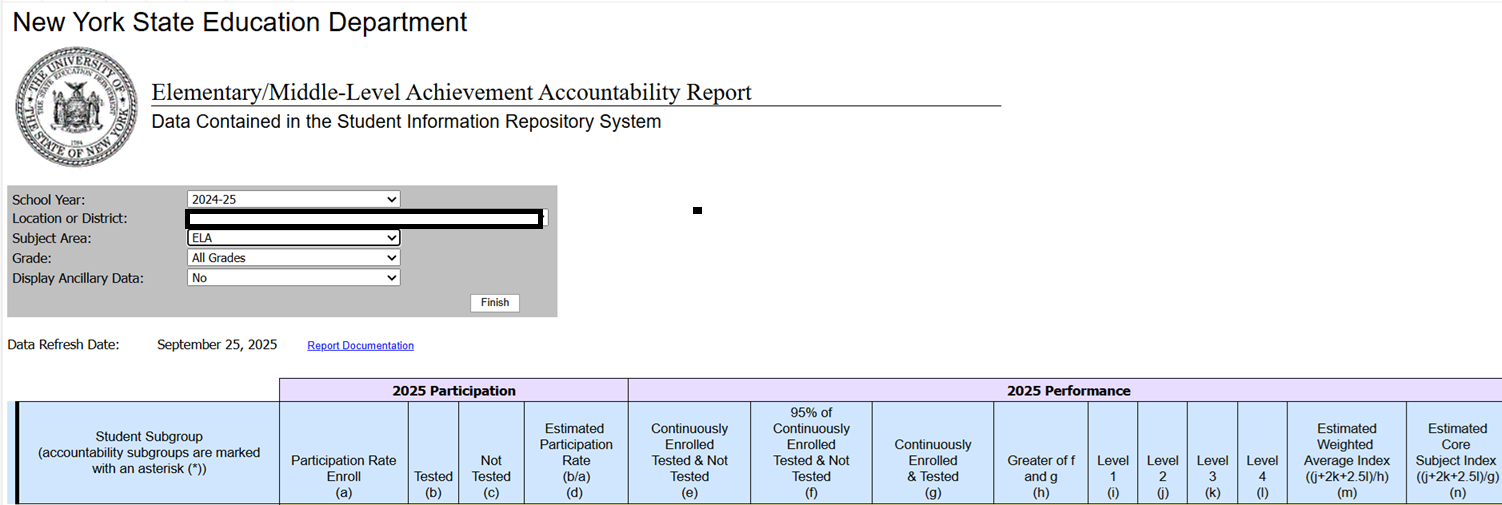
SIRS-106 Elementary/Middle-Level Achievement Accountability Report
|
Elementary/Middle level assessment data related to the ESSA Accountability system
|
|
|
|
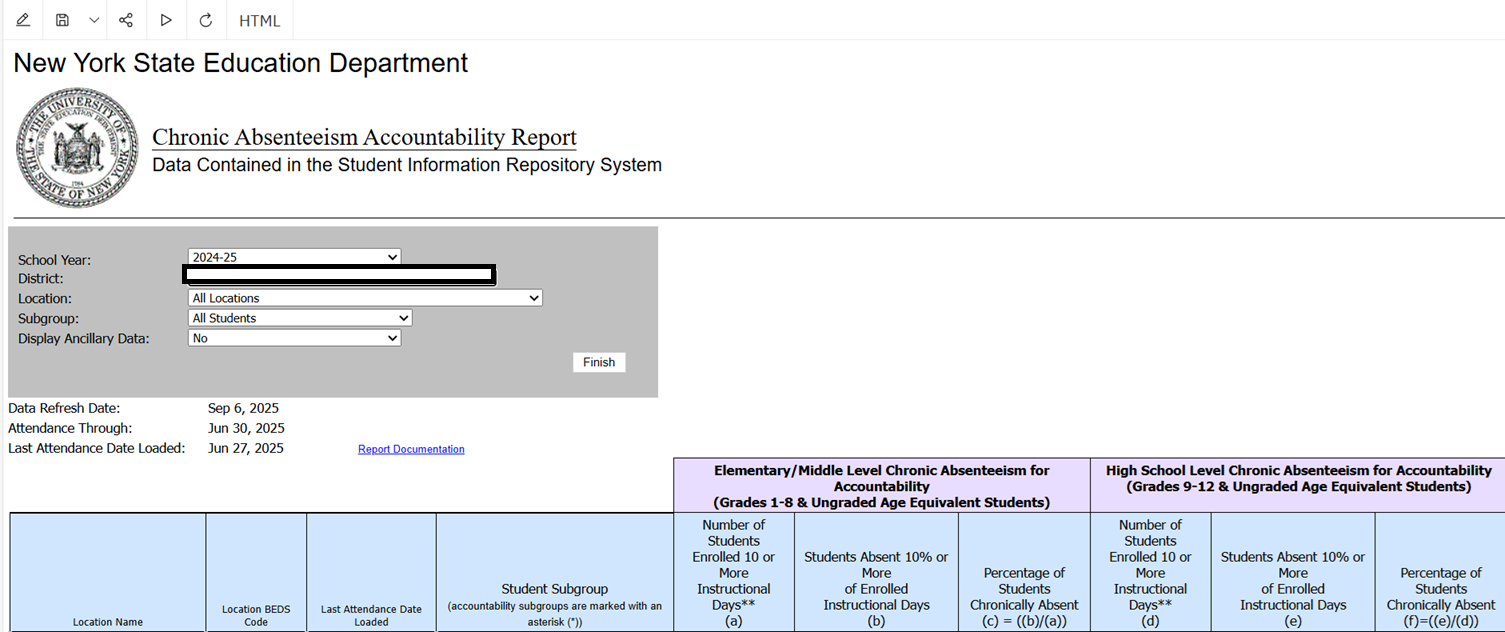
SIRS-107 Chronic Absenteeism Accountability Report
|
ESSA Accountability Attendance report for SY2023-2024 and earlier.
|
|
|
|
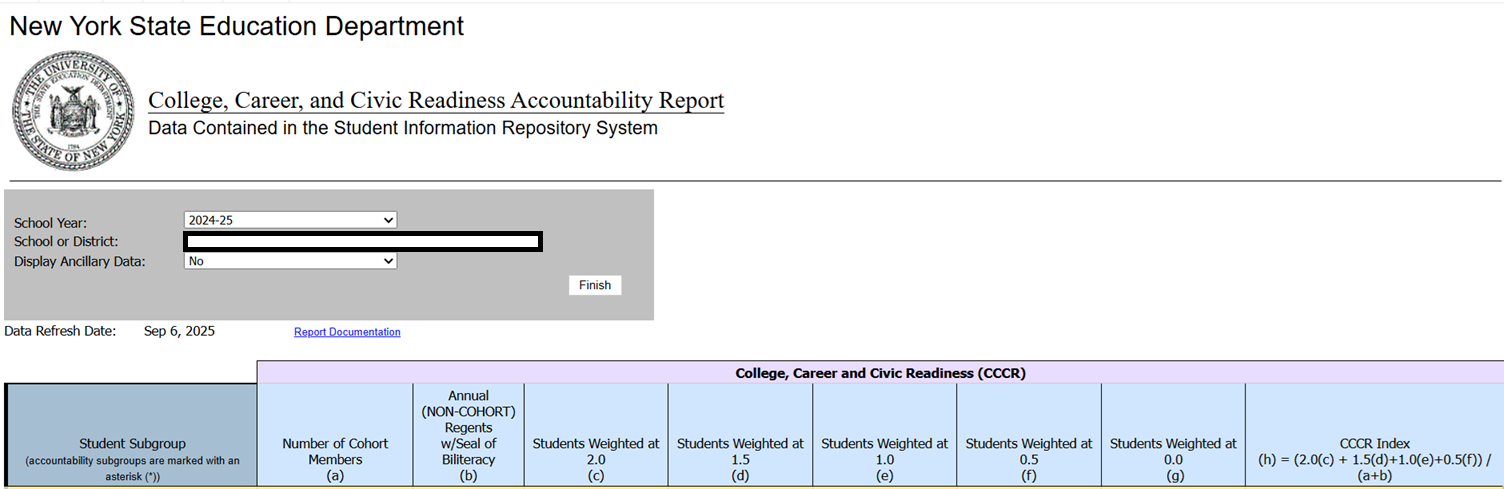
SIRS-108 College, Career, Civic Readiness Accountability Report
|
ESSA Accountability graduate exit information
|
|
|
|
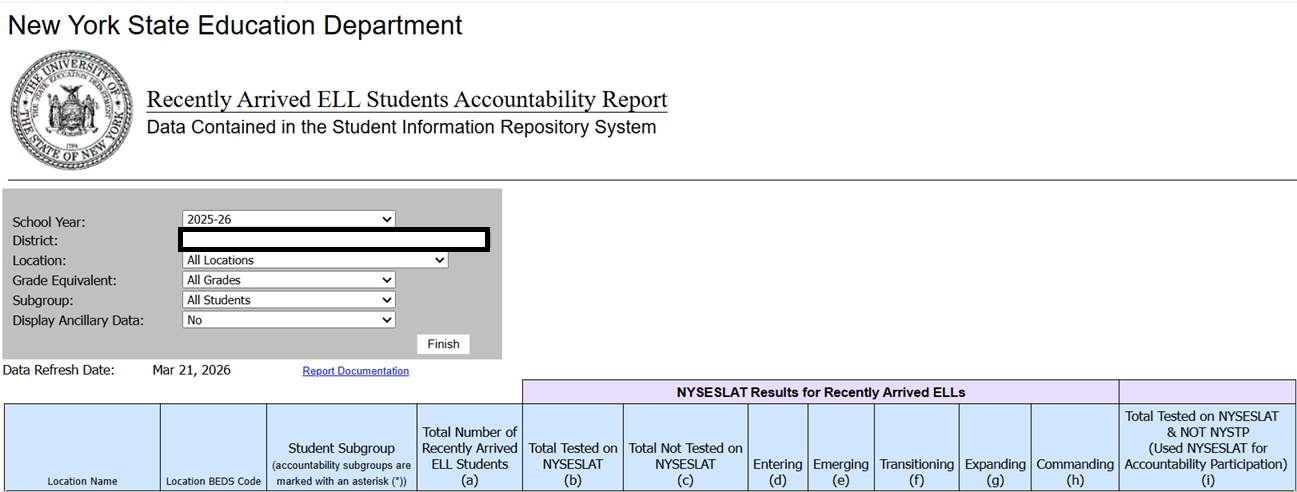
SIRS-109 Recently Arrived ELL Students Accountability Report
|
Counts of ELL students that took the NYSESLAT in lieu of the NYSTP ELA exams
|
|
|
|
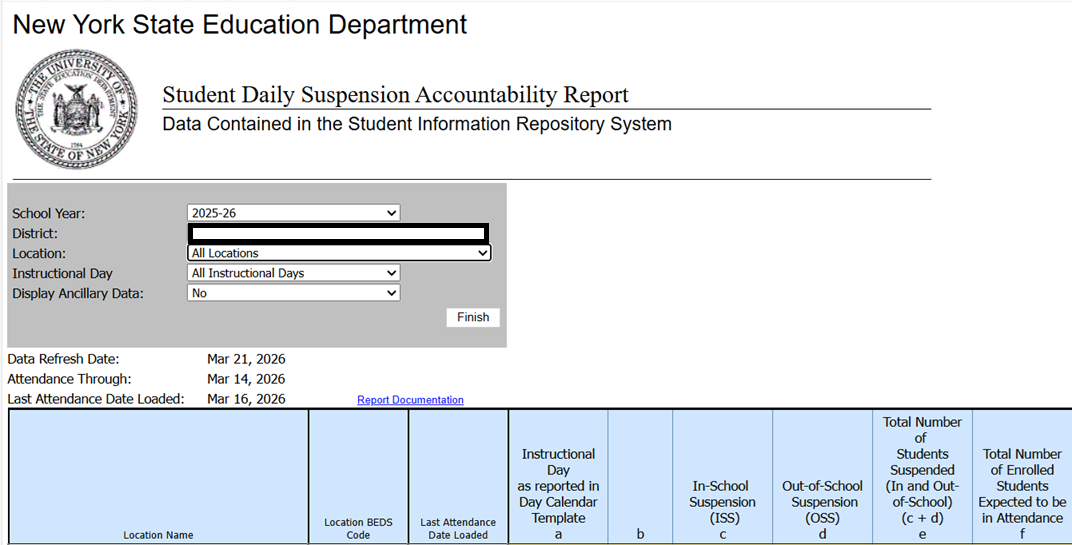
SIRS-110 Student Daily Suspension Accountability Report
|
Suspension rate information through an ESSA Accountability lens
|
|
|
|
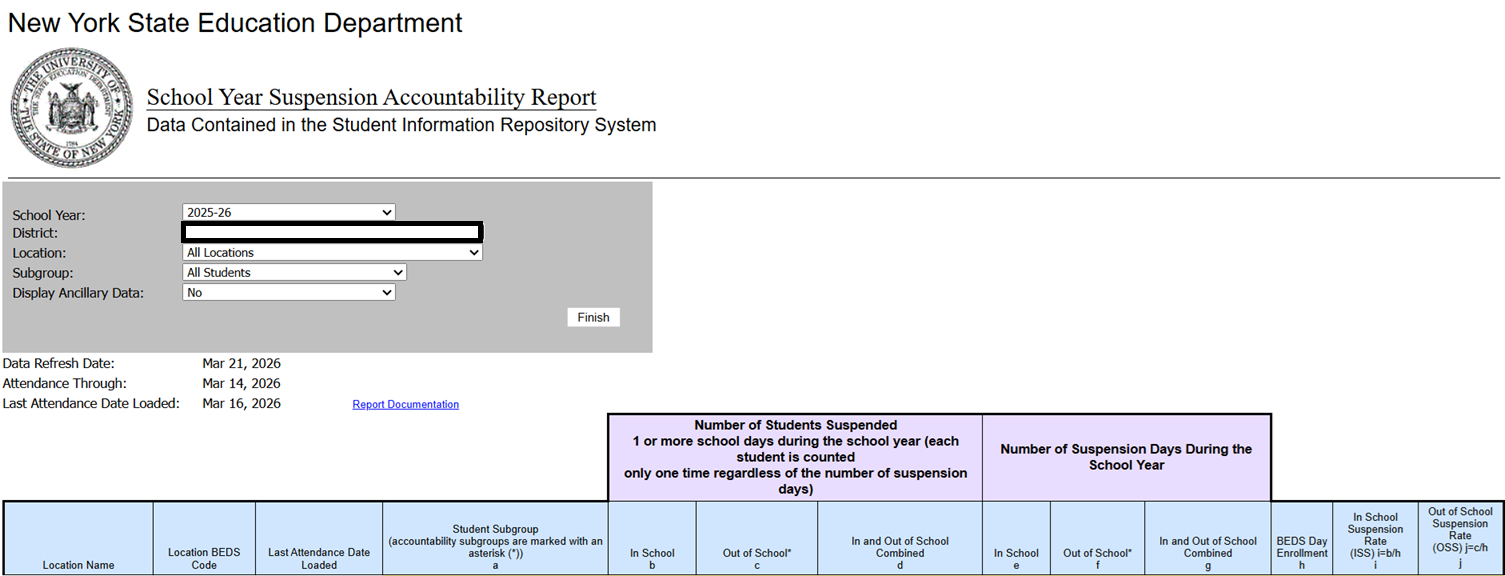
SIRS-111 School Year Suspension Accountability Report
|
Suspension rate information through an ESSA Accountability lens
|
|
|
|
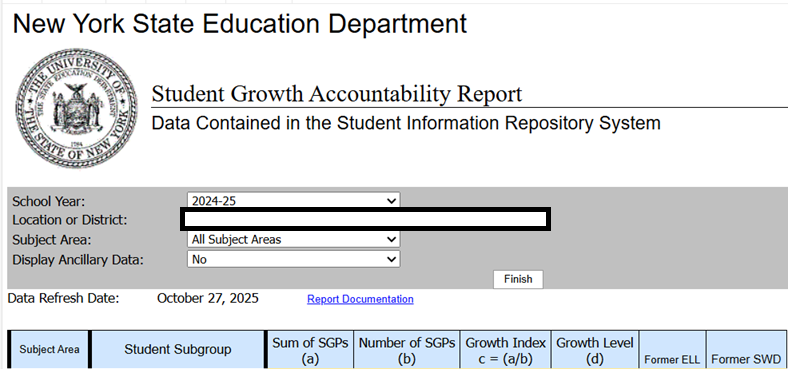
SIRS-112 Student Growth Accountability Report
|
A two year elementary/middle student assessment performance comparison
|
|
|
|
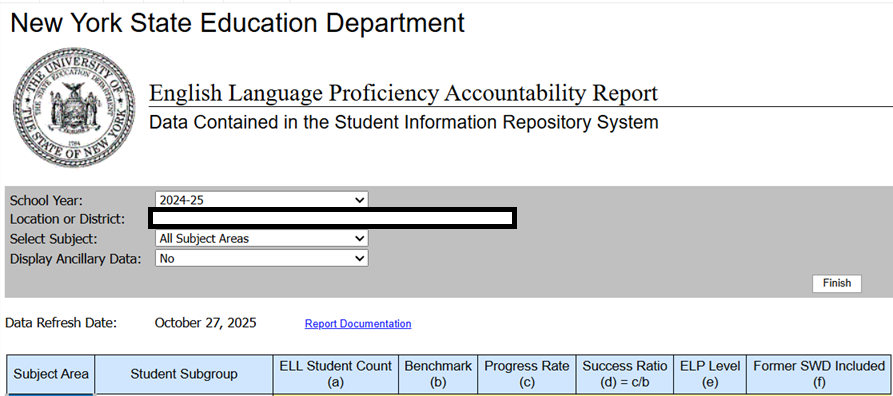
SIRS-113 English Language Proficiency Accountability Report
|
ELL student NYSESLAT performance and benchmarks
|
|
|
|
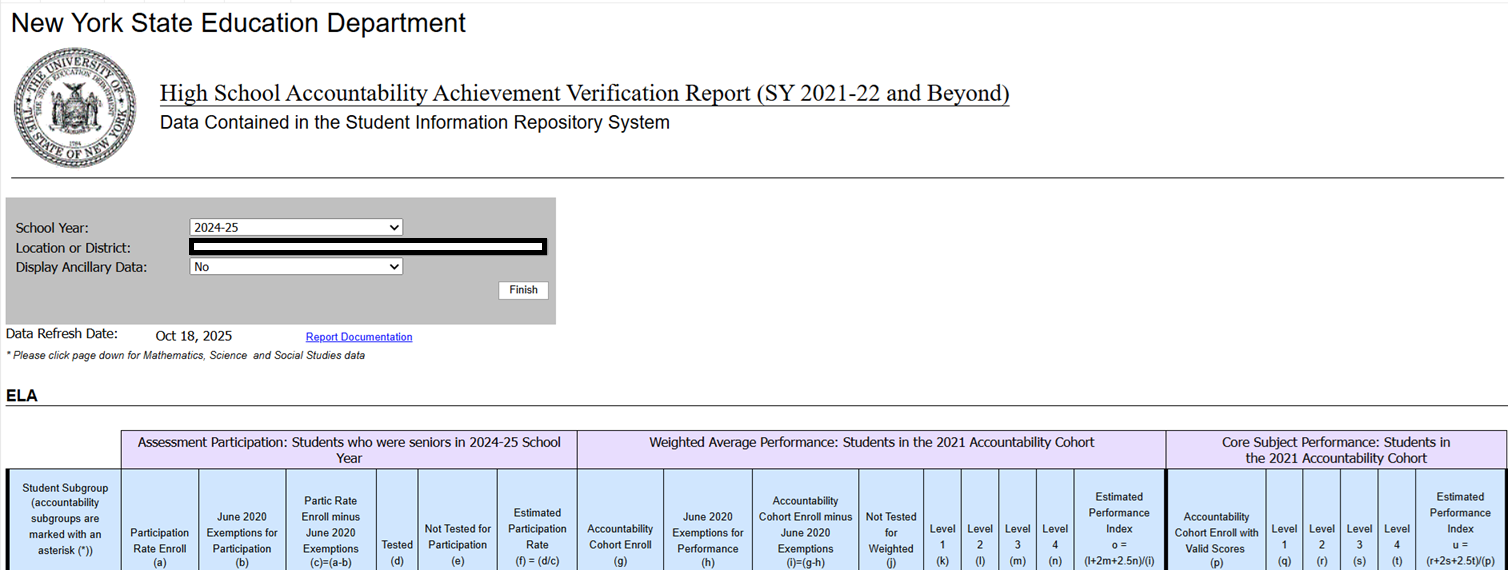
SIRS-114 High School Accountability Achievement Verification Report (SY 2021-22 and Beyond)
|
High School assessment and graduation data related to the ESSA Accountability system
|
|
|
|
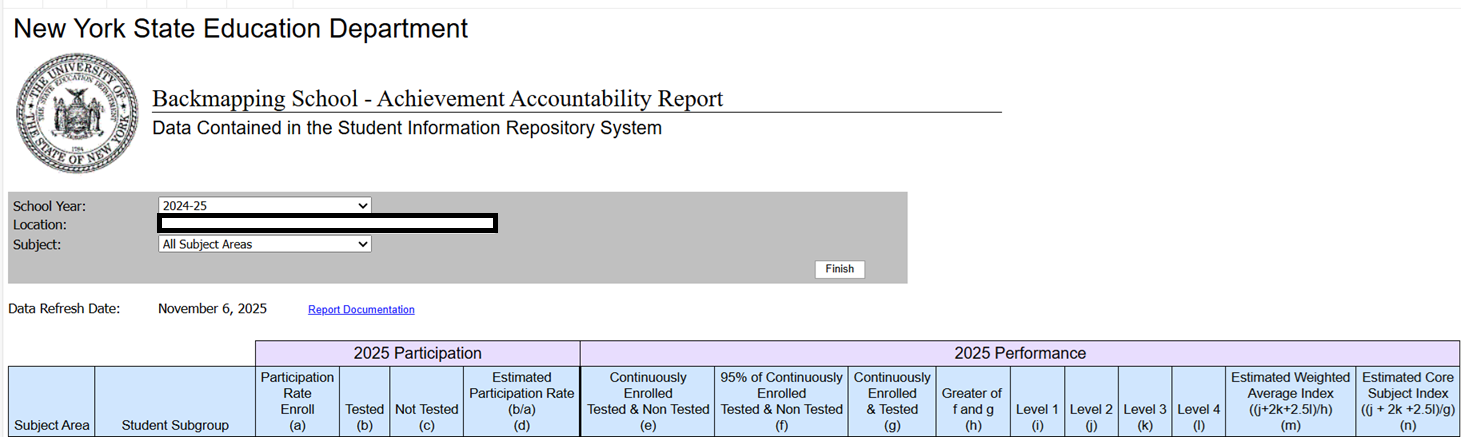
SIRS-115 Backmapping School Achievement Accountability Report
|
ESSA Accountability information for schools who only offer up to grades 1 or 2 where the 3rd grade assessment performance is used to calculate indexes.
|
|
|
|
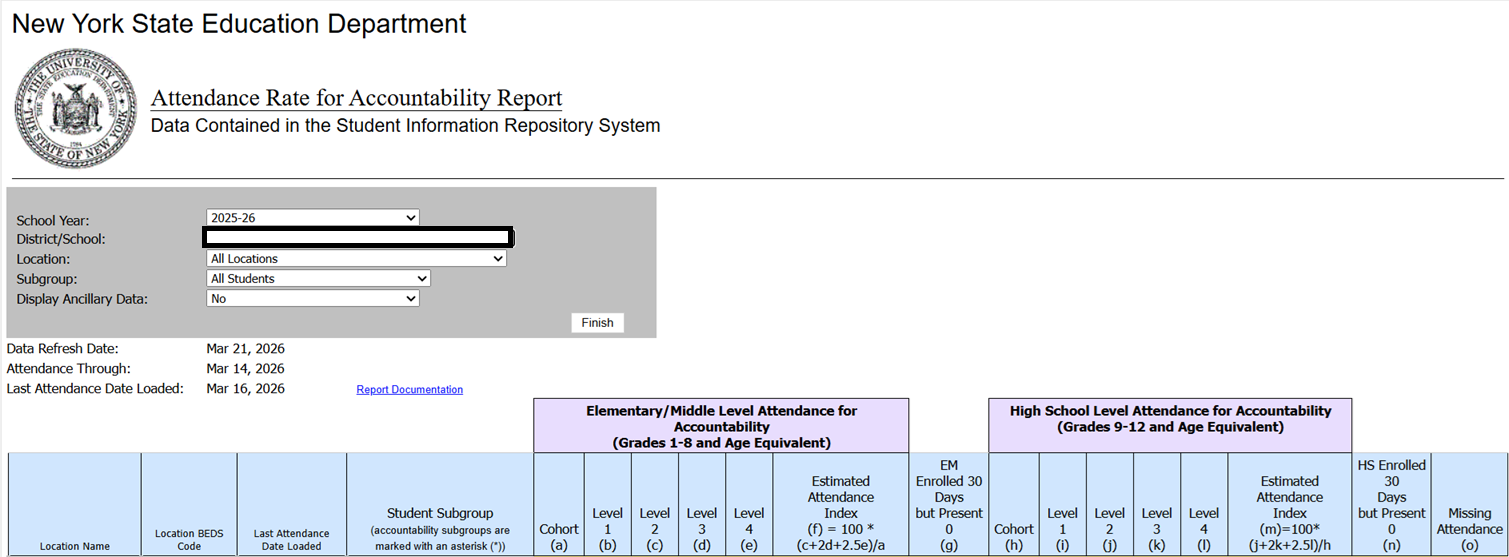
SIRS-116 Attendance Rate for Accountability Report
|
SY2024-2025 and beyond ESSA Accountability indicator for attendance rating.
|
|
|
|
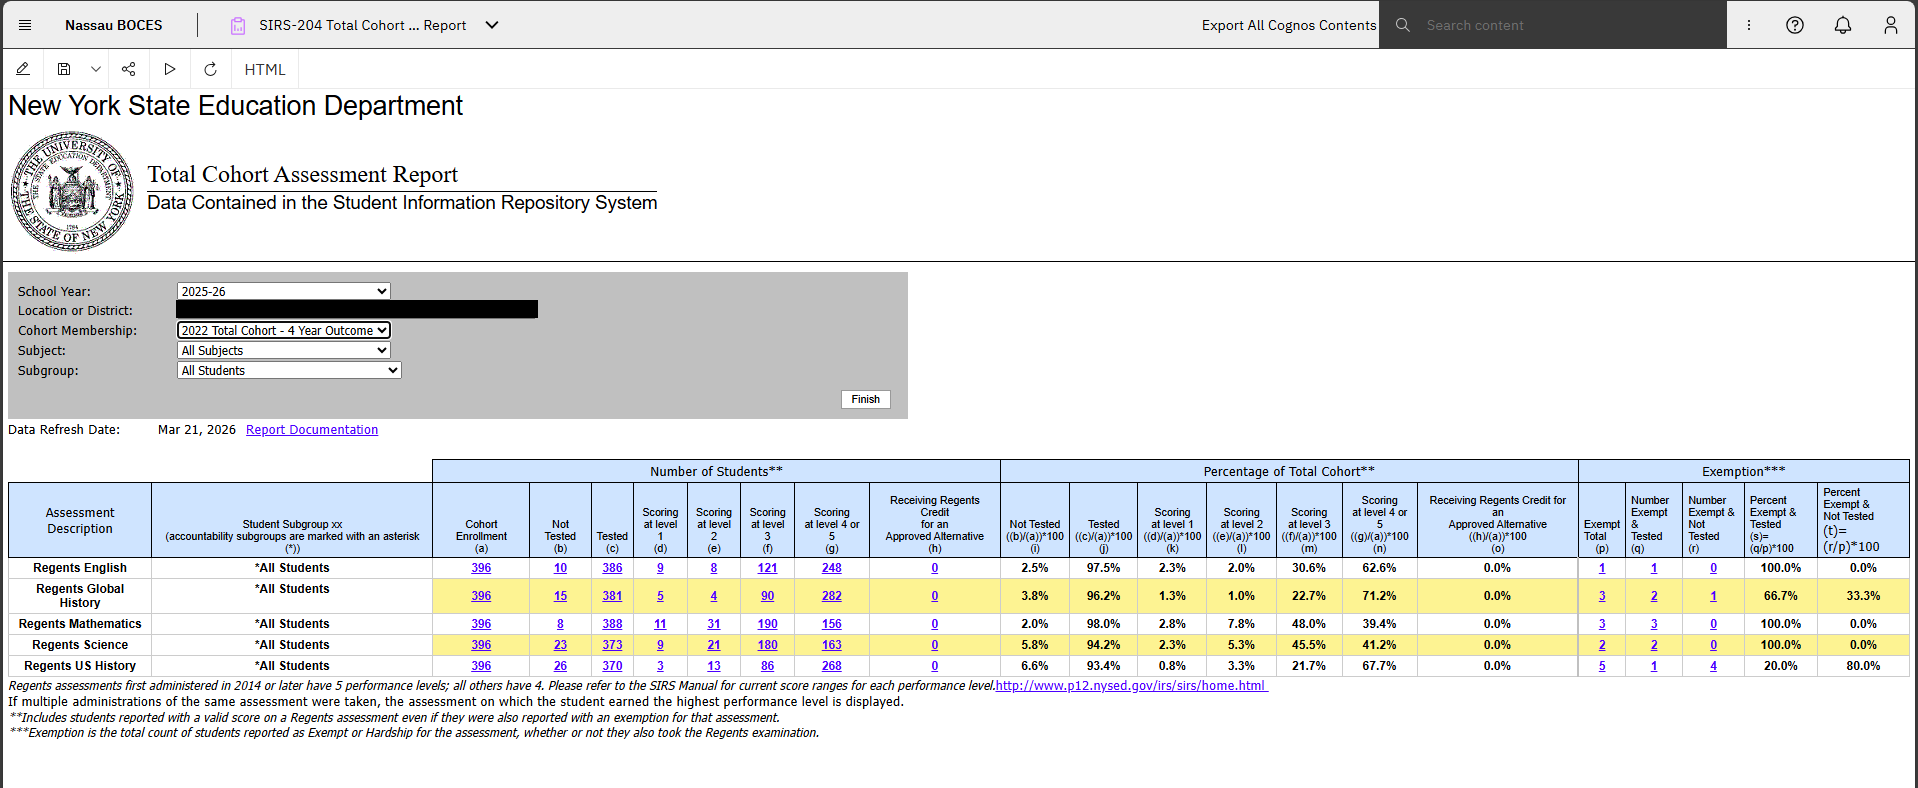
SIRS-204 Total Cohort Assessment Report
|
The Total Cohort Assessment Report summarizes enrollment and Regents (or approved alternative) results by subject for 1- to 6-year cohorts as of June 30, and records students exempted because they passed the course but couldn’t take the exam due to it not being offered or a Public Health Emergency.
|
|
|
|
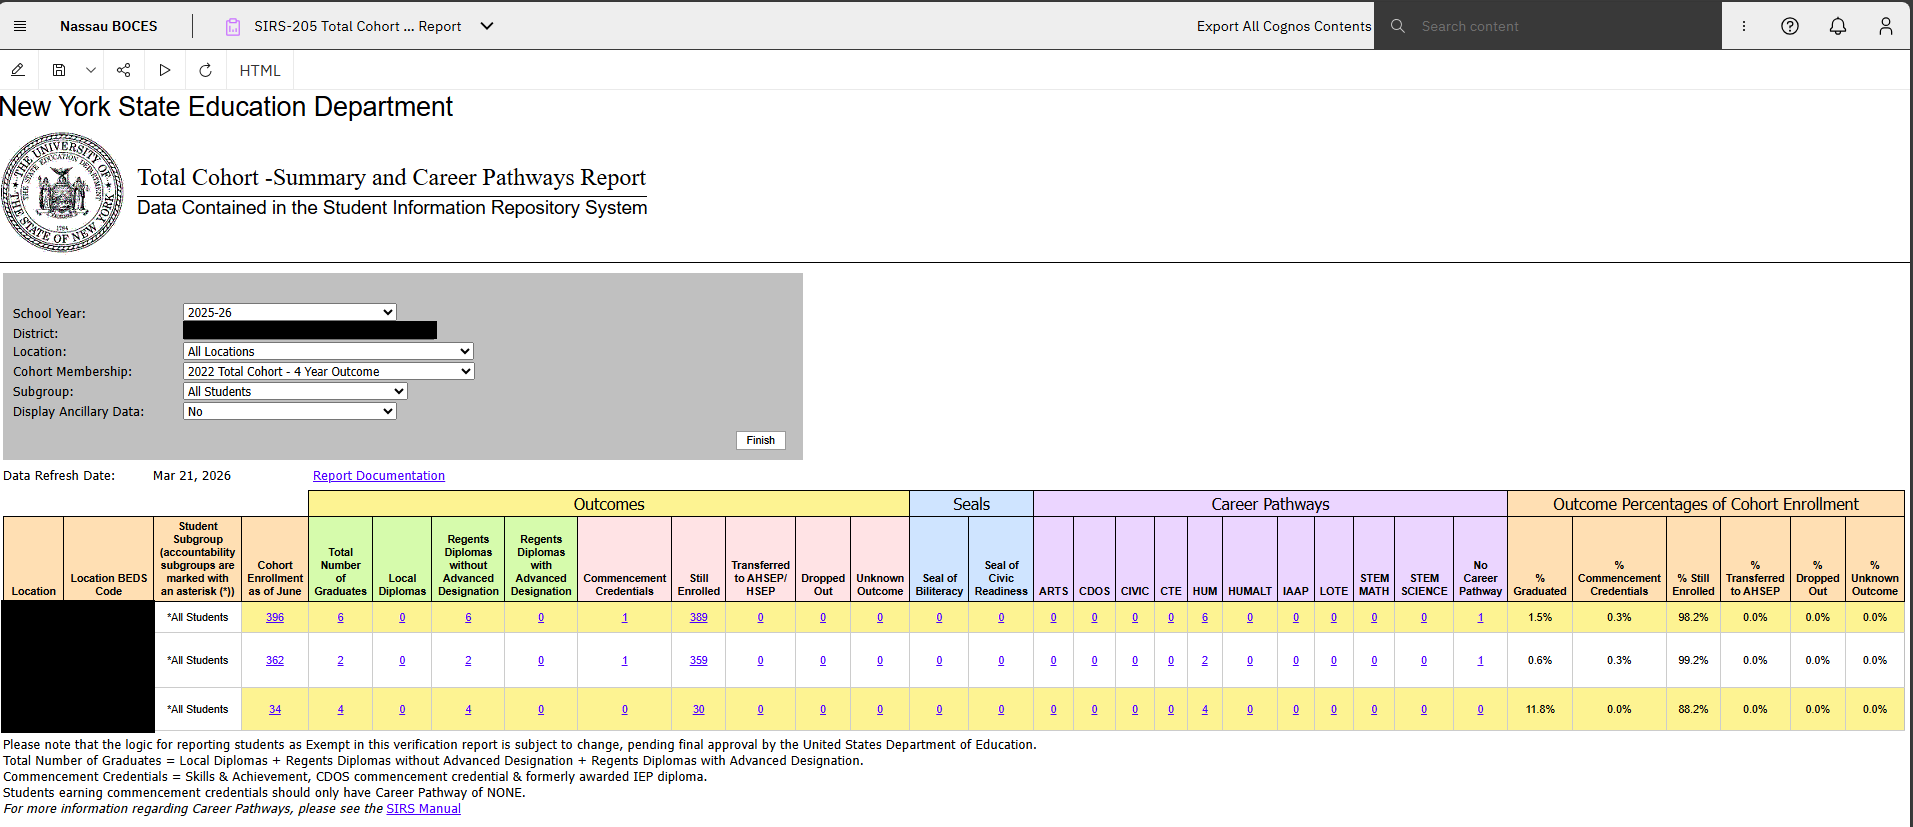
SIRS-205 Total Cohort Career Pathways Summary Report
|
The Total Cohort Career Pathways Summary Report shows total cohort enrollment, district and school career pathway outcomes and school career pathway outcomes.
|
|
|
|
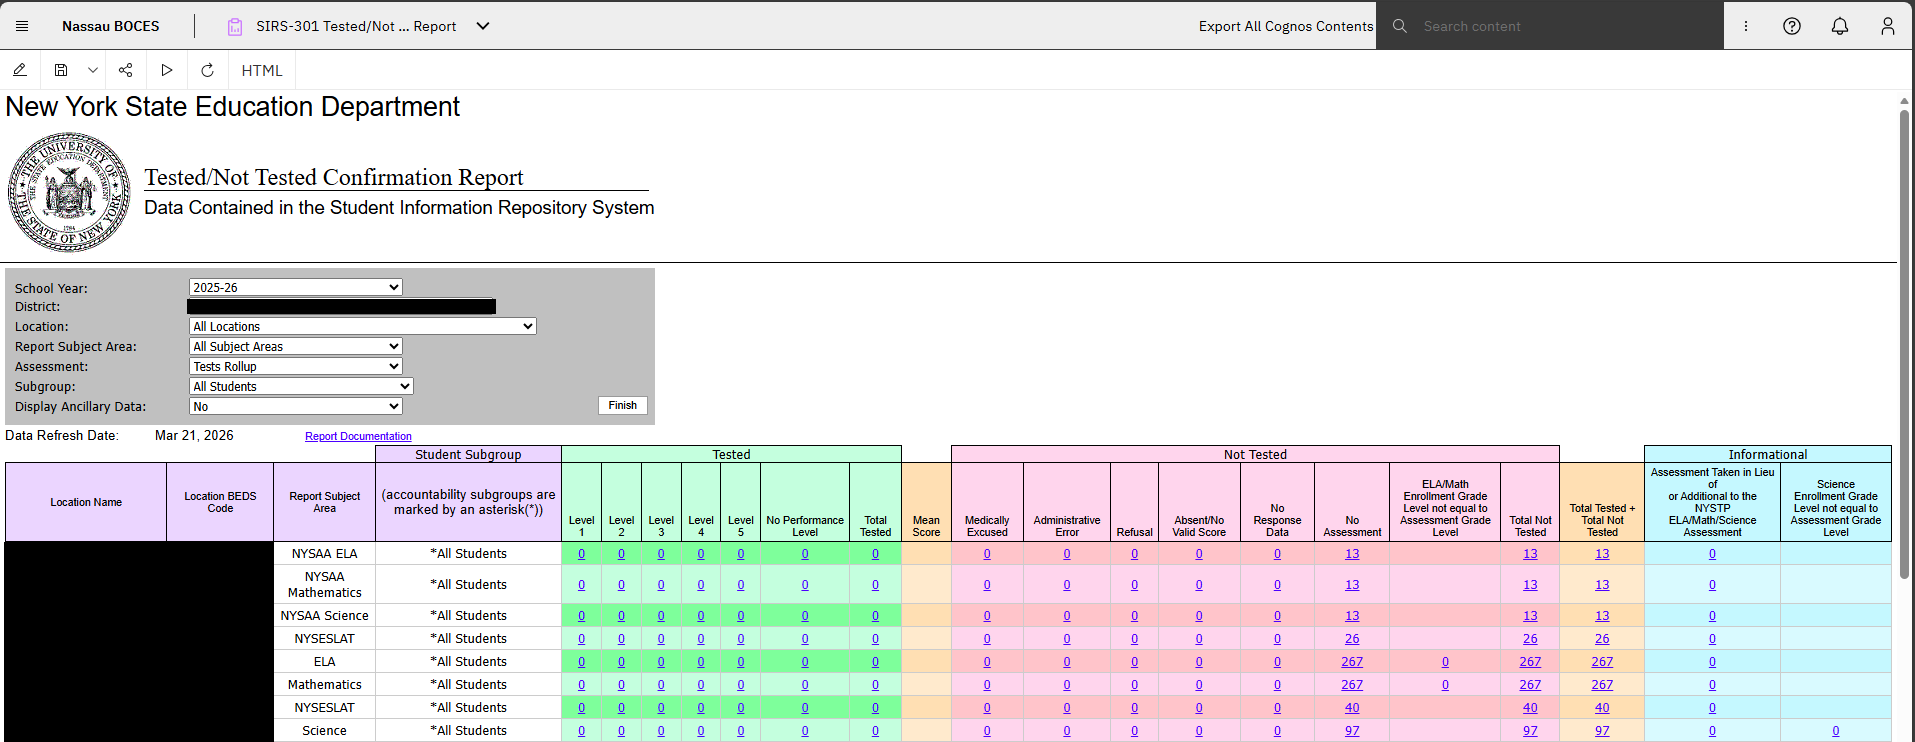
SIRS-301 Tested/Not Tested Confirmation Report
|
Enrollment and performance for students in grades 3-8 who are required to take 3-8 ELA and mathematics and 4 and 8 science, Regents performance for students taking a Regents science assessment in lieu of grade 8 science, and enrollment and performance for students taking NYSESLAT or NYSAA
|
|
|
|
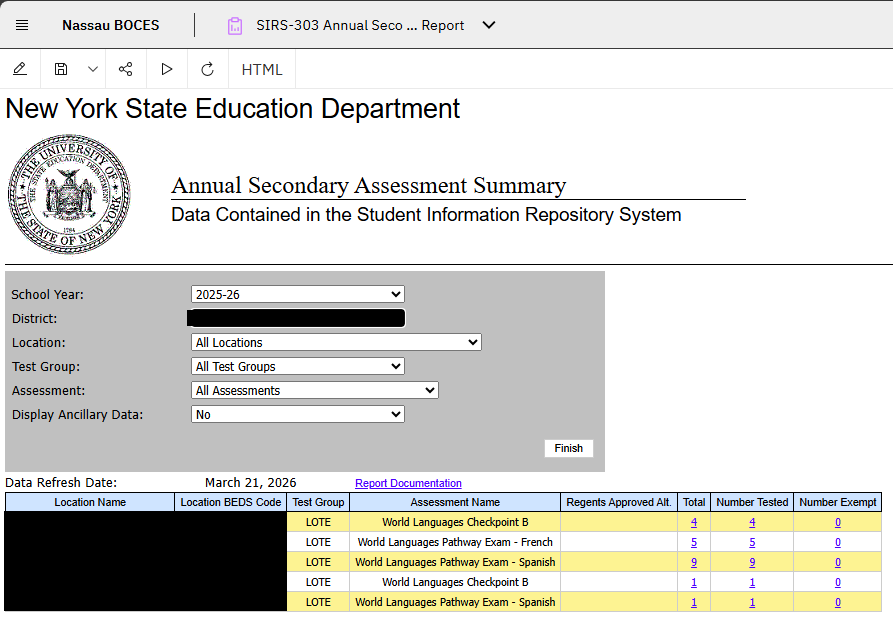
SIRS-303 Annual Secondary Assessment Summary Report
|
Enrollment and performance for students in grades 3-8 who are required to take 3-8 ELA and mathematics and 4 and 8 science, Regents performance for students taking a Regents science assessment in lieu of grade 8 science, and enrollment and performance for students taking NYSESLAT or NYSAA
|
|
|
|
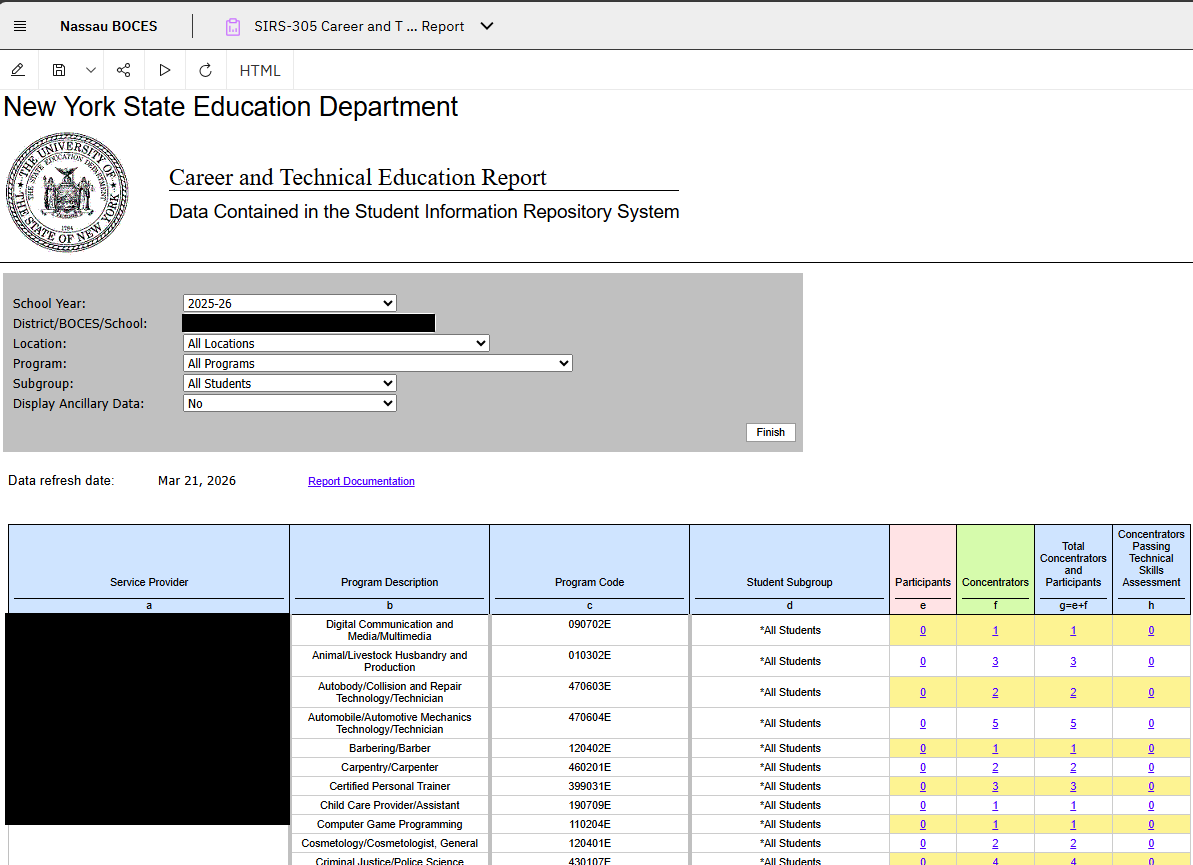
SIRS-305 Career and Technical Education Report
|
Review annual CTE data by location, program or subgroup.
|
|
|
|
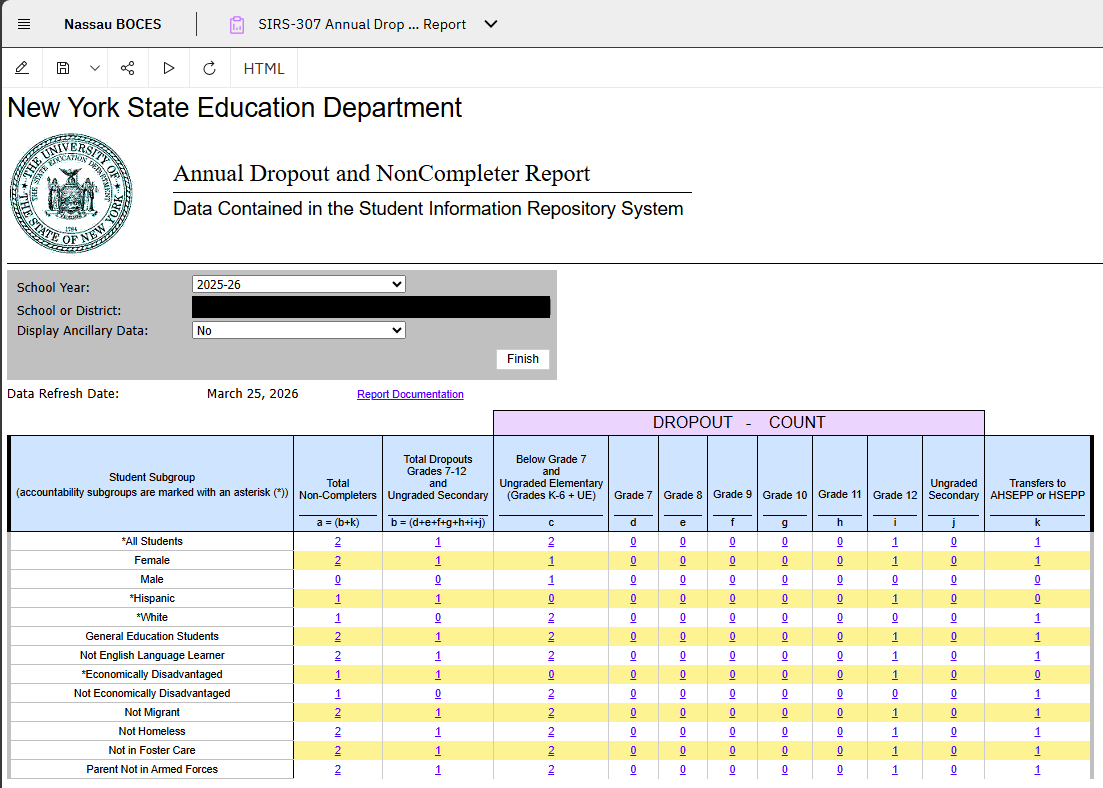
SIRS-307 Annual Dropout & NonCompleter Report
|
Annual counts of students who dropped out or transferred to AHSEPP or GED during the school year
|
|
|
|
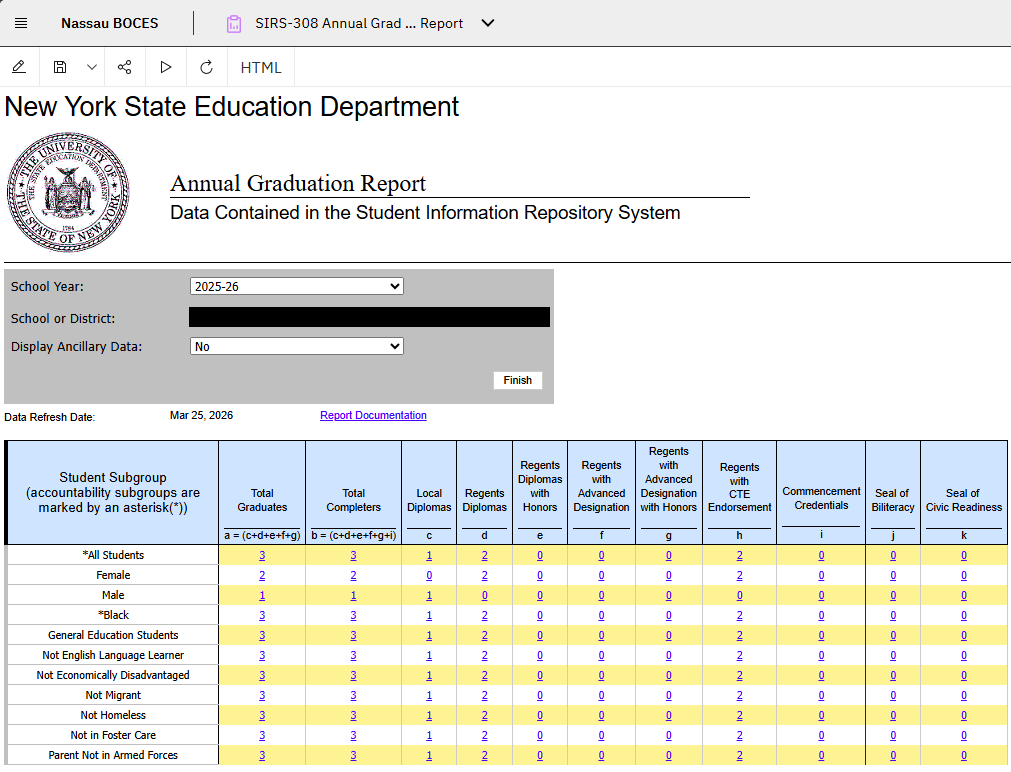
SIRS-308 Annual Graduation Report
|
Annual counts of students who graduated or earned SWD credentials during the school year
|
|
|
|
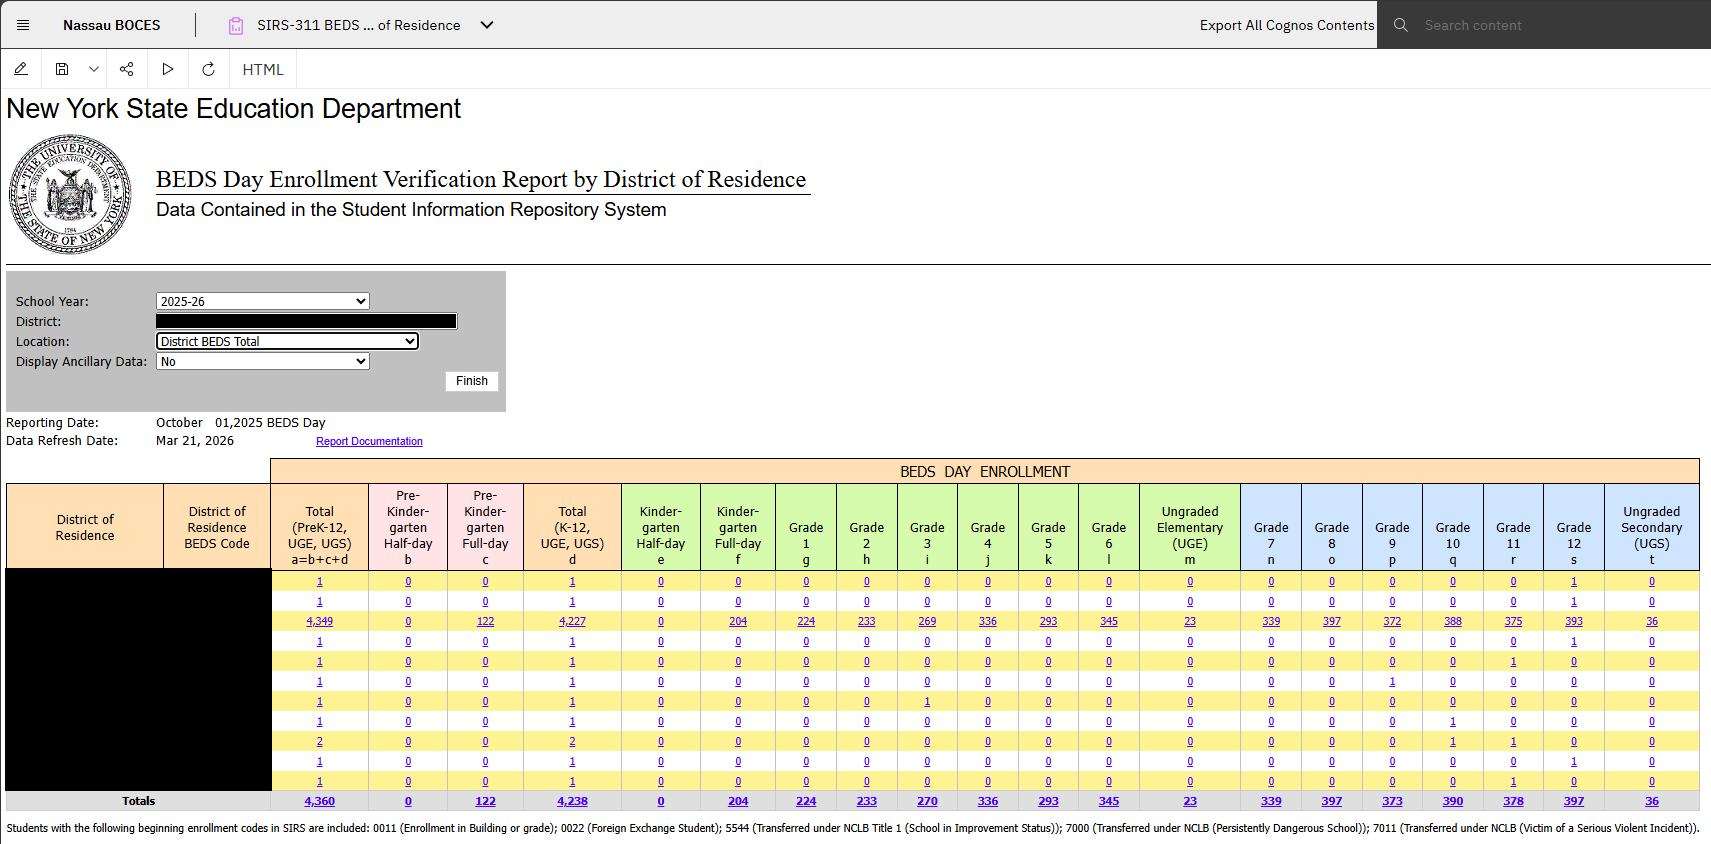
SIRS-311 BEDS Day Enrollment Verification Report by District of Residence
|
Counts of students enrolled in schools in the district (or charter school) on BEDS day by their district of residence.
|
|
|
|
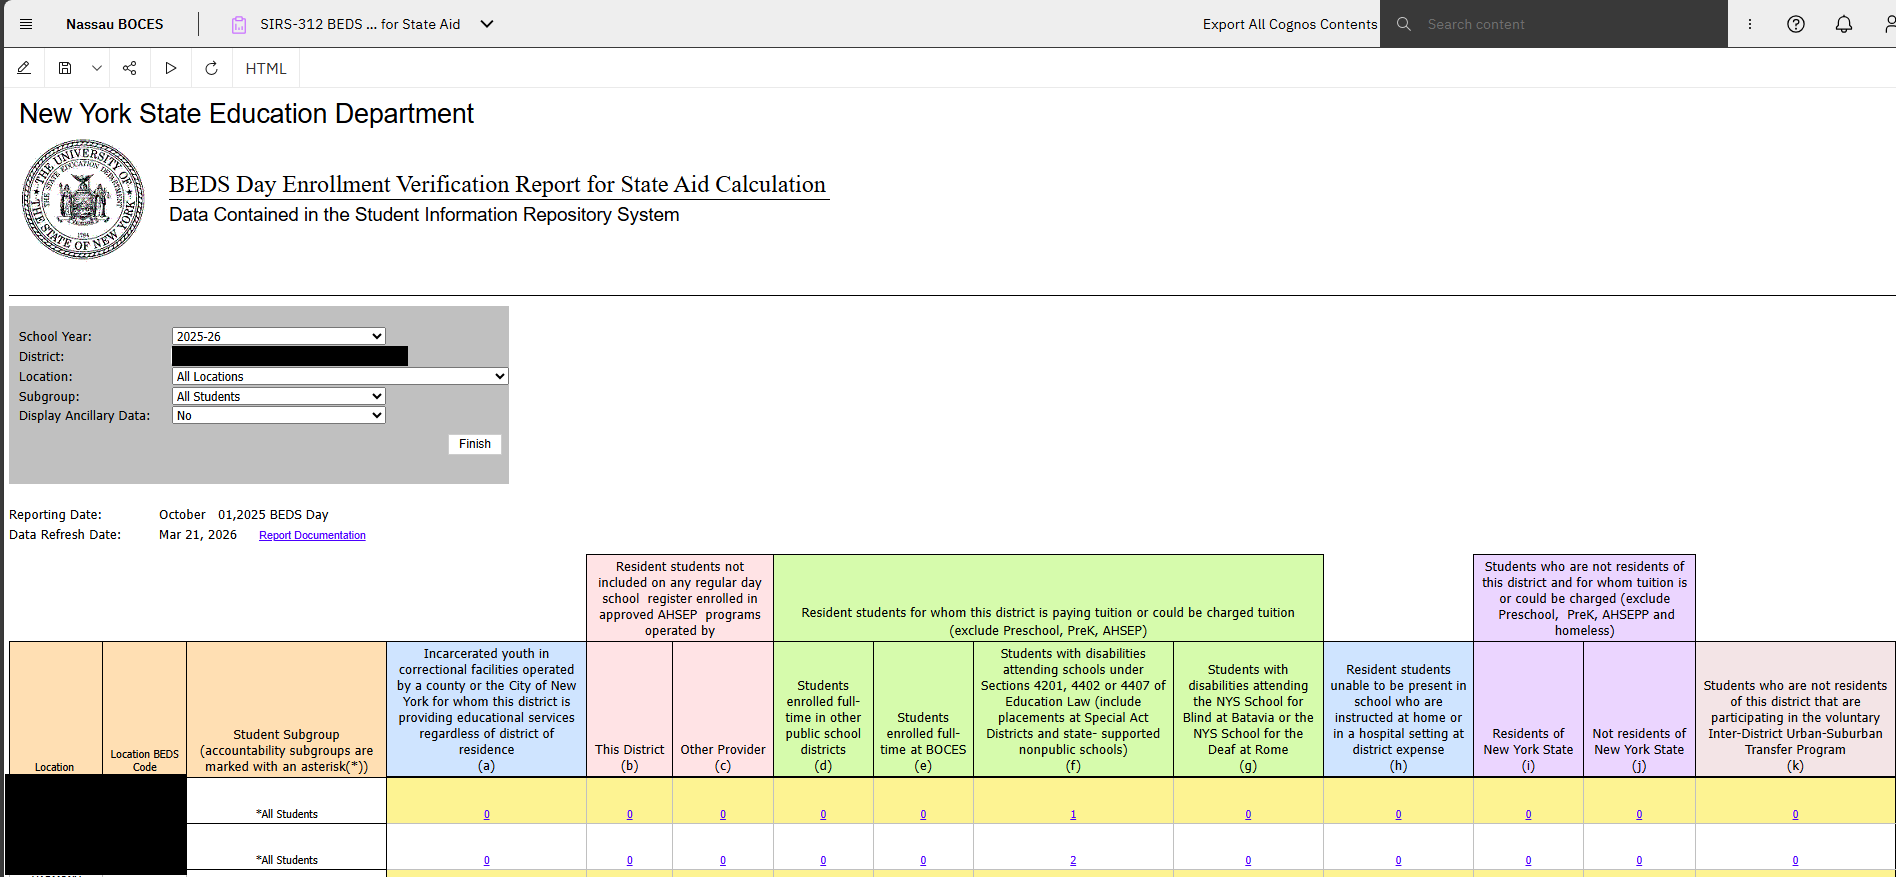
SIRS-312 BEDS Day Enrollment for State Aid
|
Counts of certain types of students (students from other districts, students sent to other districts, etc.) who were enrolled on BEDS day for use in certain aid allocations
|
|
|
|
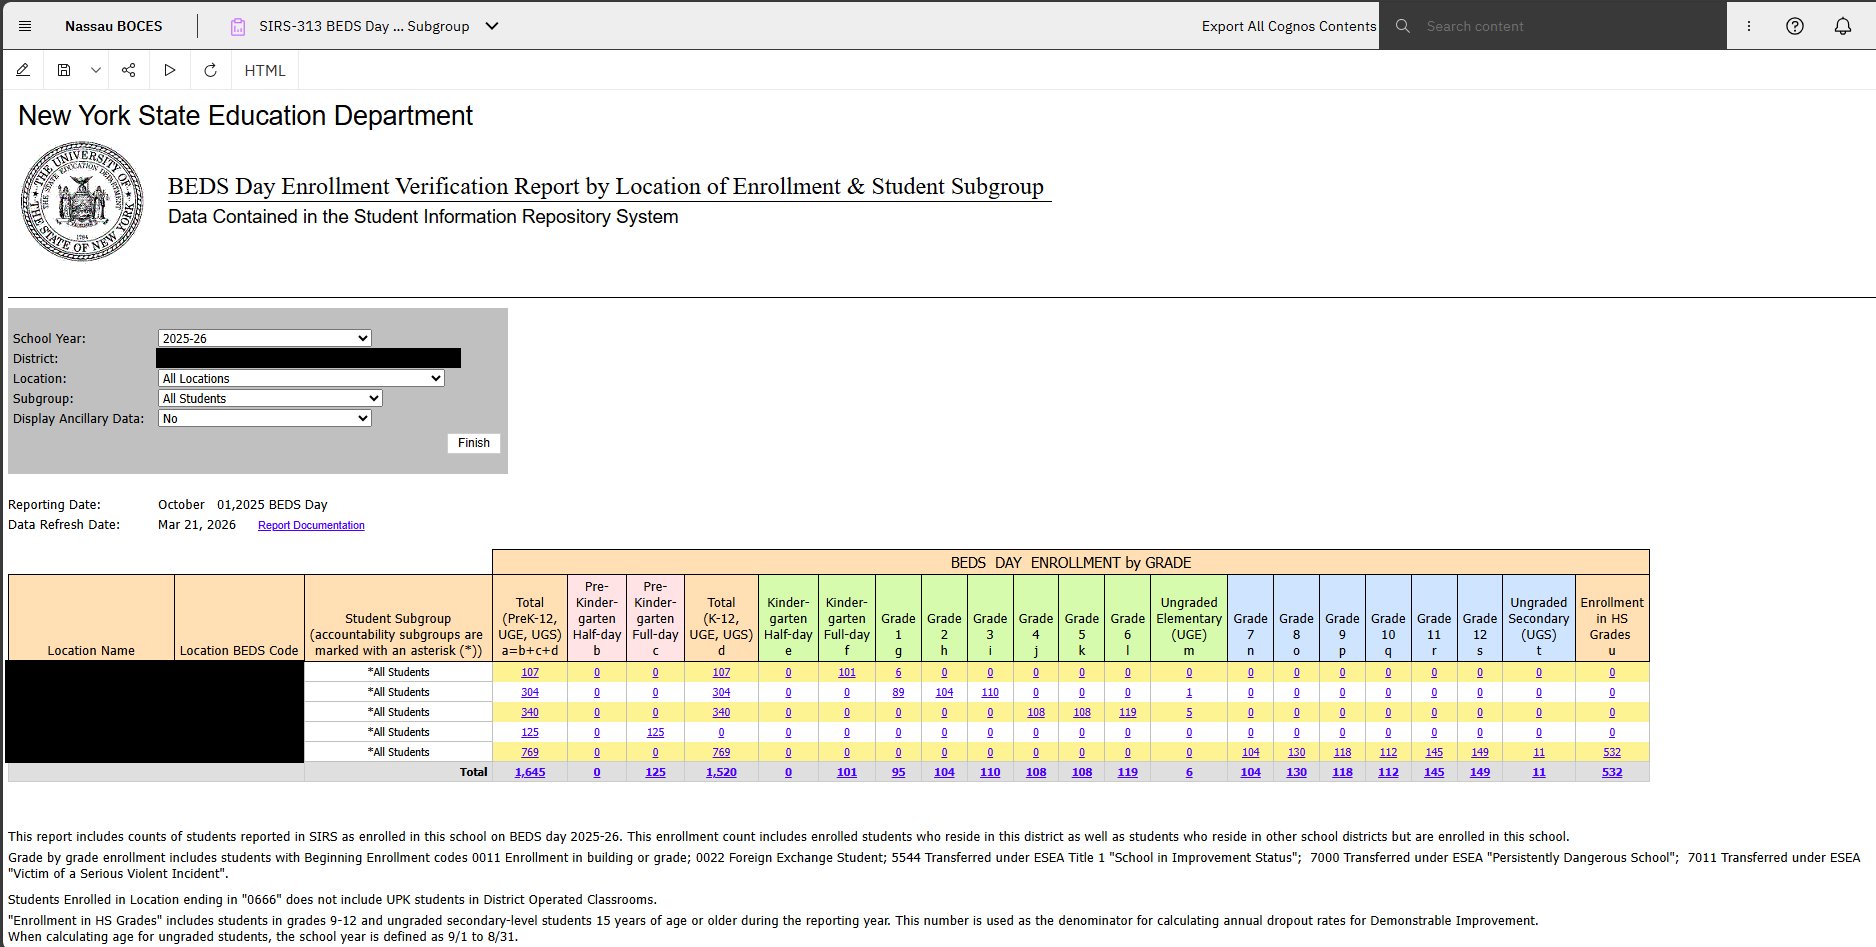
SIRS-313 BEDS Day Enrollment Verification Report by Location of Enrollment & Student Subgroup
|
Counts of students who were enrolled in the school on BEDS day by grade and student subgroup
|
|
|
|
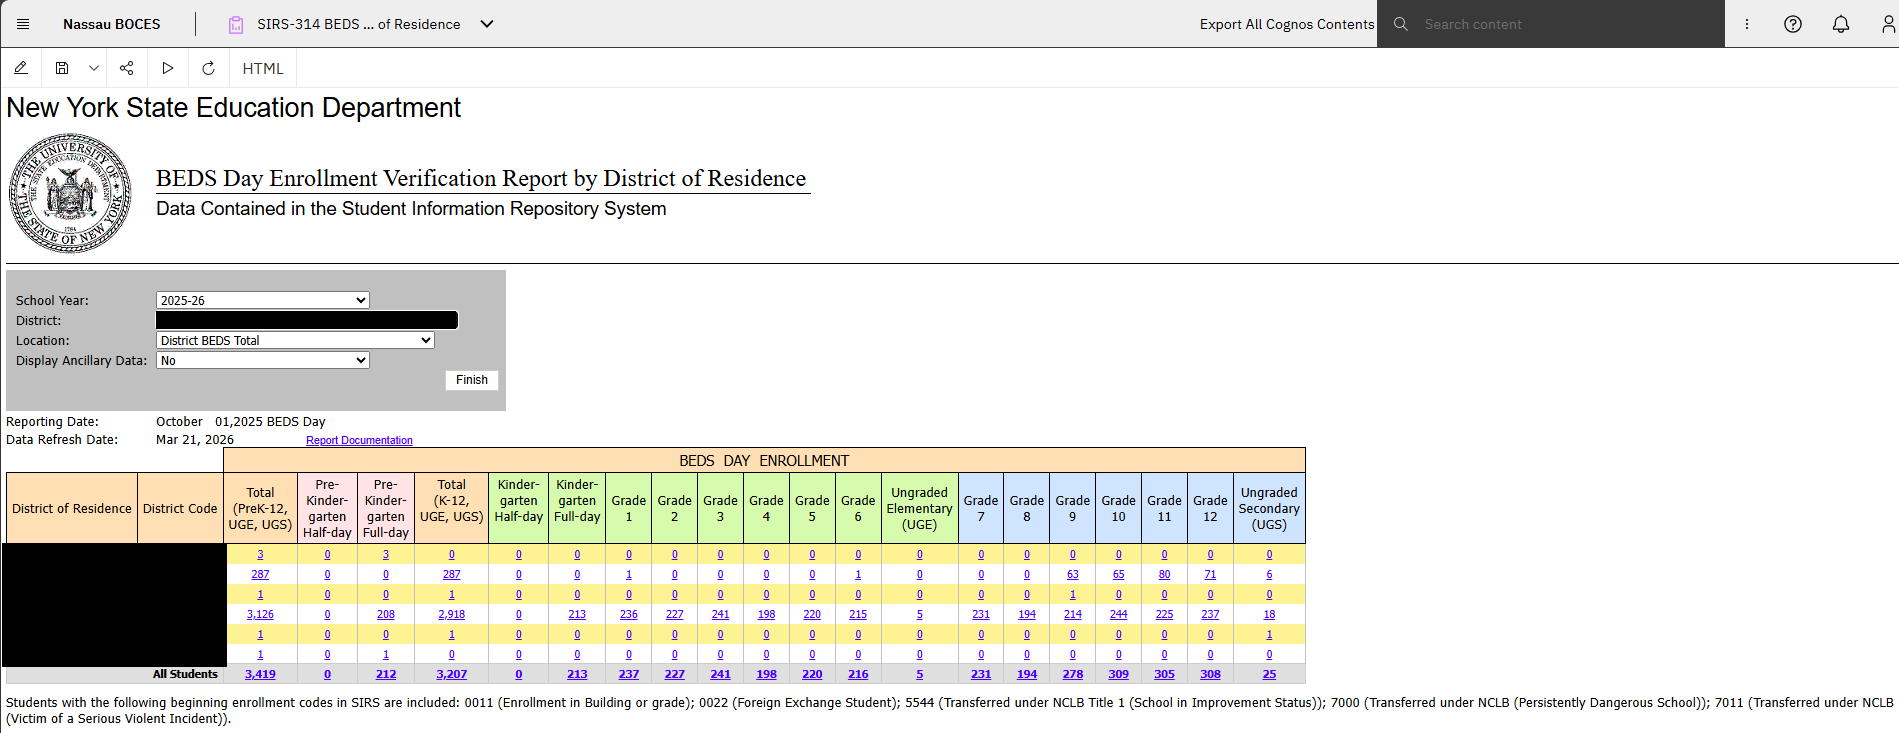
SIRS-314 BEDS Day Enrollment by District of Residence
|
Counts of students enrolled in schools in the district (or charter school) on BEDS day by their district of residence.
|
|
|
|
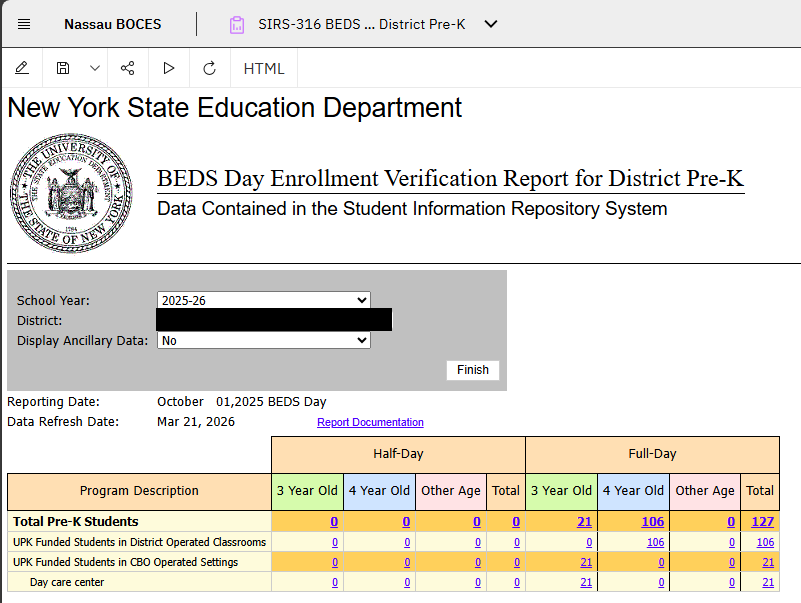
SIRS-316 BEDS Day Pre-K Enrollment Report
|
BEDS day counts of students in the district in Pre-K with their UPK status
|
|
|
|
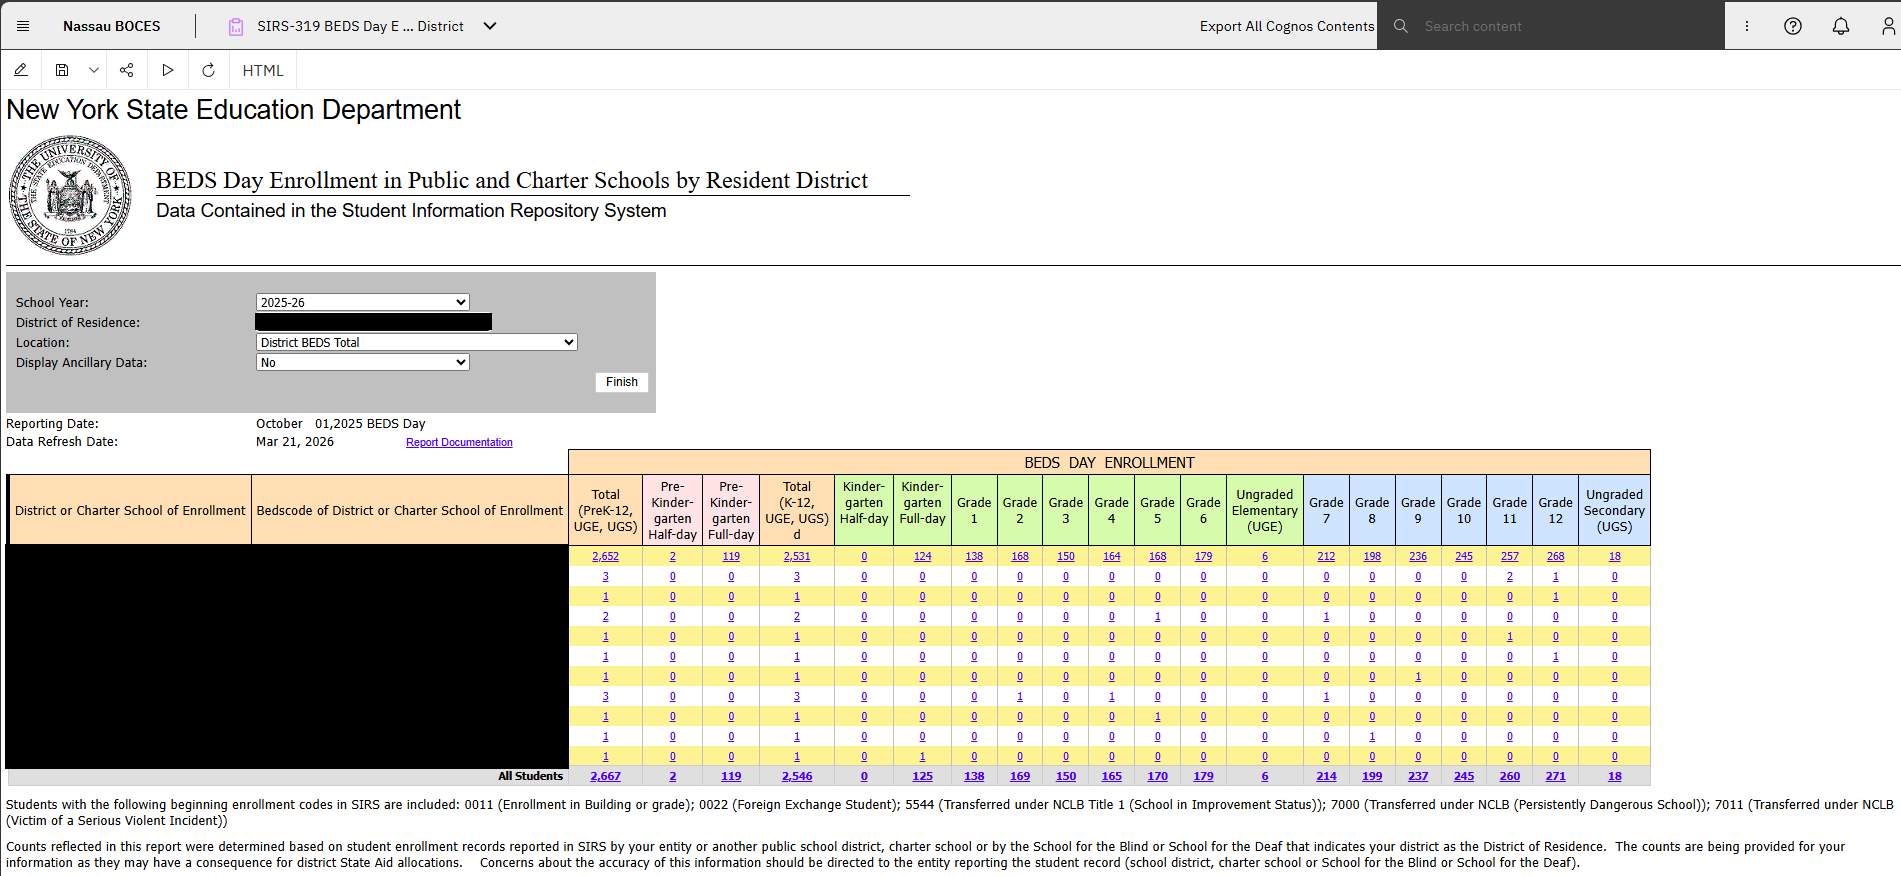
SIRS-319 BEDS Day Enrollment in Public and Charter Schools by Resident District
|
Counts of resident students by their district or charter school of enrollment on BEDS day
|
|
|
|
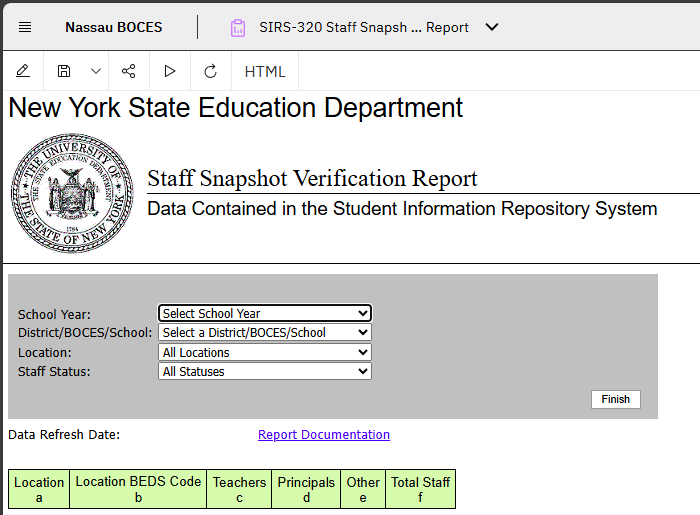
SIRS-320 Staff Snapshot Verification Report
|
Staff reported in SIRS with education, years of experience, salary and other selected personnel data. Staff Snapshot records are the source of teacher accounts used for ePMF and TAA authentication. A record must be reported in Staff Snapshot in order to report the individual in any other staff template.
|
|
|
|
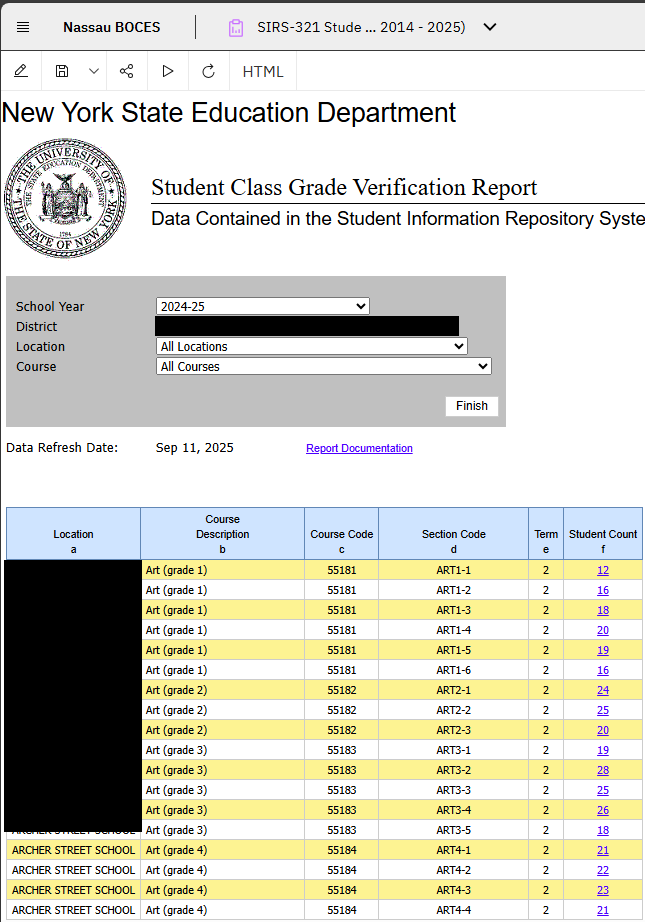
SIRS-321 Student Class Grade Detail Verification Report
|
Location summary of students by course and section with credits earned and final course grade on detail
|
|
|
|
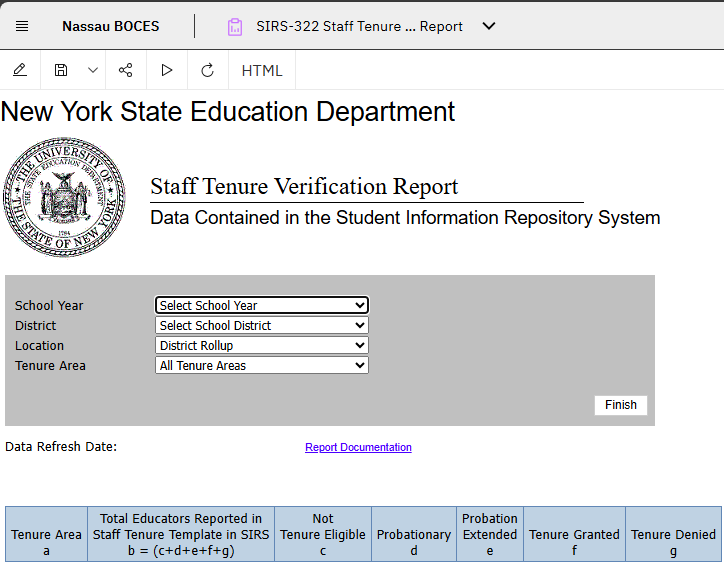
SIRS-322 Staff Tenure Verification Report
|
Staff reported in SIRS with education, years of experience, salary and other selected personnel data
|
|
|
|
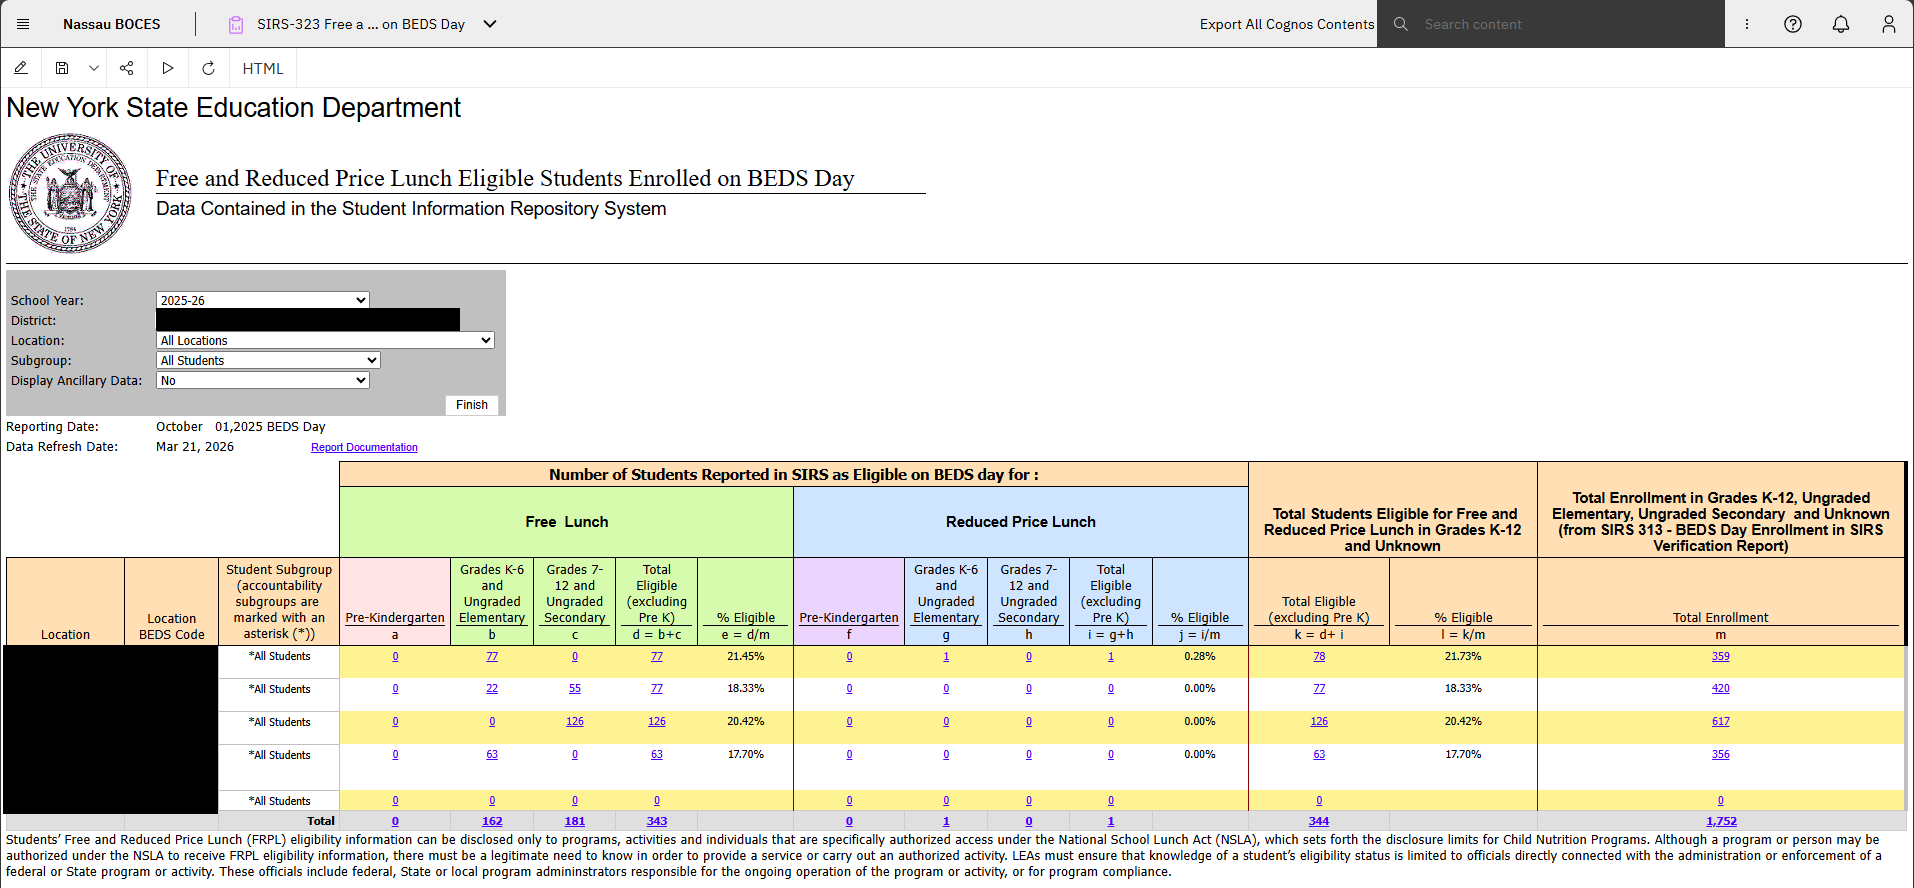
SIRS-323 Free and Reduced Price Lunch Eligible Students Enrolled on BEDS Day
|
Counts of students who were enrolled in the school on BEDS day with their free and reduced price lunch eligibility on BEDS day
|
|
|
|
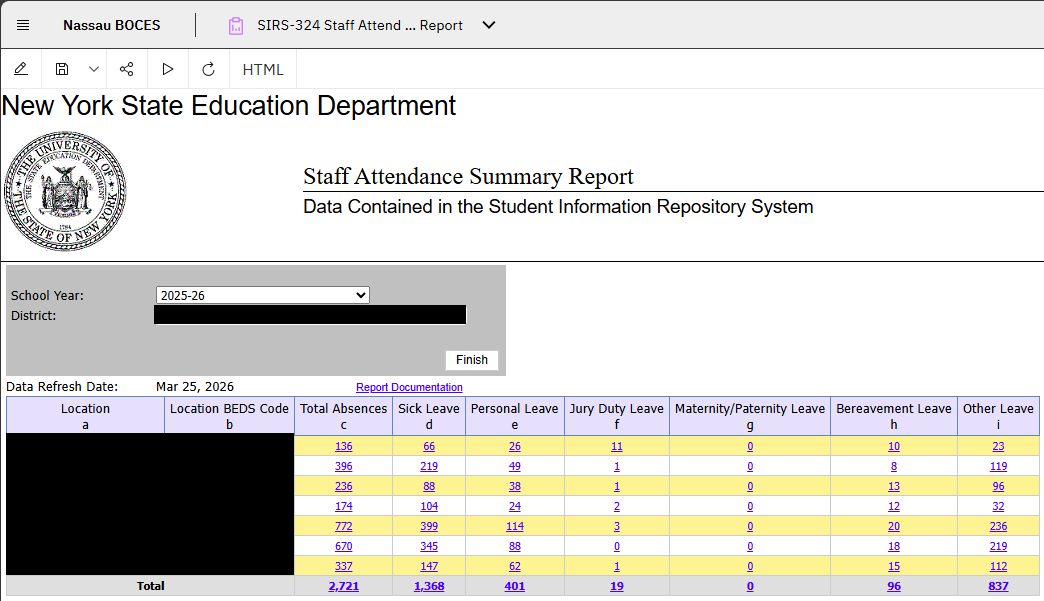
SIRS-324 Staff Attendance Summary Report
|
Review counts of staff attendance data
|
|
|
|
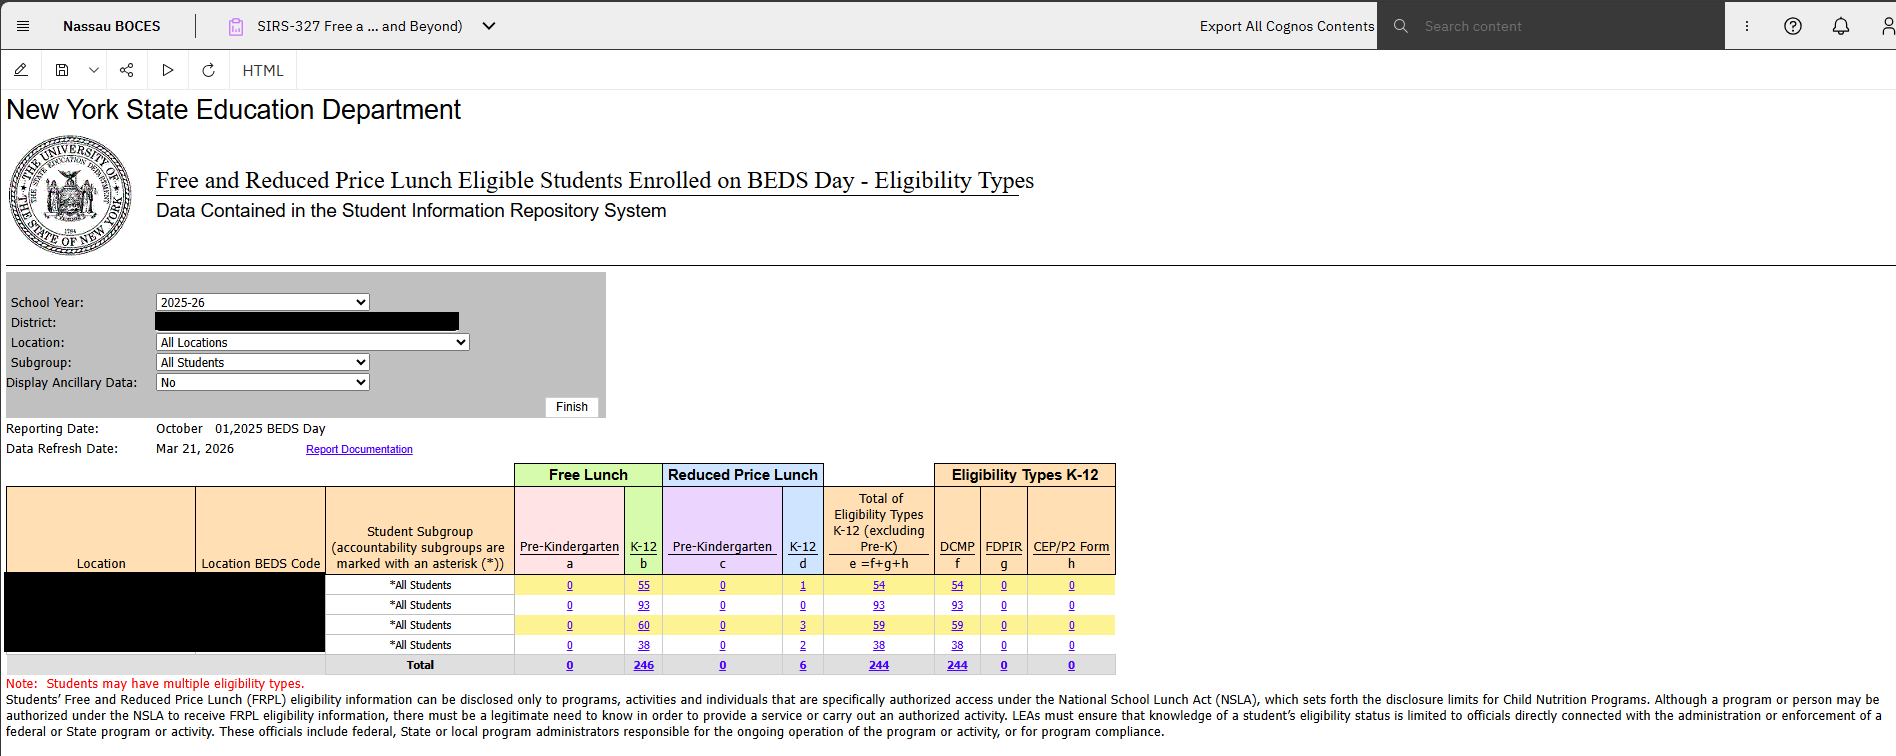
SIRS-327 Free and Reduced Price Lunch Eligible Students Enrolled on BEDS Day – Eligibility Types (2026 and beyond)
|
Review free or reduced price lunch (FRPL) counts by eligibility type to be used for state and program aid calculations
|
|
|
|
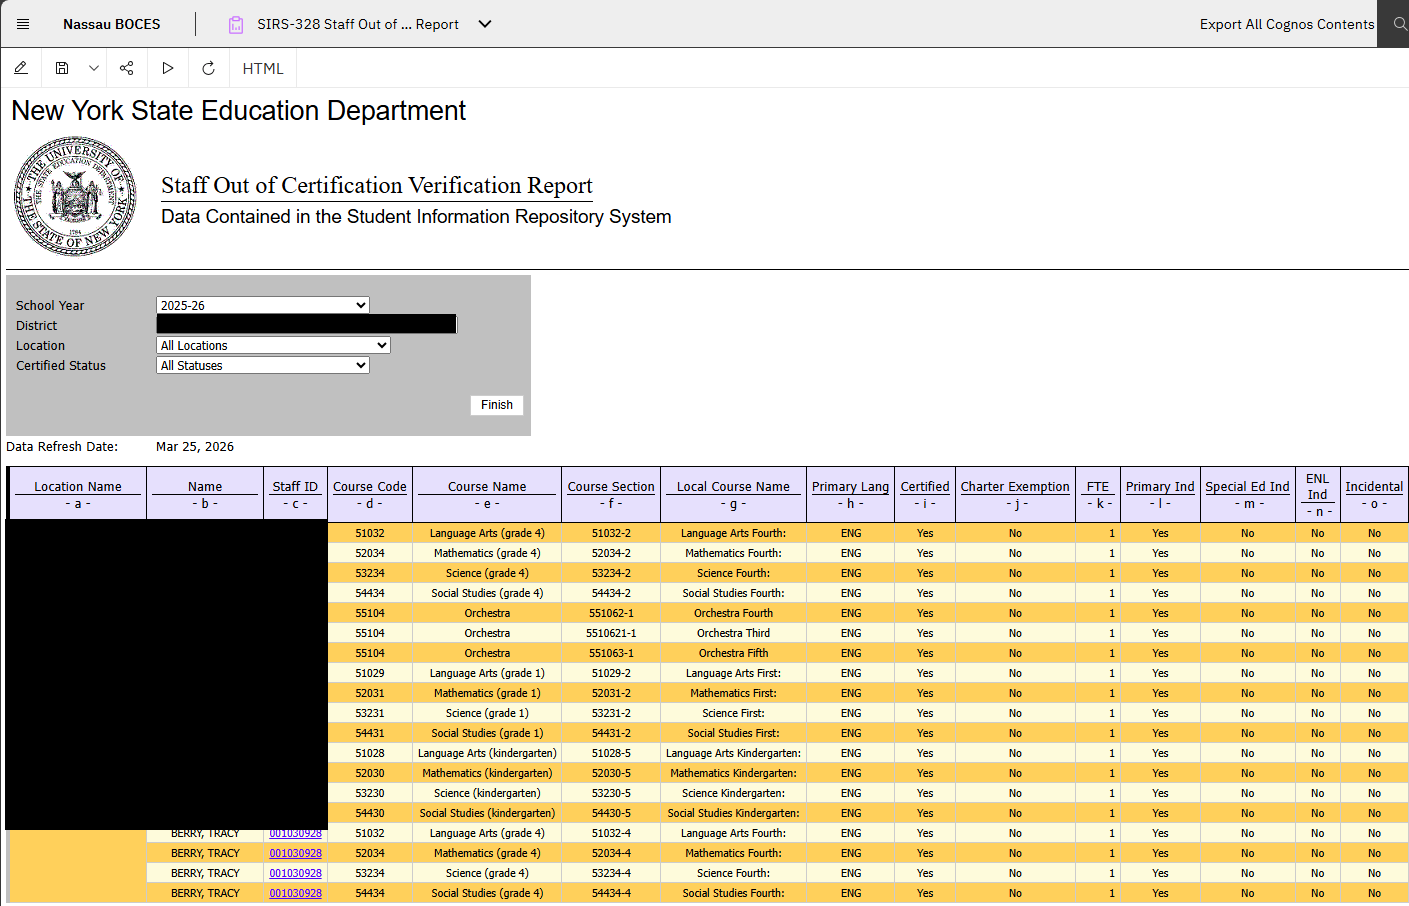
SIRS-328 Staff Out of Certification Report
|
View courses taught by all staff members and associated certification information.
|
|
|
|
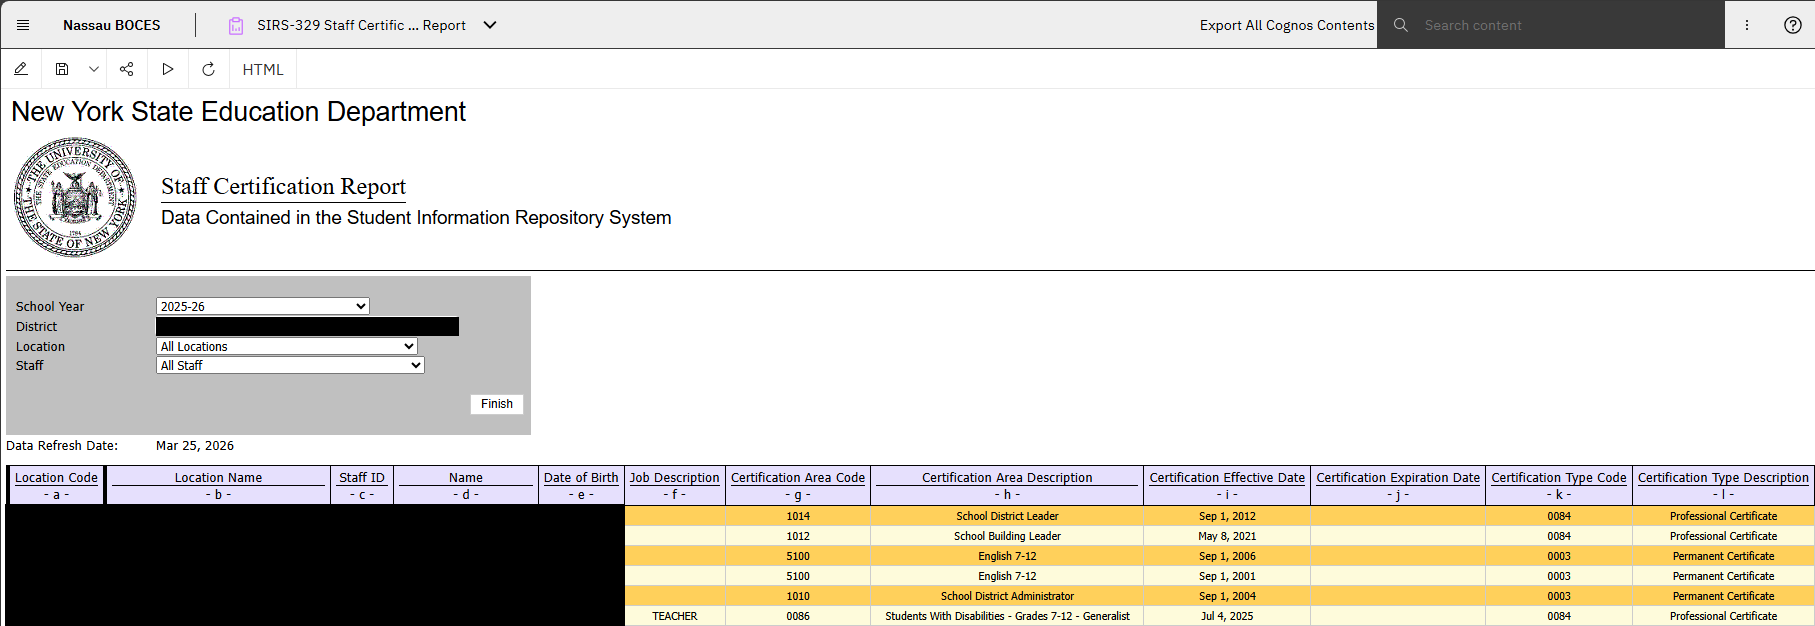
SIRS-329 Staff Certification Report
|
View staff members and the certifications that they hold.
|
|
|
|
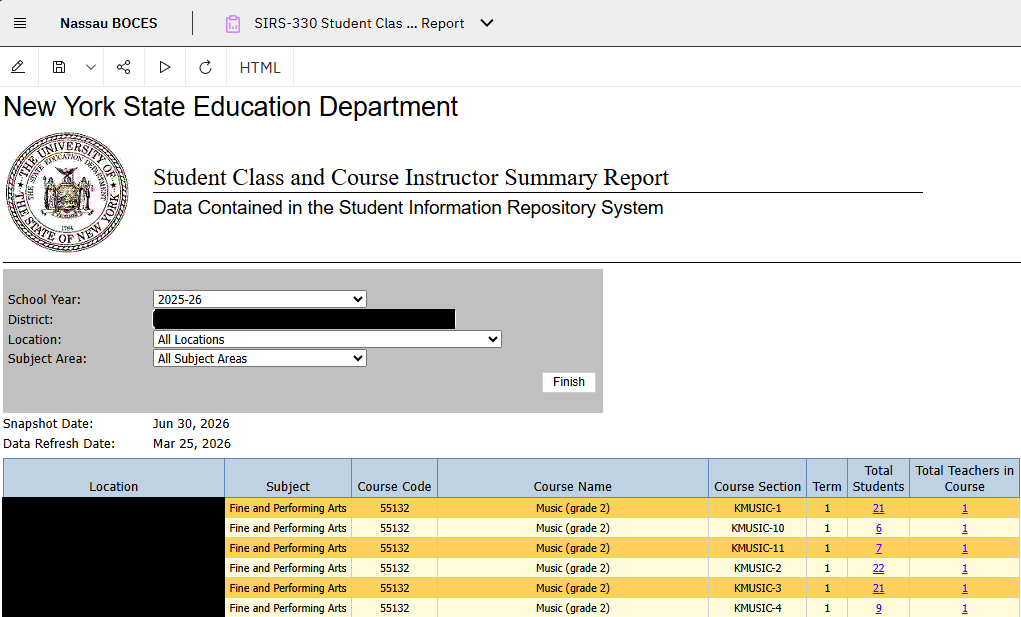
SIRS-330 Student Class/Course Instructor Summary Report
|
This report combines data submitted in the Student Class Entry Exit and Course Instructor Assignment, allowing for drill-throughs of both teacher and student details.
|
|
|
|
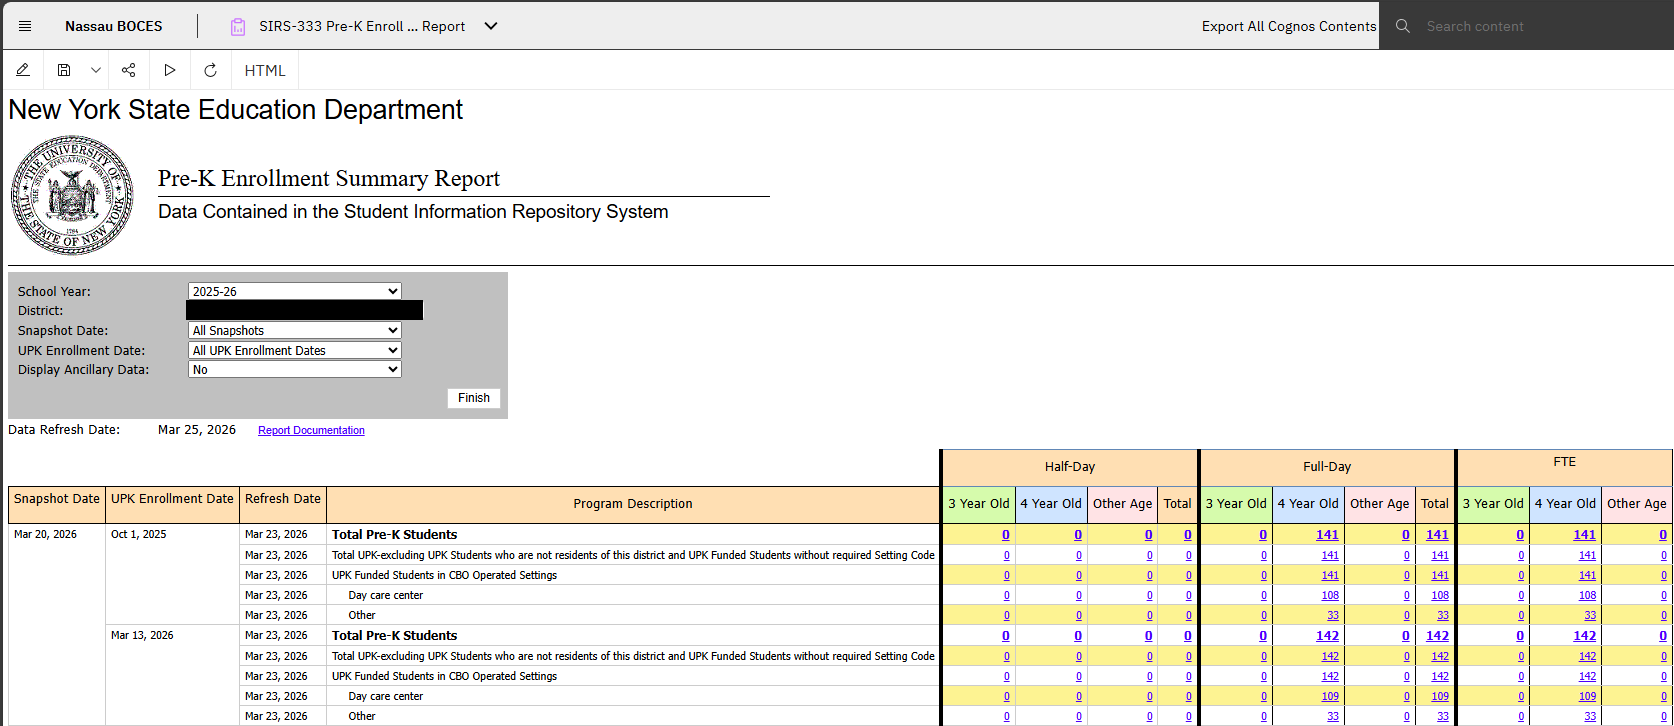
SIRS-333 Annual Pre-K Enrollment Summary Report
|
Pre-Kindergarten (Pre-K) counts used to determine Universal Pre-K (UPK) grant allocations
|
|
|
|
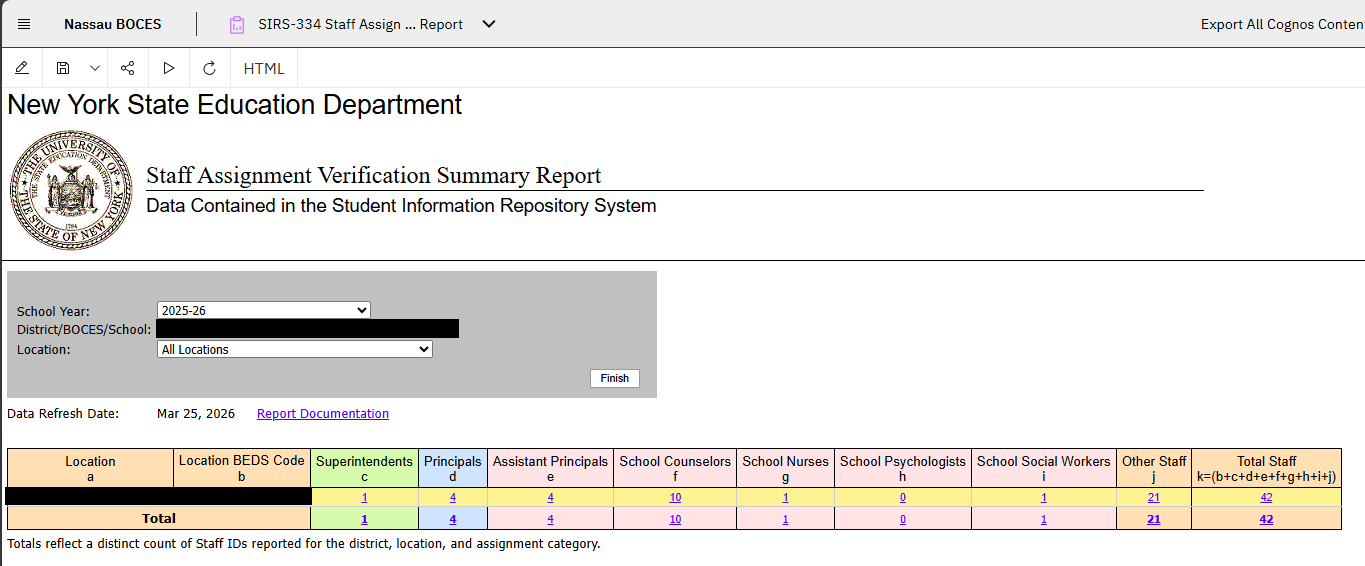
SIRS-334 Staff Assignment Verification Report
|
Verify data submitted through the Staff Assignment template
|
|
|
|
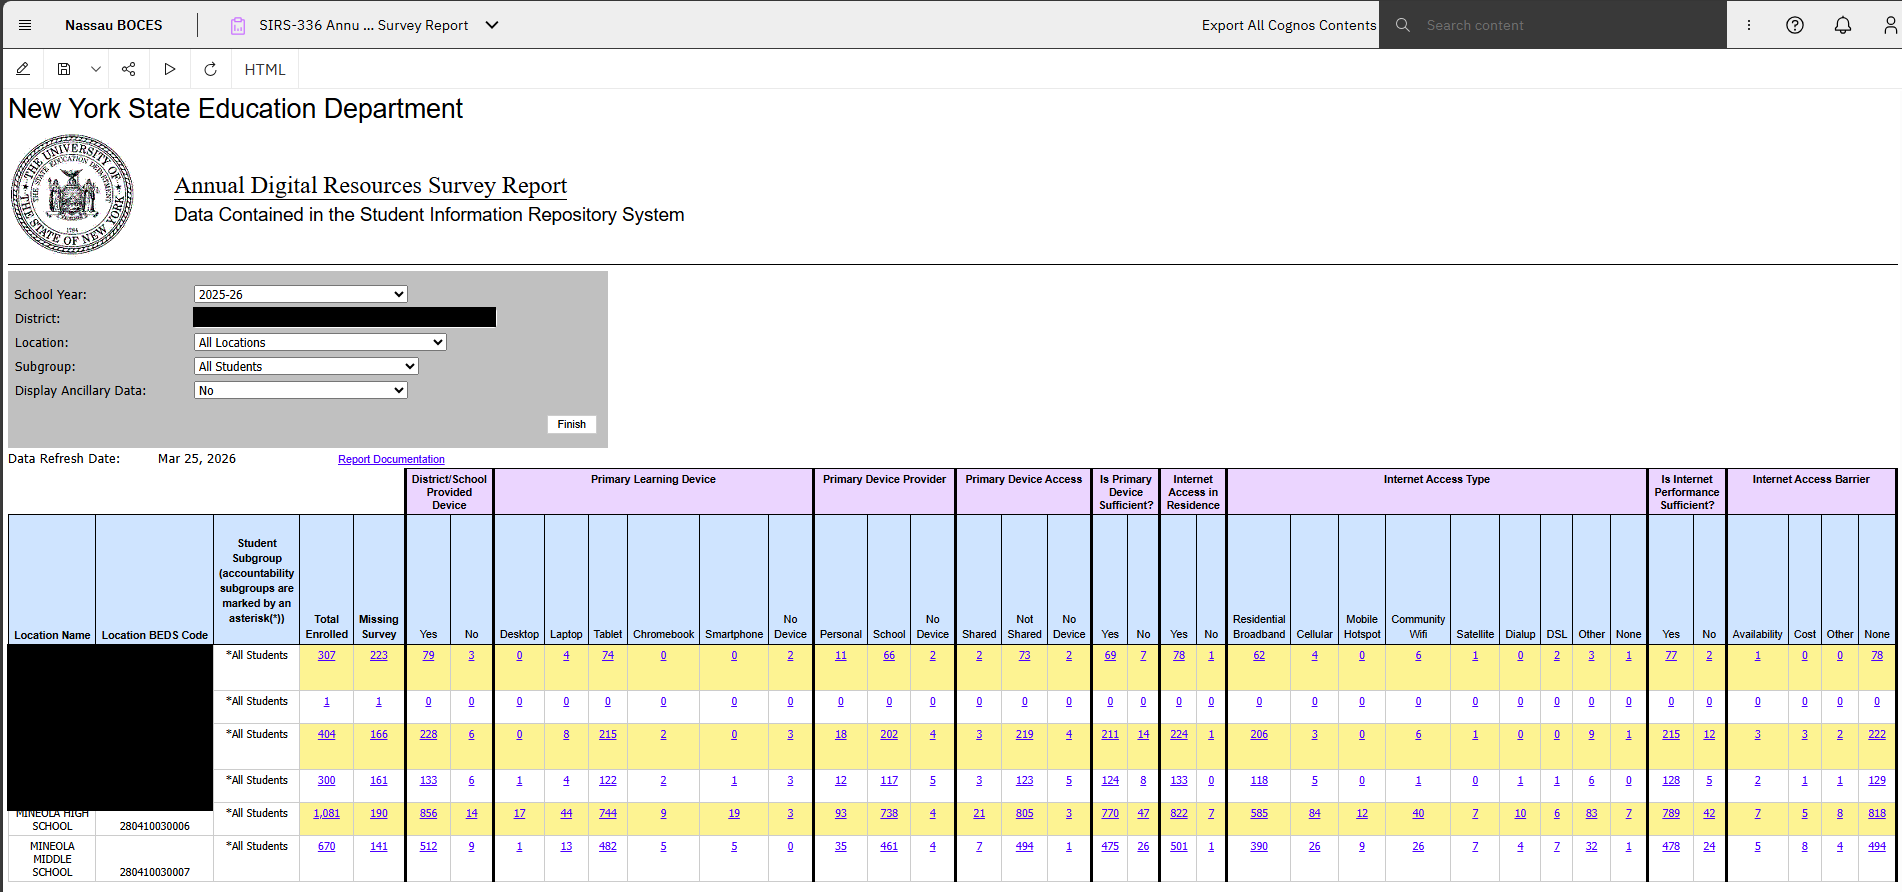
SIRS-336 Annual Digital Resources Survey Report
|
Review survey answers for accuracy or analysis
|
|
|
|
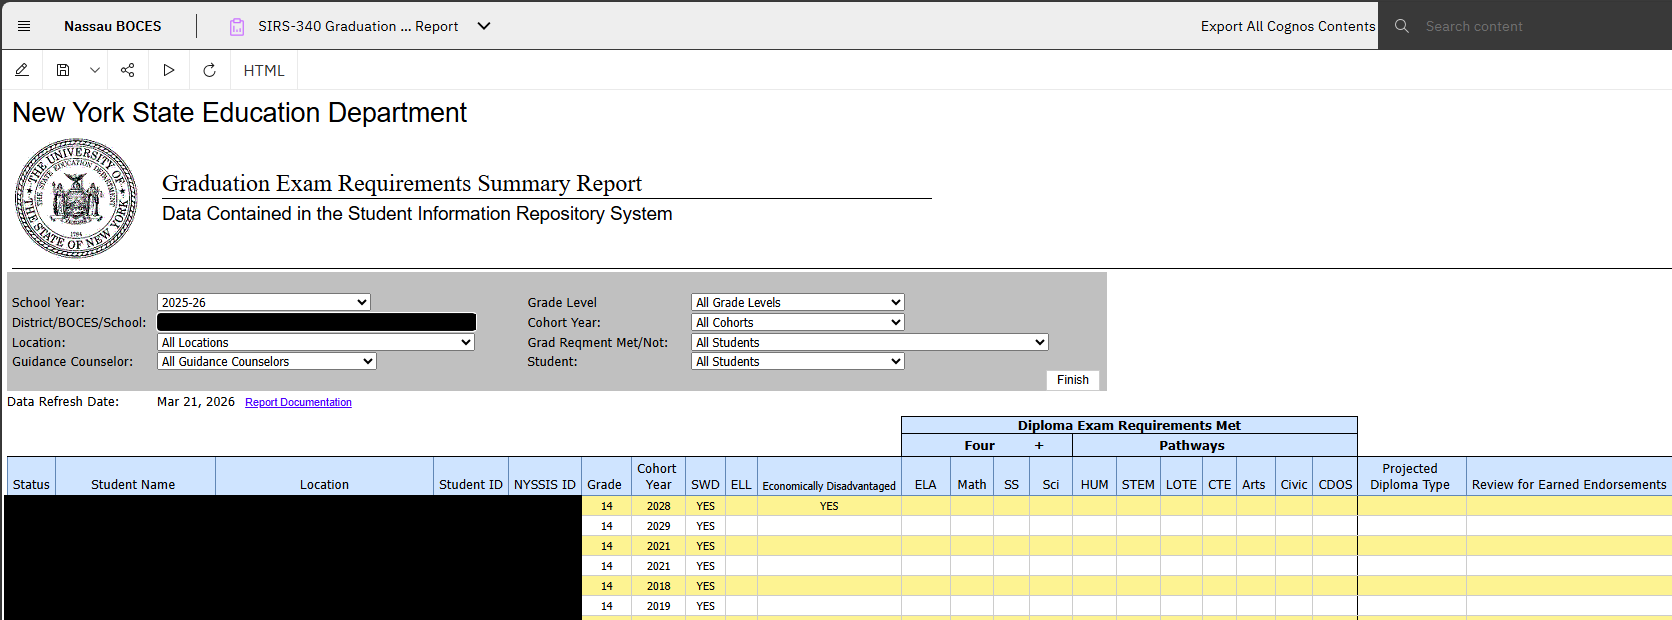
SIRS-340 Graduation Exam Requirements Summary Report
|
Review all students by grade or cohort to ensure graduation requirements are met or find those that qualify for an appeal - by subject only.
|
|
|
|
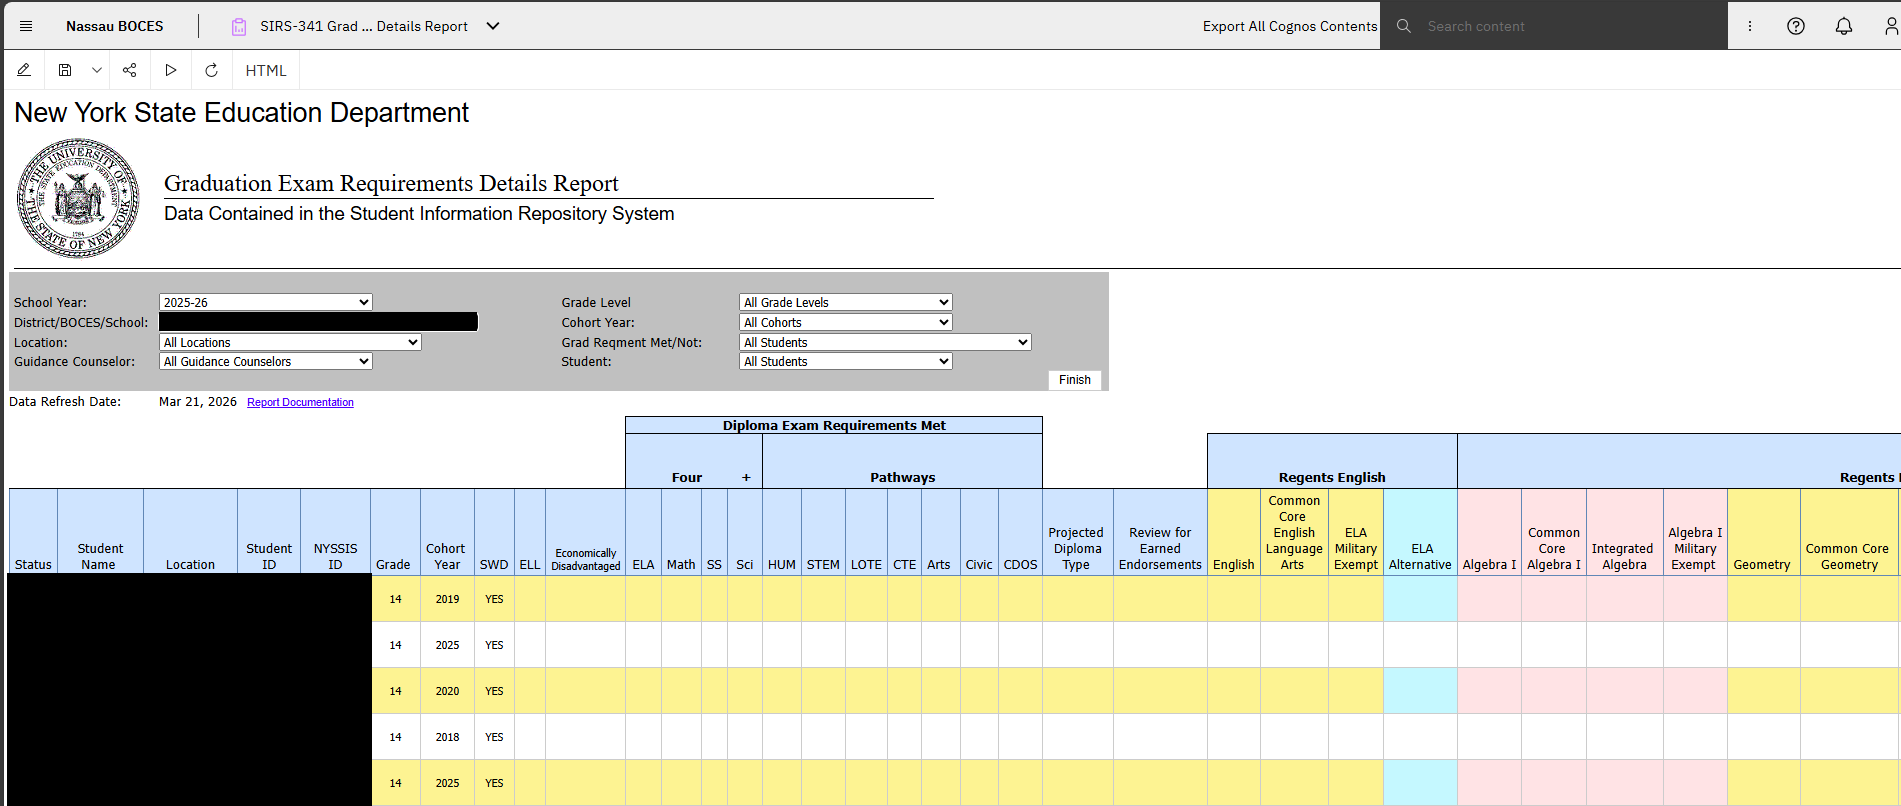
SIRS-341 Graduation Exam Requirements Detail Report
|
Review all students by grade or cohort to ensure graduation requirements are met or find those that qualify for an appeal - individual test information included.
|
|
|
|
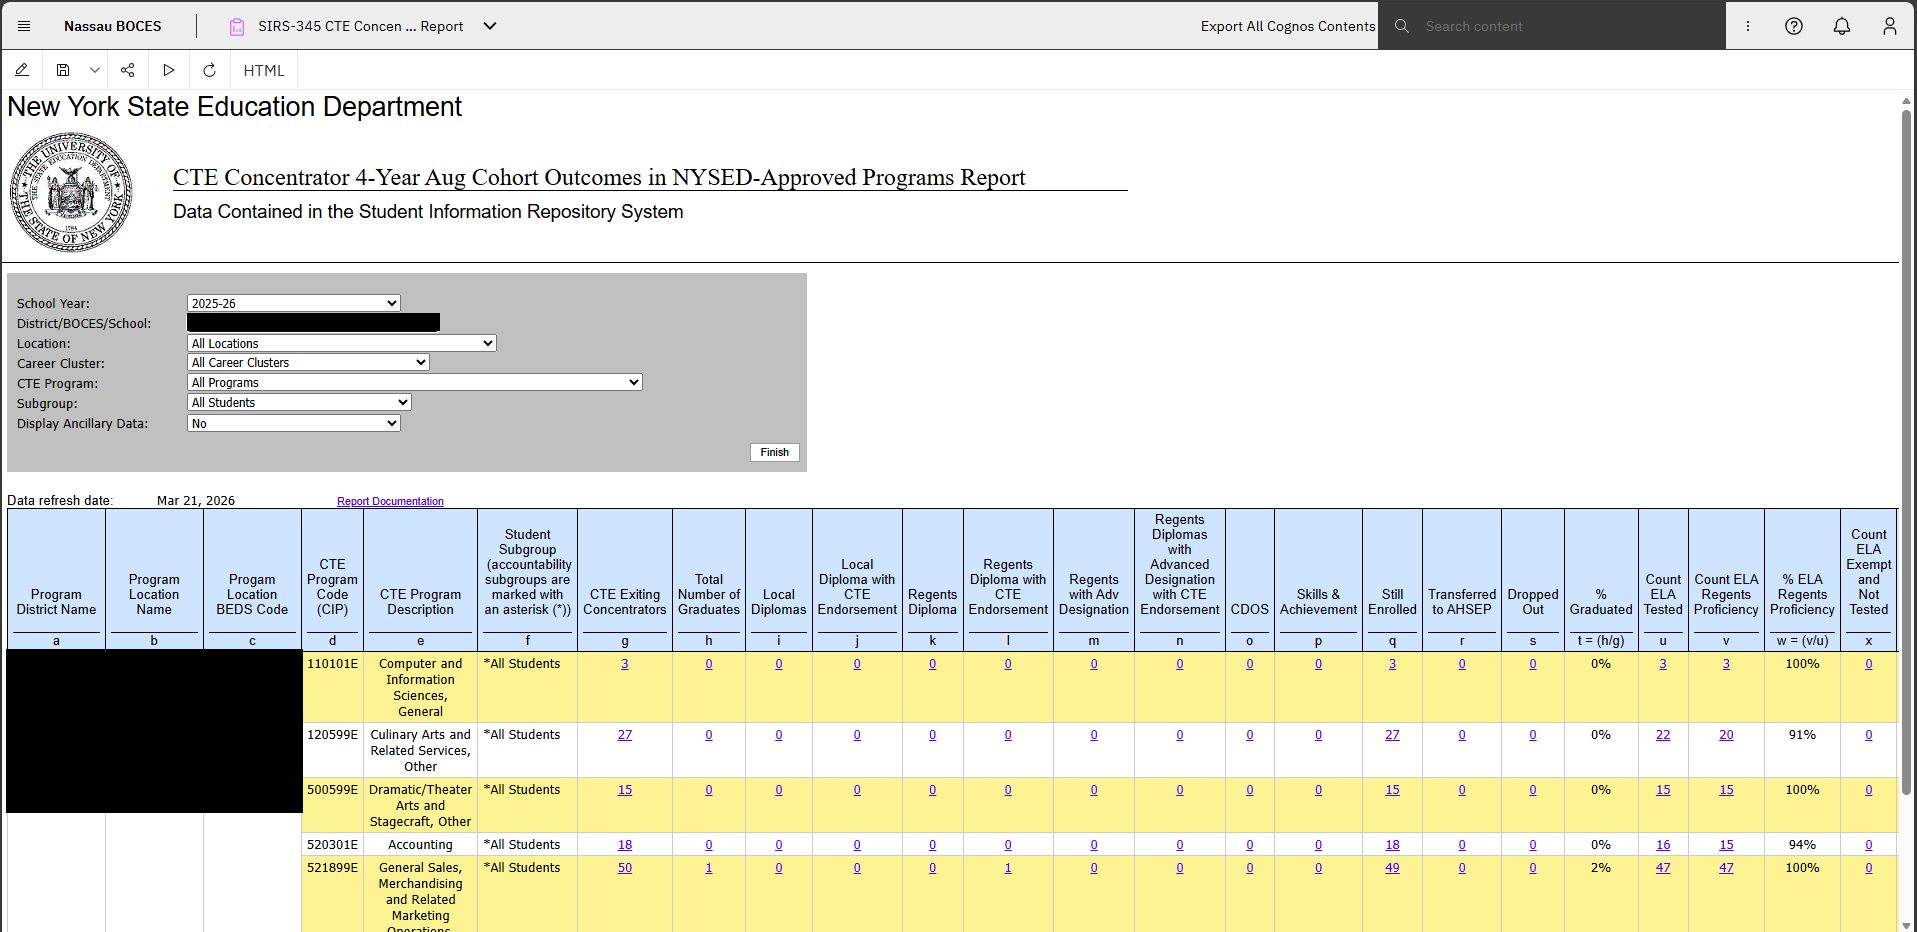
SIRS-345 CTE Concentrator 4-Year Aug Cohort Outcomes in NYSED-Approved Programs Report
|
Review outcome and performance data on NYSED-approved CTE programs
|
|
|
|
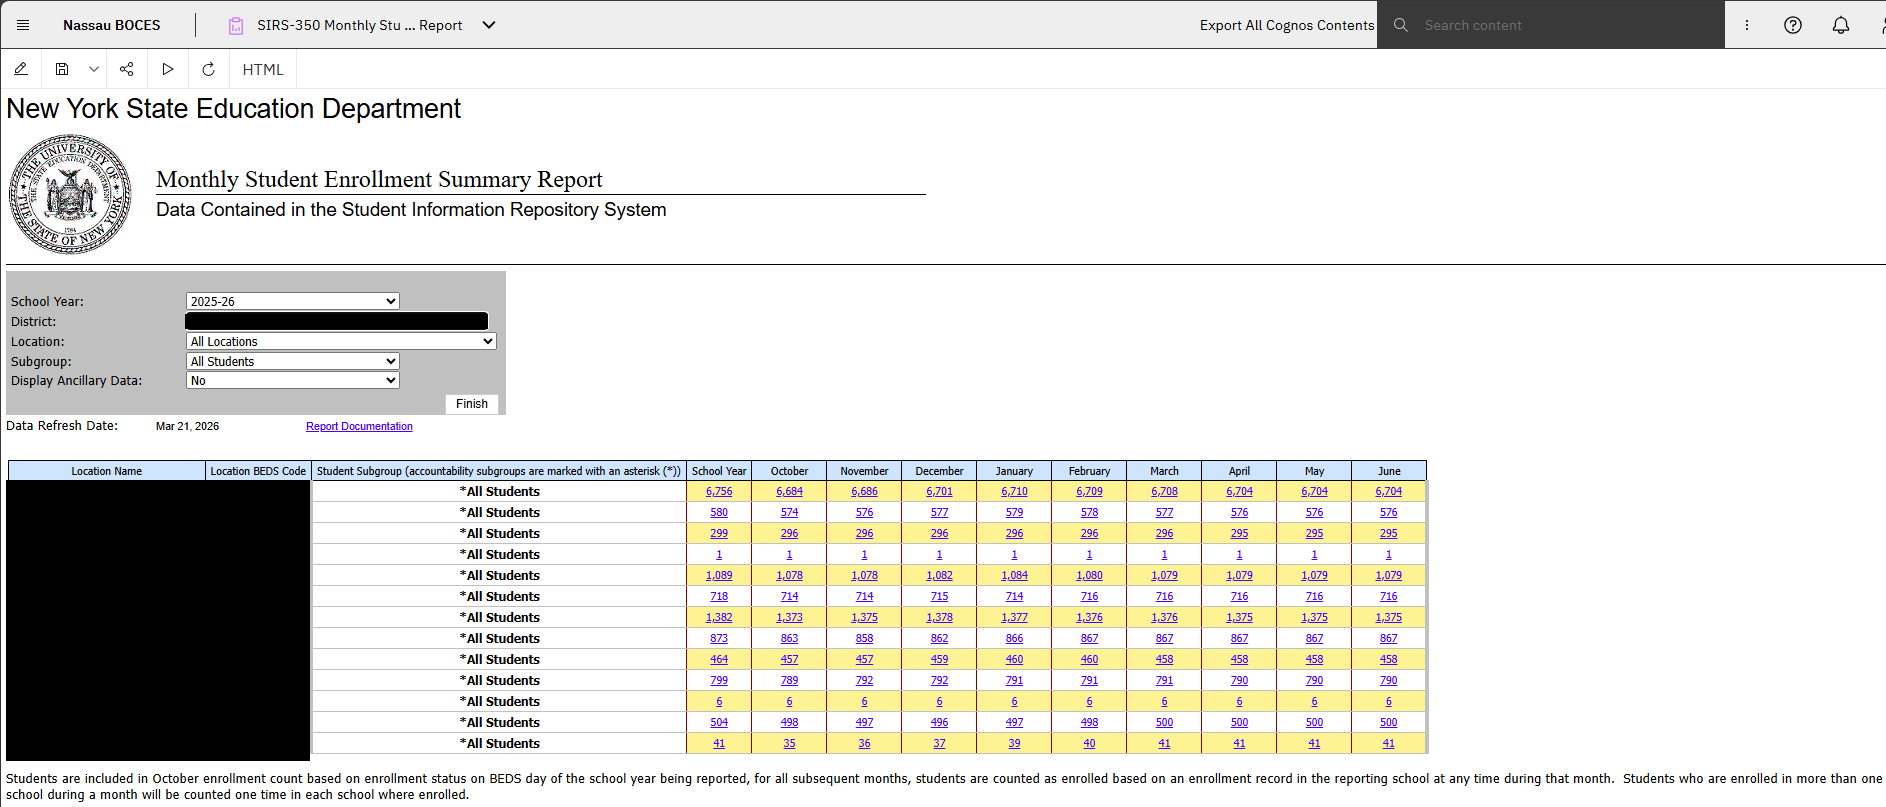
SIRS-350 Monthly Student Enrollment Summary Report
|
BEDS day and monthly student enrollment counts by school
|
|
|
|
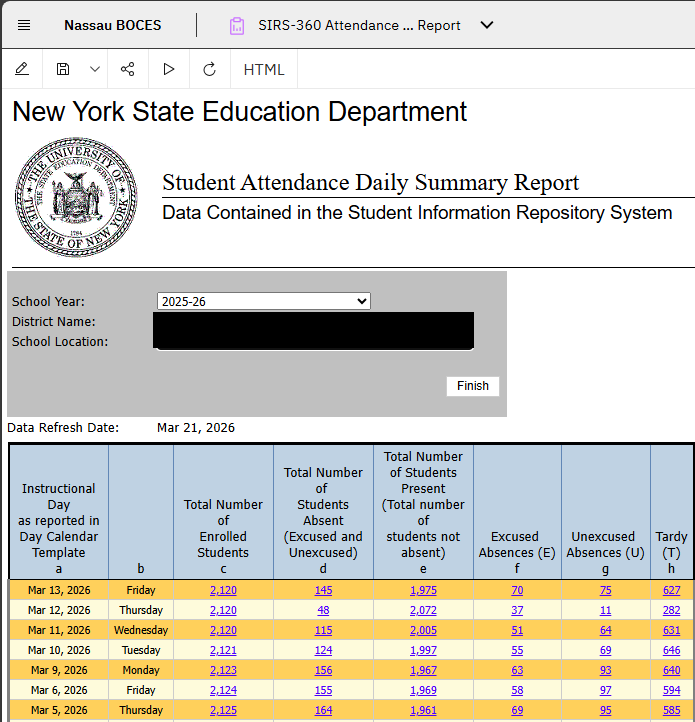
SIRS-360 Attendance Absence Summary Report
|
Verification reports showing year-to-date chronic absenteeism (CA) data are available through L2RPT for public schools, districts, charters, and BOCES that continue to report daily attendance and calendar information in SIRS per local policy. Districts should use these reports, along with internal coordination between data coordinators and attendance officials, to create a verification process that meets their specific needs.
|
|
|
|
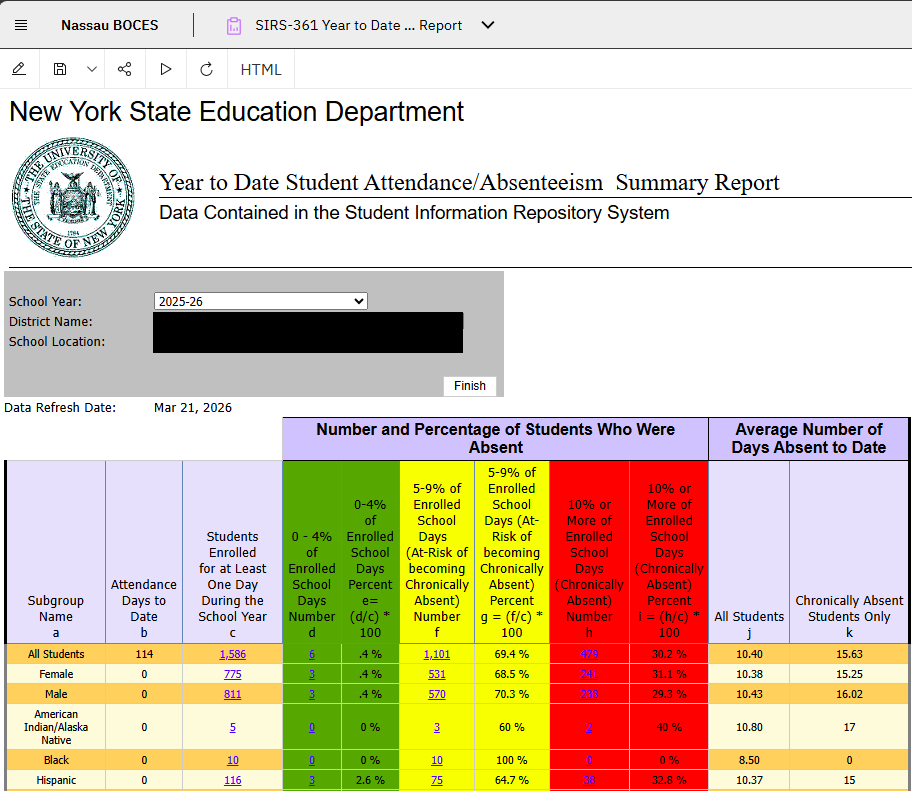
SIRS-361 Year to Date Attendance/Absenteeism Summary Report
|
Verification reports showing year-to-date chronic absenteeism (CA) data are available through L2RPT for public schools, districts, charters, and BOCES that continue to report daily attendance and calendar information in SIRS per local policy. Districts should use these reports, along with internal coordination between data coordinators and attendance officials, to create a verification process that meets their specific needs.
|
|
|
|
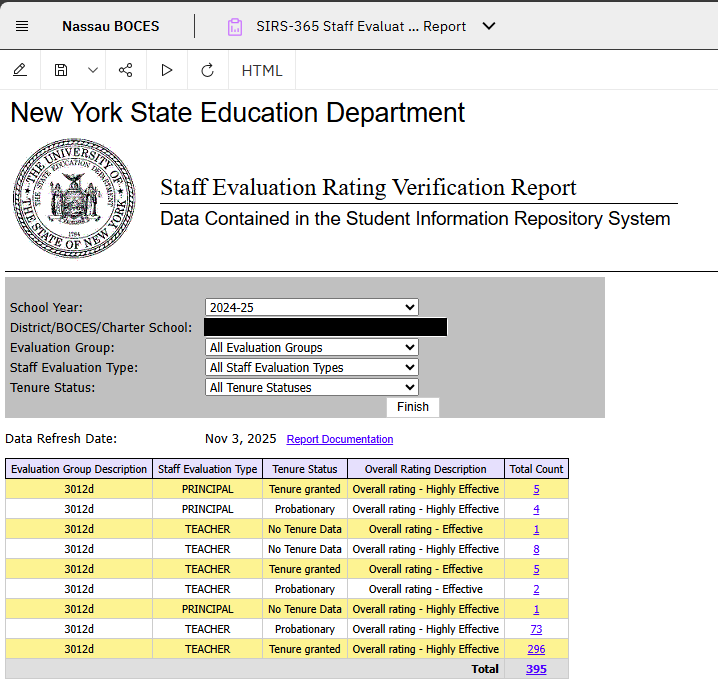
SIRS-365 Staff Evaluation Rating Verification Report
|
Review Staff Evaluation data for 3012-d and 3012-e evaluation criteria.
|
|
|
|
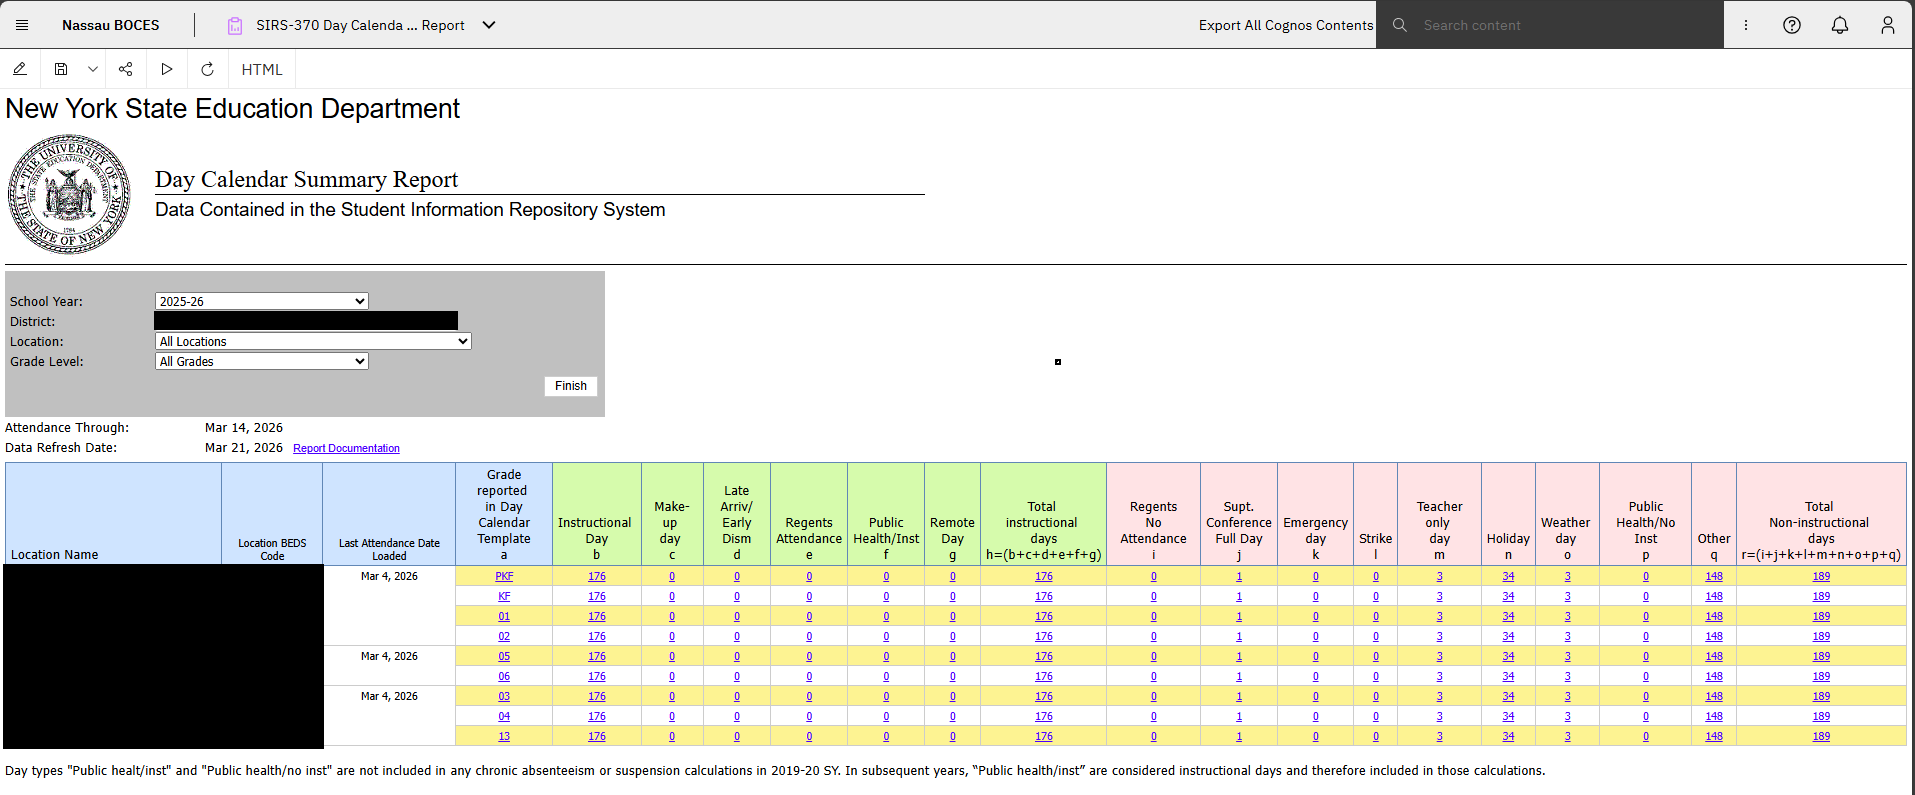
SIRS-370 Day Calendar Summary Report
|
Verification reports showing year-to-date chronic absenteeism (CA) data are available through L2RPT for public schools, districts, charters, and BOCES that continue to report daily attendance and calendar information in SIRS per local policy. Districts should use these reports, along with internal coordination between data coordinators and attendance officials, to create a verification process that meets their specific needs.
|
|
|
|
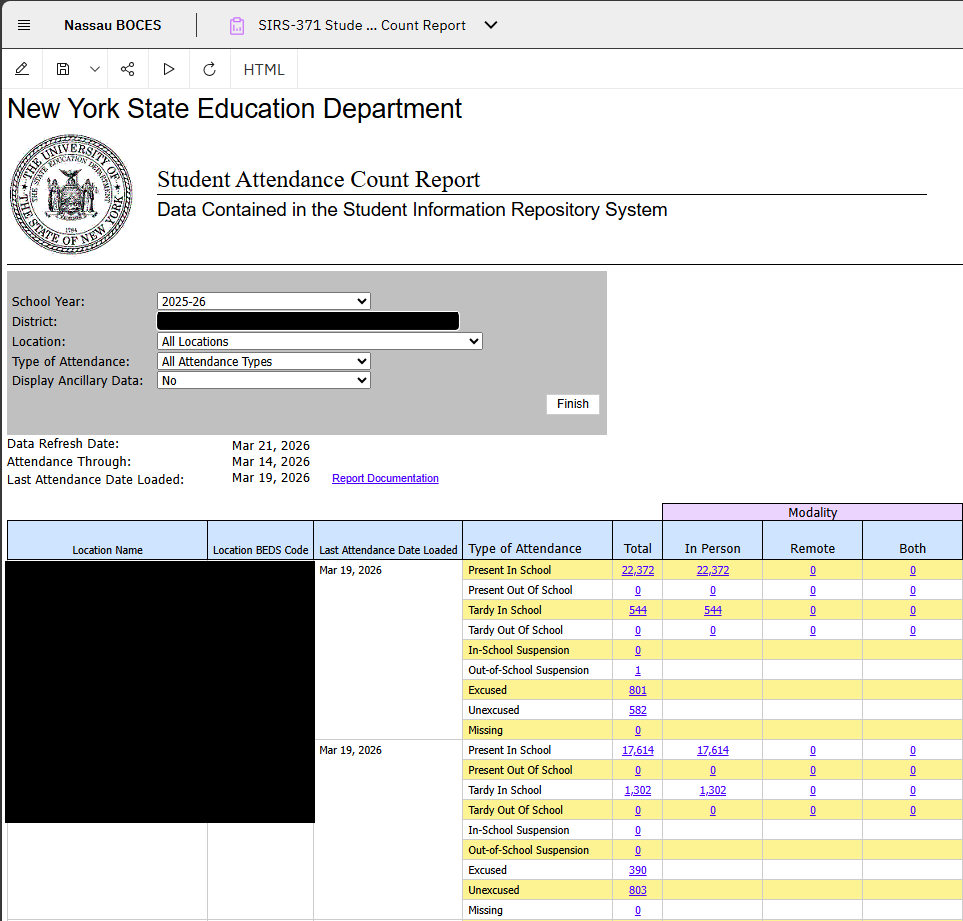
SIRS-371 Student Attendance Count Report
|
The SIRS-371, SIRS-375, and SIRS-376 reports give LEAs detailed student-attendance data: SIRS-371/375 show individual attendance (with SIRS-375 also summarizing each district location), while SIRS-376 tracks attendance trends by subgroup and period without student-level detail. Starting in 2020-21, LEAs must report daily attendance and instructional modality codes for every student on instructional days, using specific “present” codes; missing records are counted as absent.
|
|
|
|
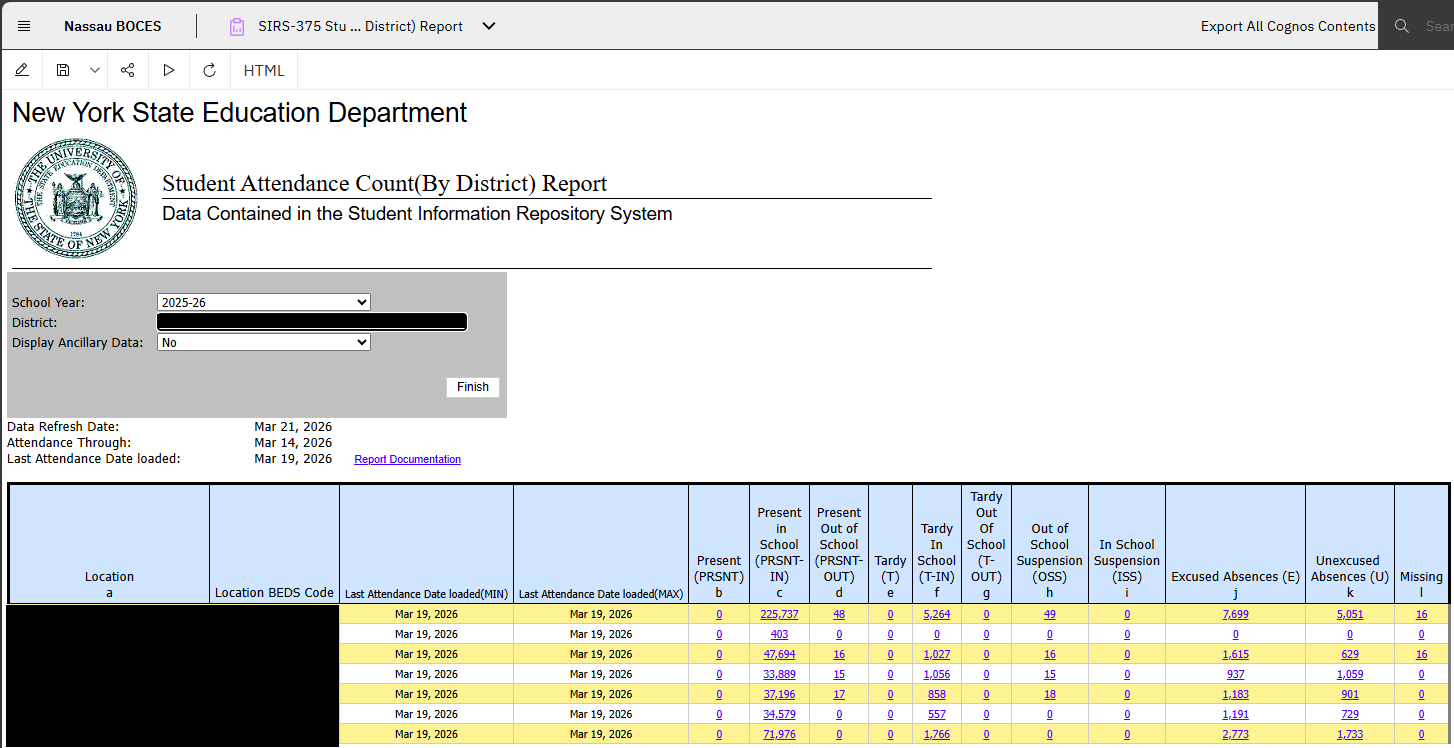
SIRS-375 Student Attendance Count (by District)
|
The SIRS-371, SIRS-375, and SIRS-376 reports give LEAs detailed student-attendance data: SIRS-371/375 show individual attendance (with SIRS-375 also summarizing each district location), while SIRS-376 tracks attendance trends by subgroup and period without student-level detail. Starting in 2020-21, LEAs must report daily attendance and instructional modality codes for every student on instructional days, using specific “present” codes; missing records are counted as absent.
|
|
|
|
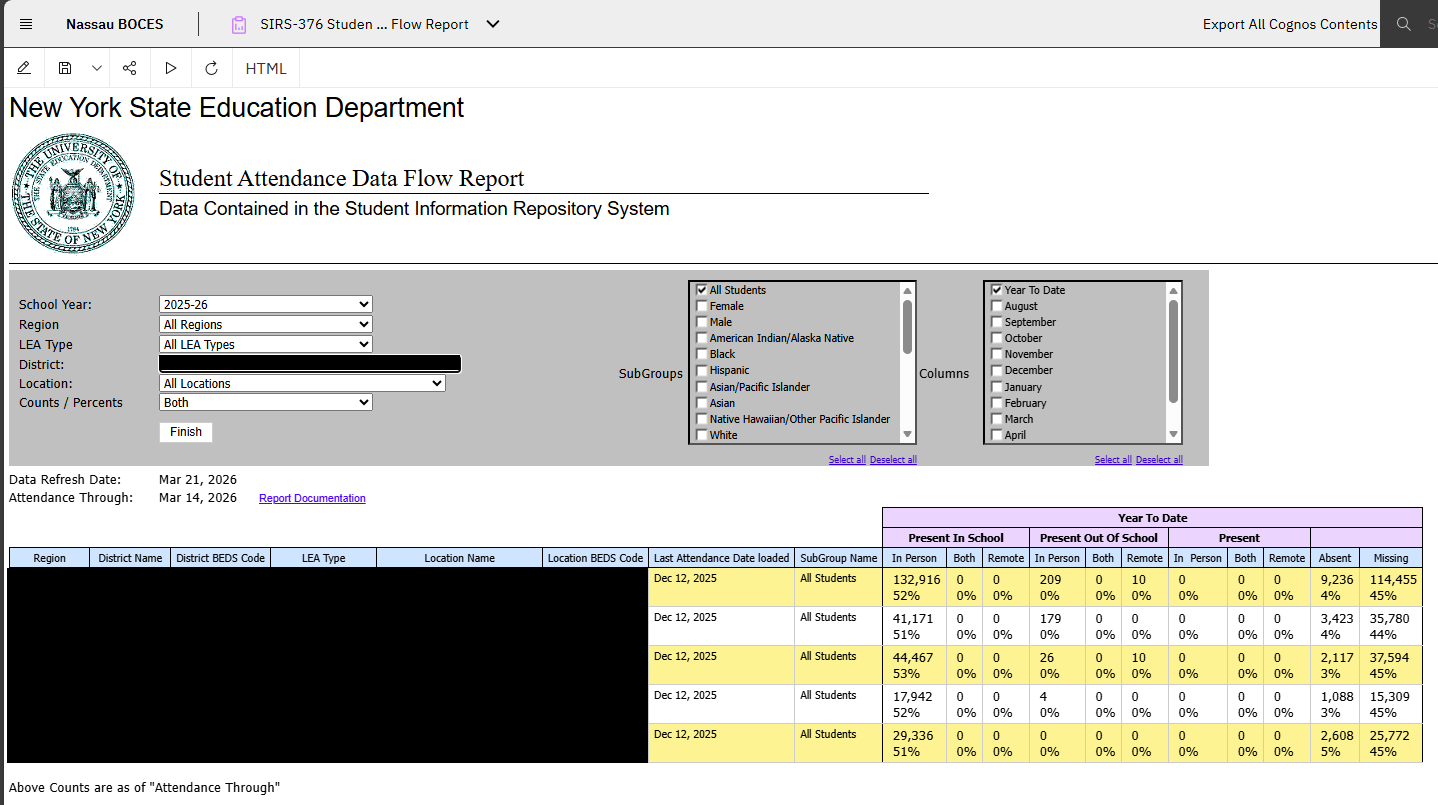
SIRS-376 Student Attendance Data Flow Report
|
The SIRS-371, SIRS-375, and SIRS-376 reports give LEAs detailed student-attendance data: SIRS-371/375 show individual attendance (with SIRS-375 also summarizing each district location), while SIRS-376 tracks attendance trends by subgroup and period without student-level detail. Starting in 2020-21, LEAs must report daily attendance and instructional modality codes for every student on instructional days, using specific “present” codes; missing records are counted as absent.
|
|
|
|
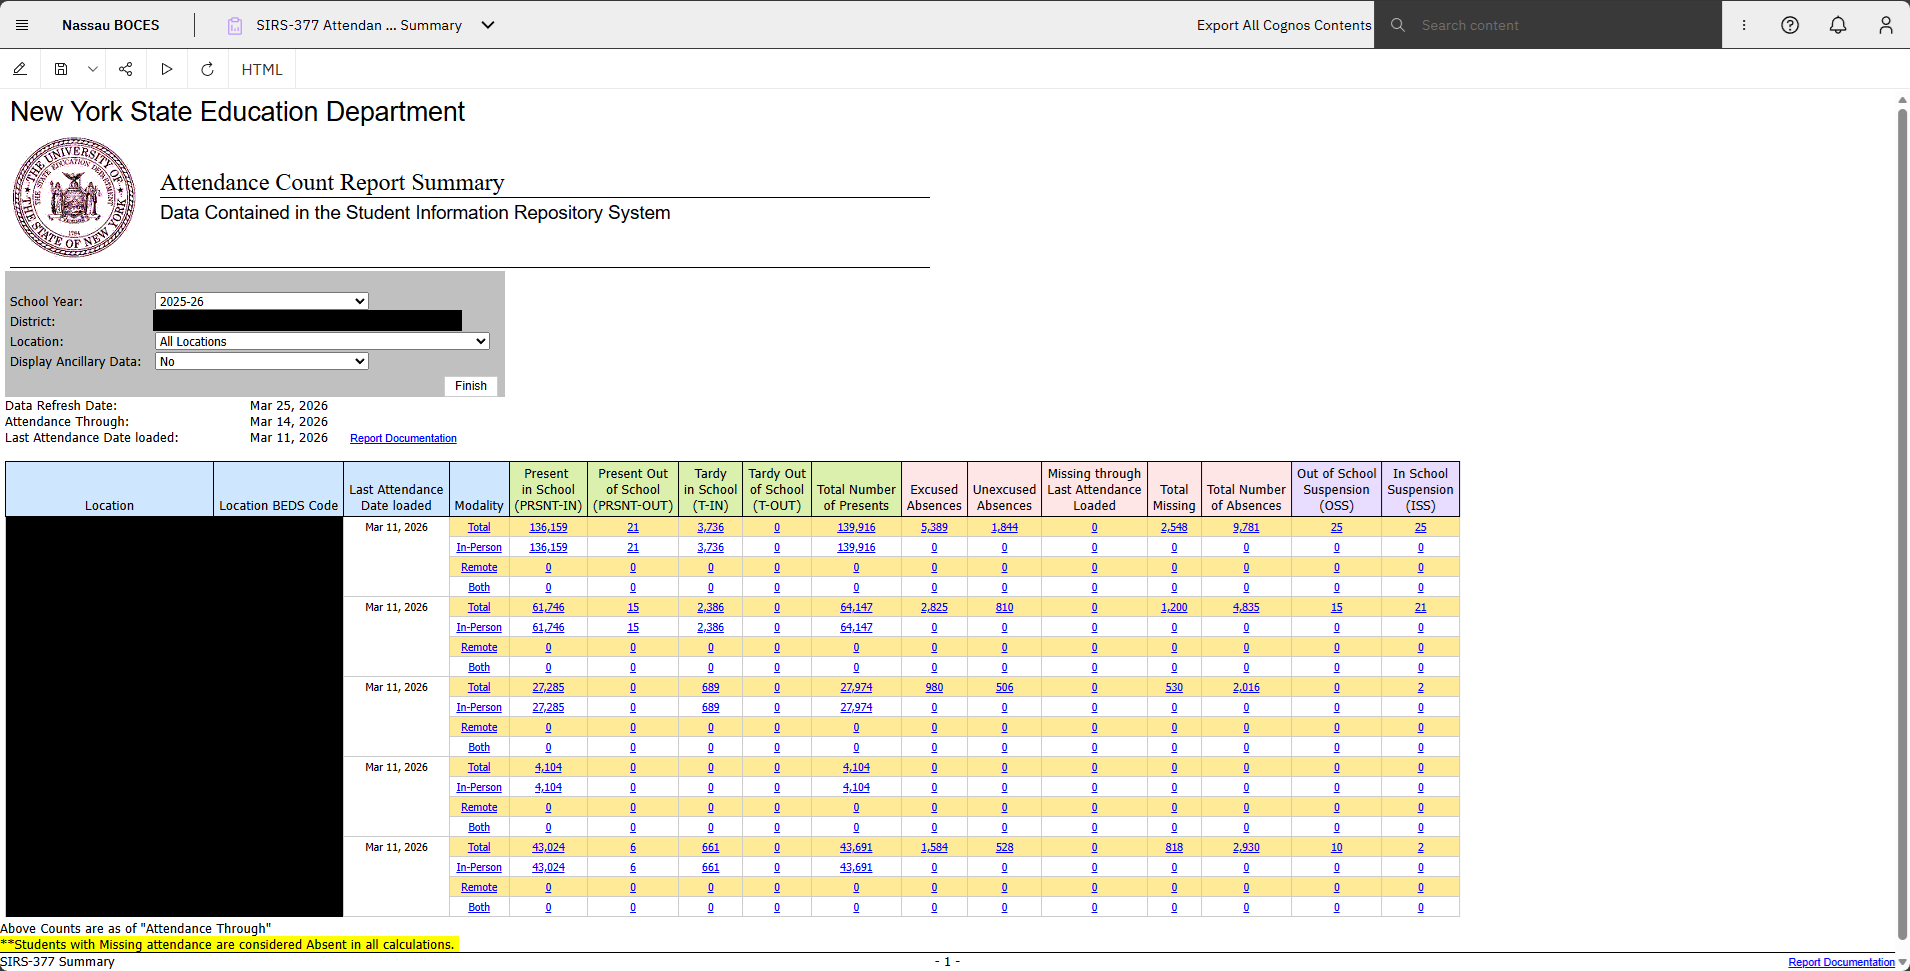
SIRS-377 Attendance Count Report Summary
|
Counts of attendance codes and groups by location through last attendance load.
|
|
|
|
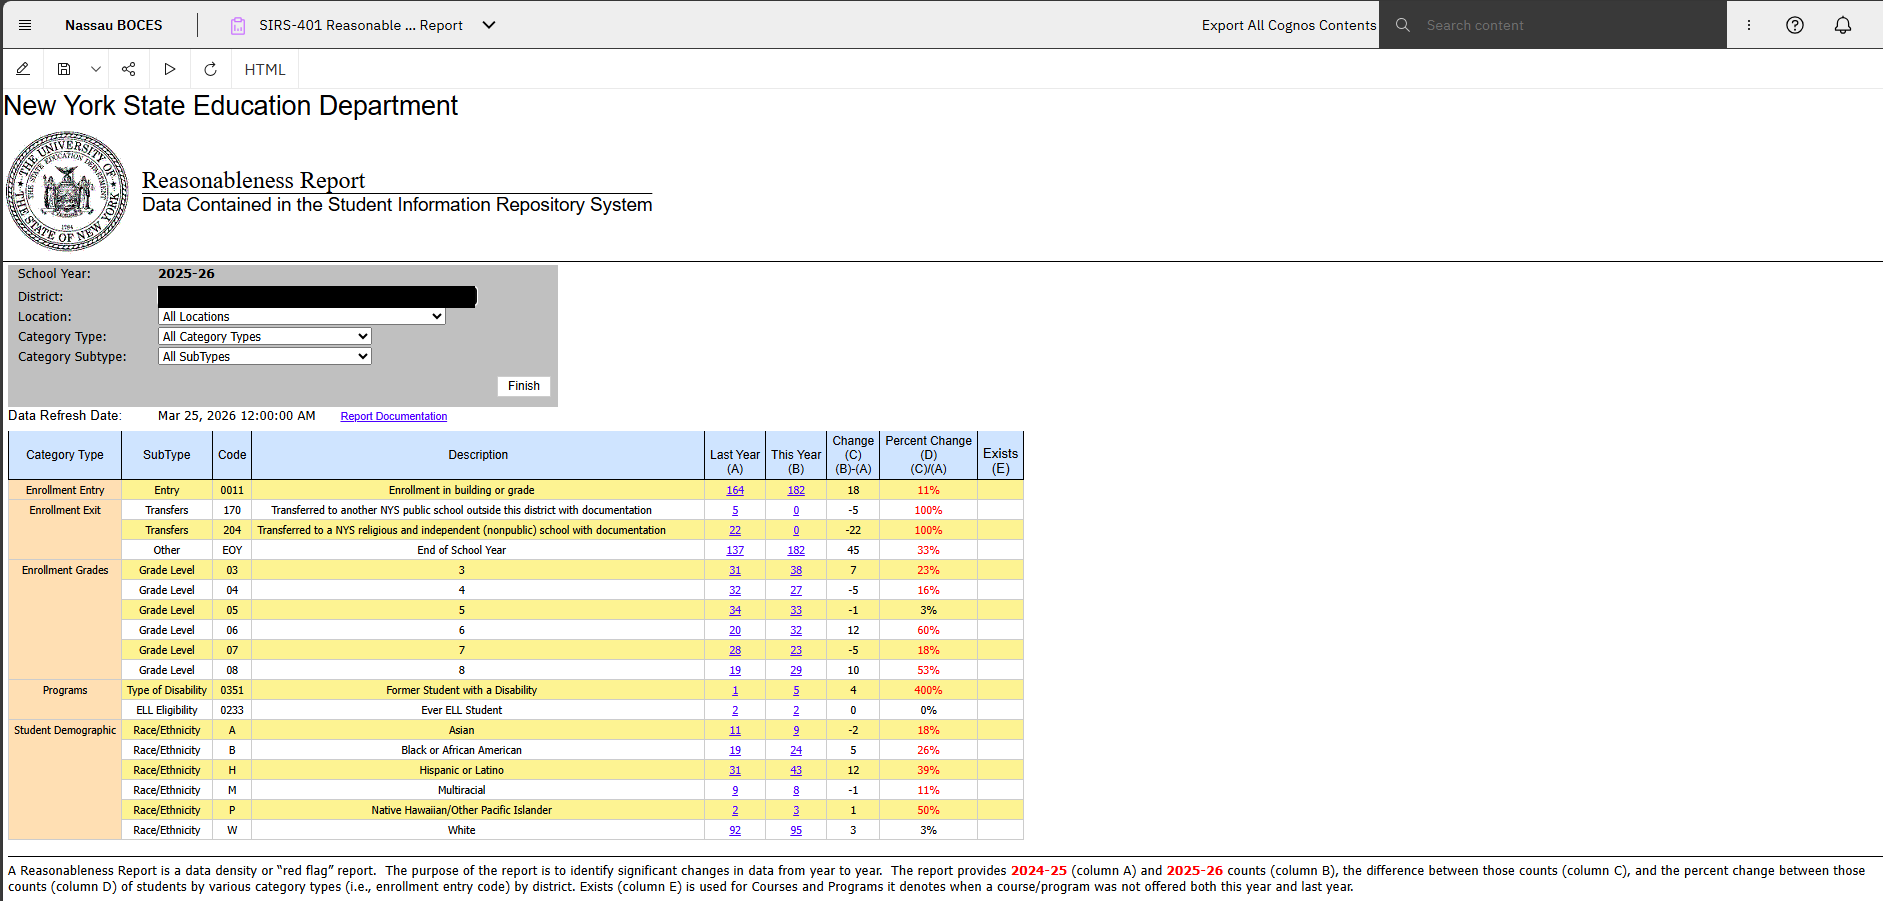
SIRS-401 Reasonableness Report
|
Compares record counts for two years to help users identify reporting errors
|
|
|
|
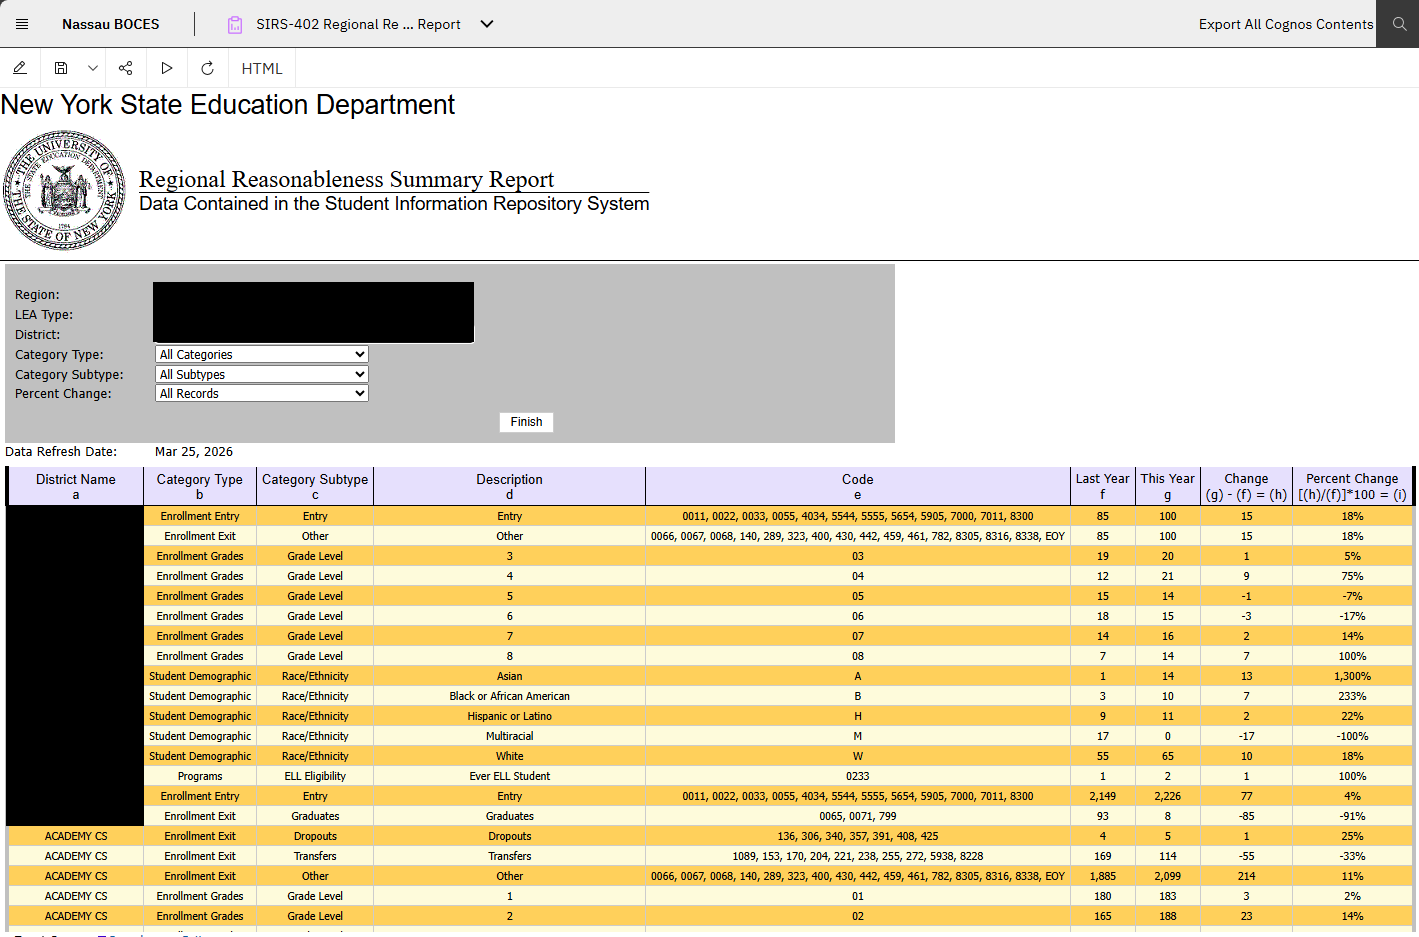
SIRS-402 Regional Reasonableness Report
|
Reasonableness report with the capability to view all categories in one list.
|
|
|
|
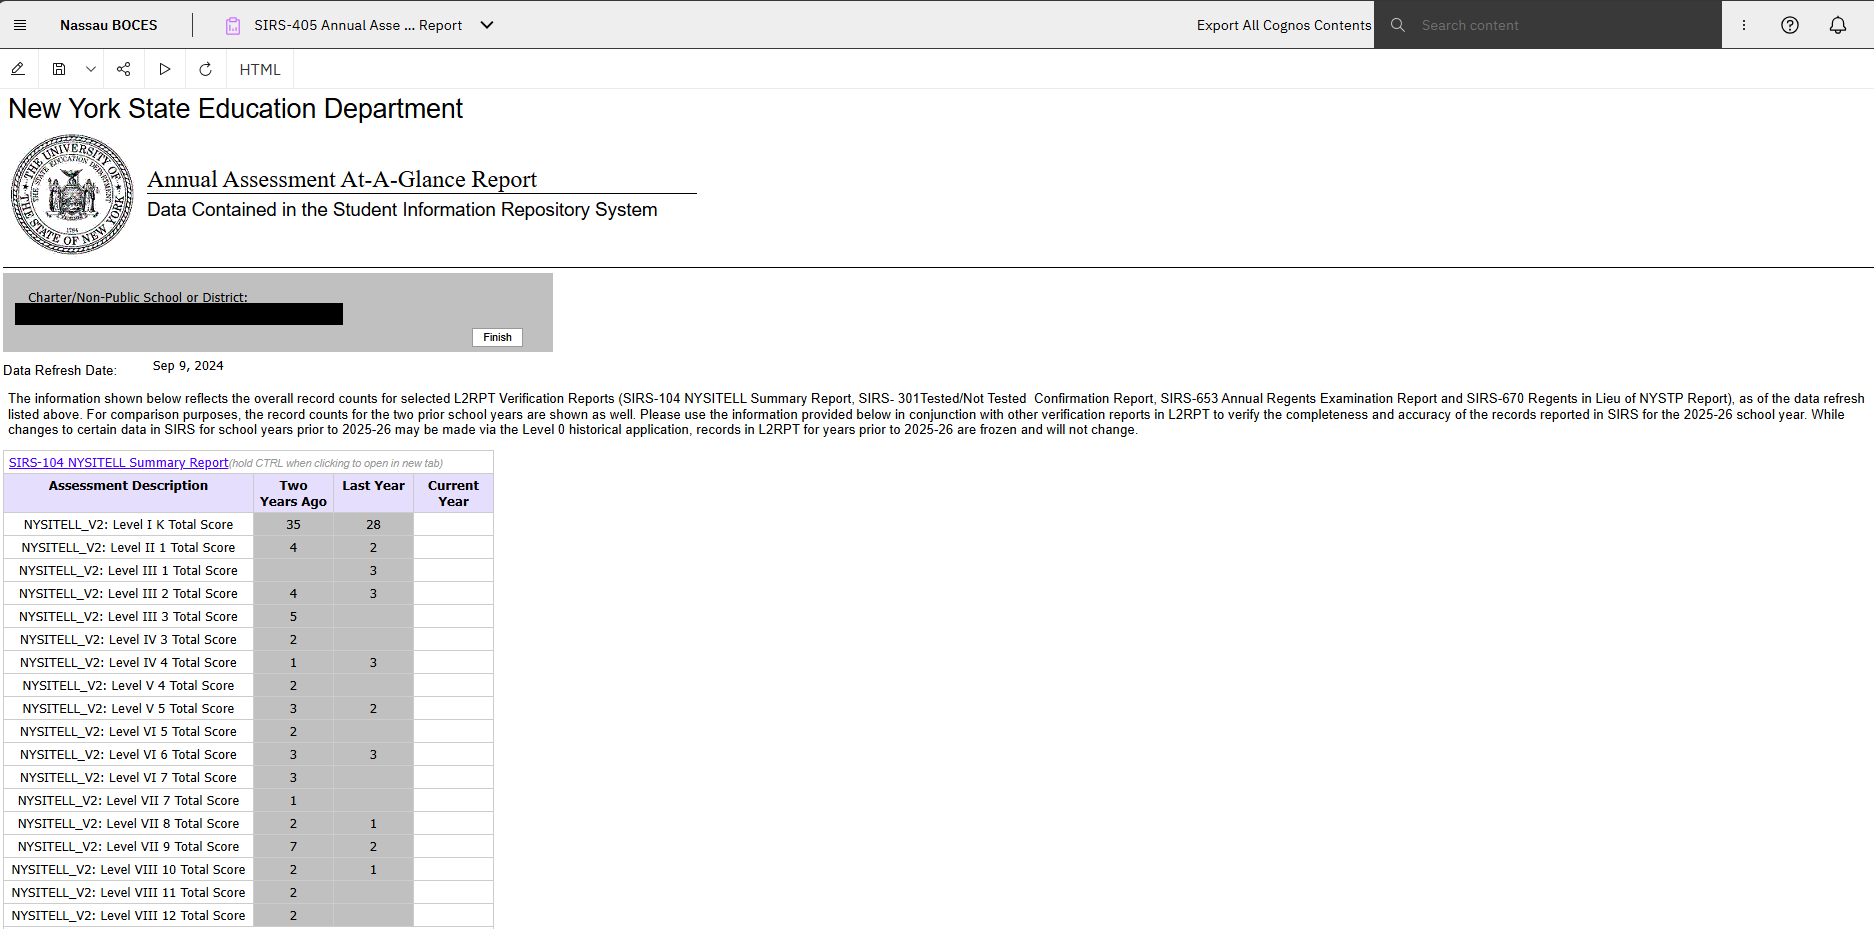
SIRS-405 Annual Assessment at a Glance
|
Compares assessment record counts for three years to help users identify reporting errors
|
|
|
|
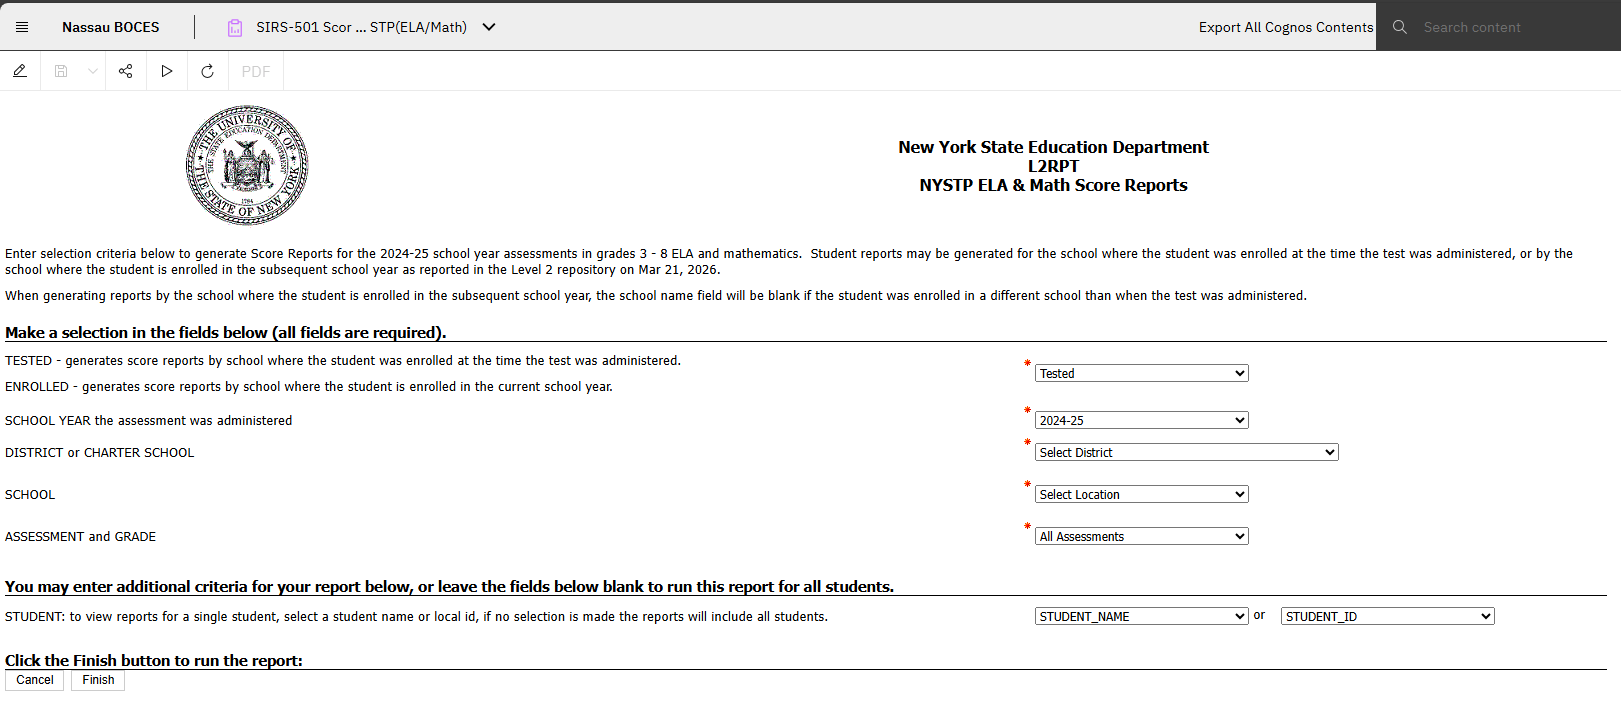
SIRS-501 Score Report (NYSTP ELA/Math)
|
Parent report containing information about the test and how the child performed on the Grade 3-8 ELA and Mathematics assessments
|
|
|
|
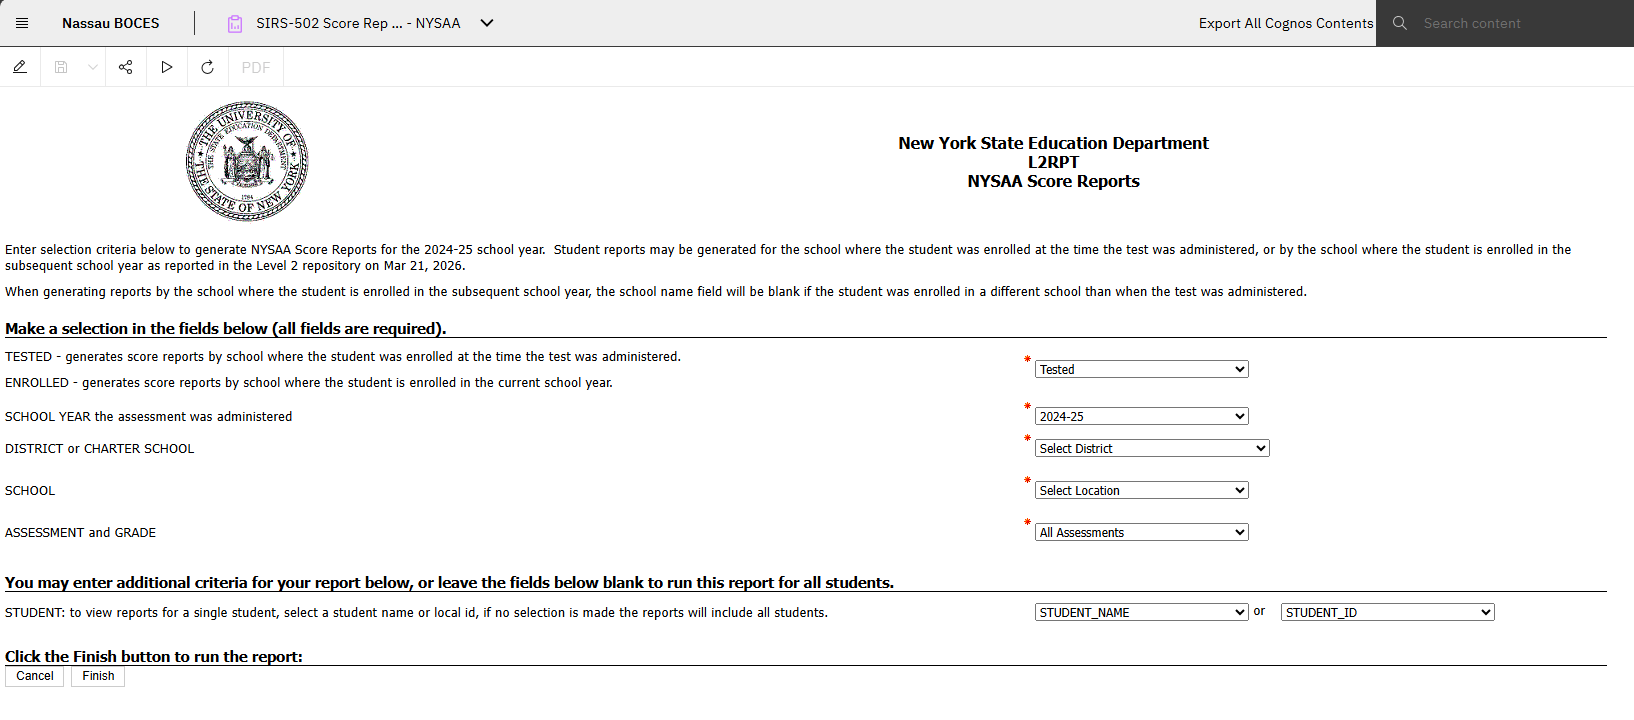
SIRS-502 Score Report (NYSAA)
|
Parent report containing information about the test and how the child performed on the NYSAA assessments
|
|
|
|
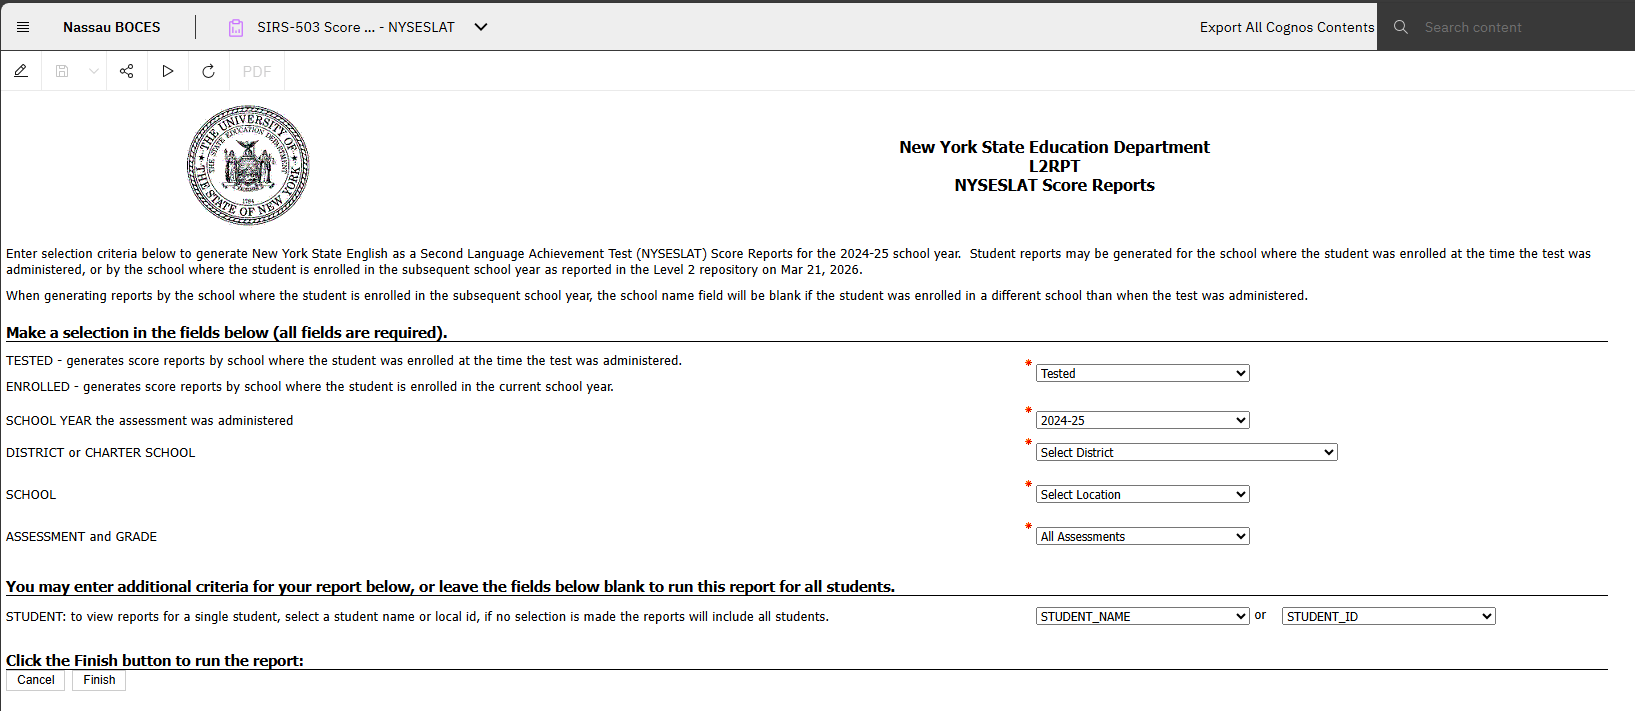
SIRS-503 Score Report (NYSESLAT)
|
Parent report containing information about the test and how the child performed on the NYSESLAT assessments
|
|
|
|
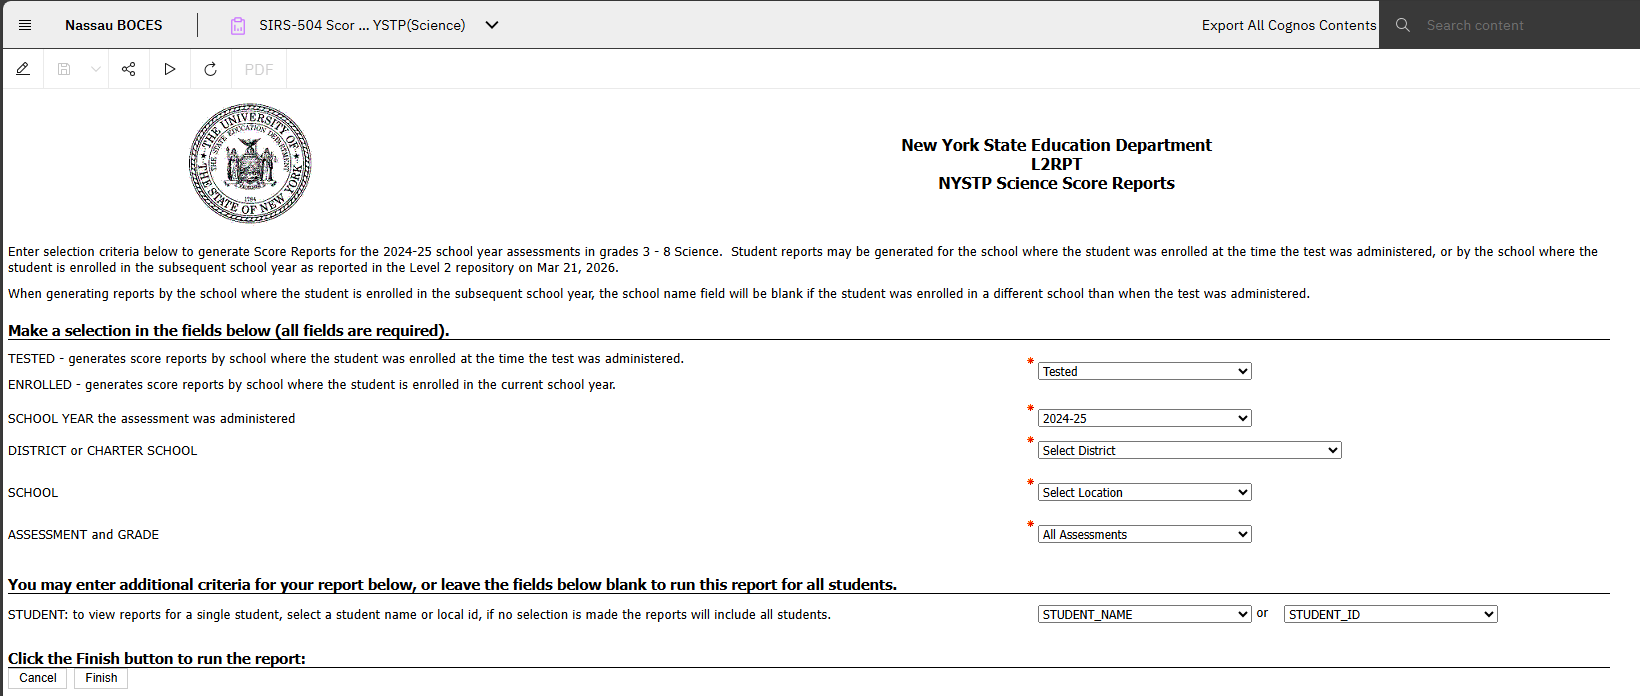
SIRS-504 Score Report (NYSTP Science)
|
Parent report containing information about the test and how the child performed on the Grades 5 and 8 Science assessments
|
|
|
|
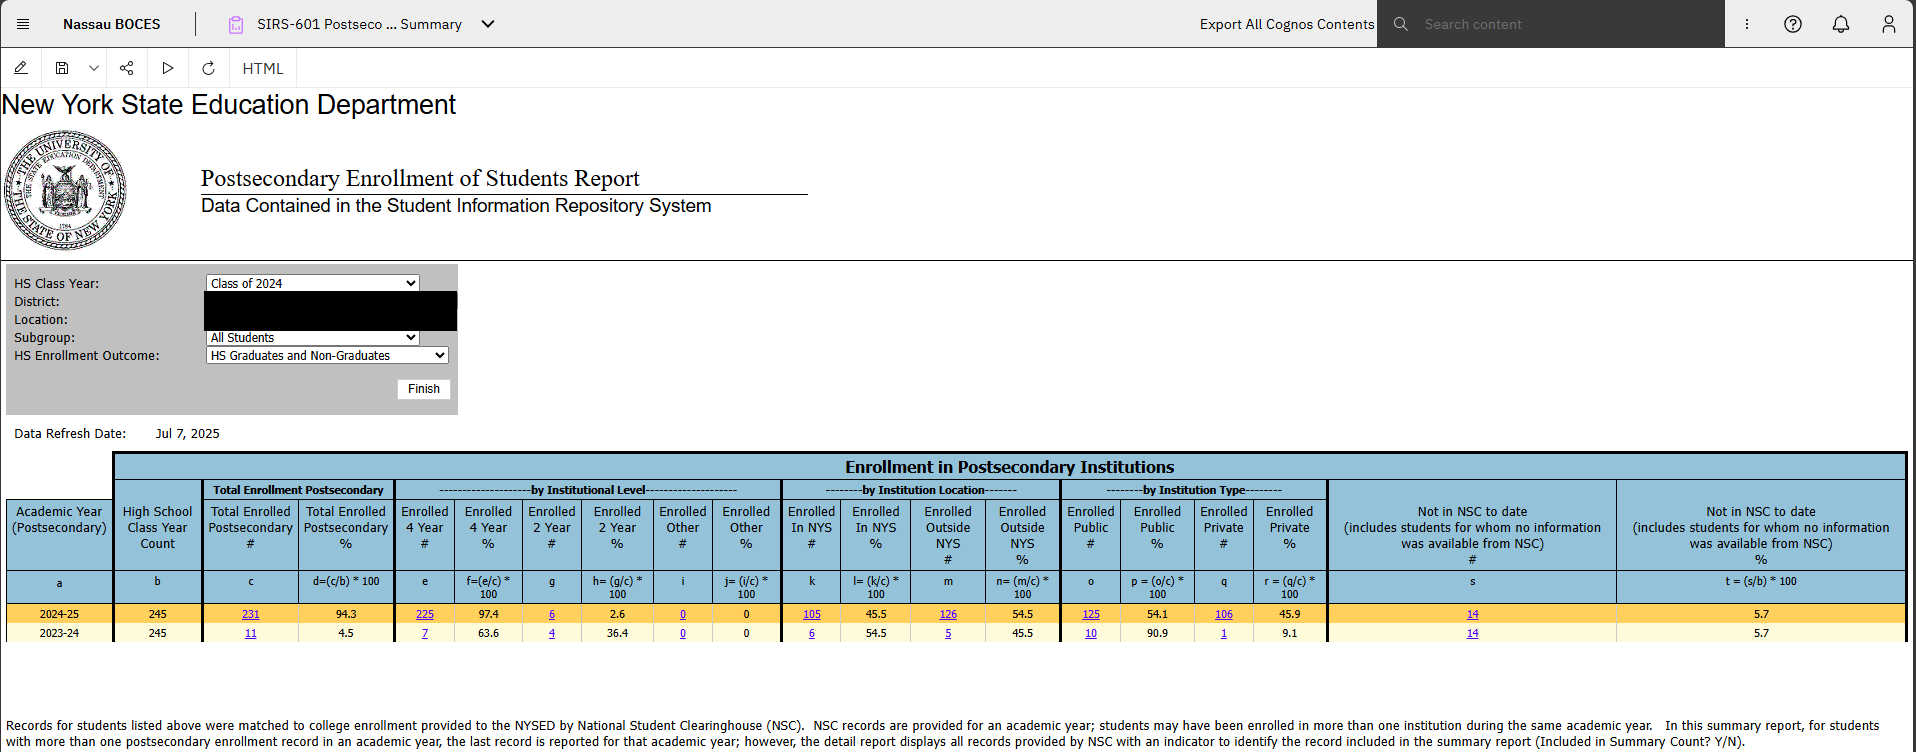
SIRS-601 Postsecondary Enrollment Summary Report
|
Report containing postsecondary enrollment information from NSC for a 9th grade cohort (total cohort)
|
|
|
|
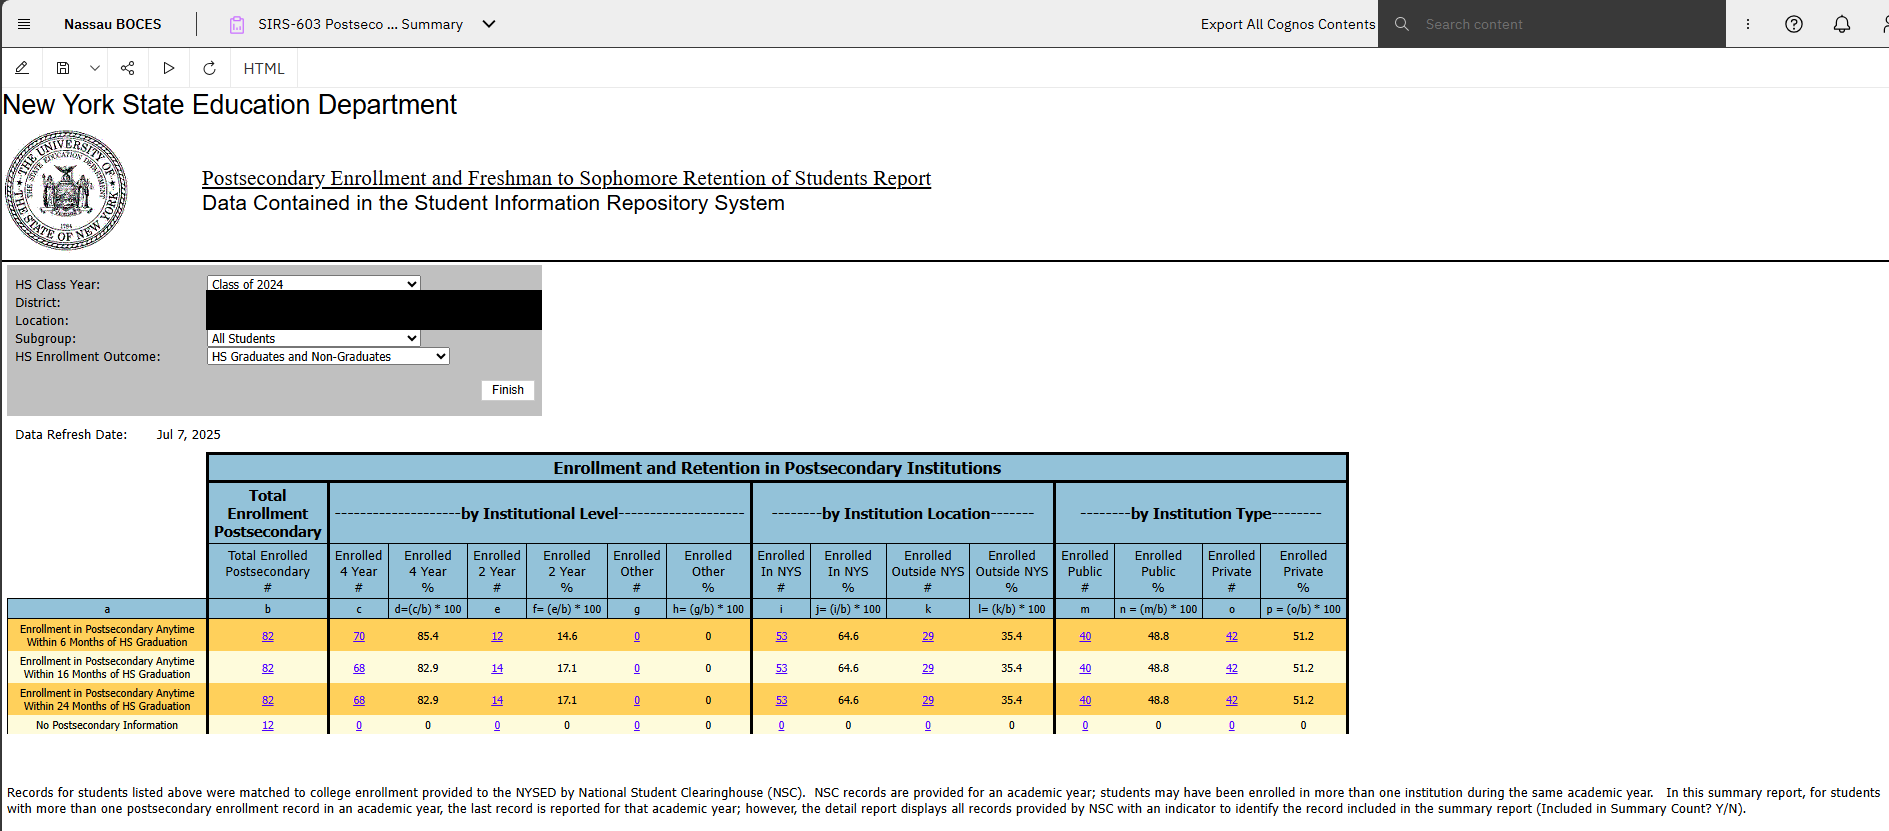
SIRS-603 Postsecondary Enrollment and Freshman to Sophomore Retention of Students Report
|
Report containing postsecondary enrollment and the count who continue after the first year from NSC for a 9th grade cohort (total cohort)
|
|
|
|
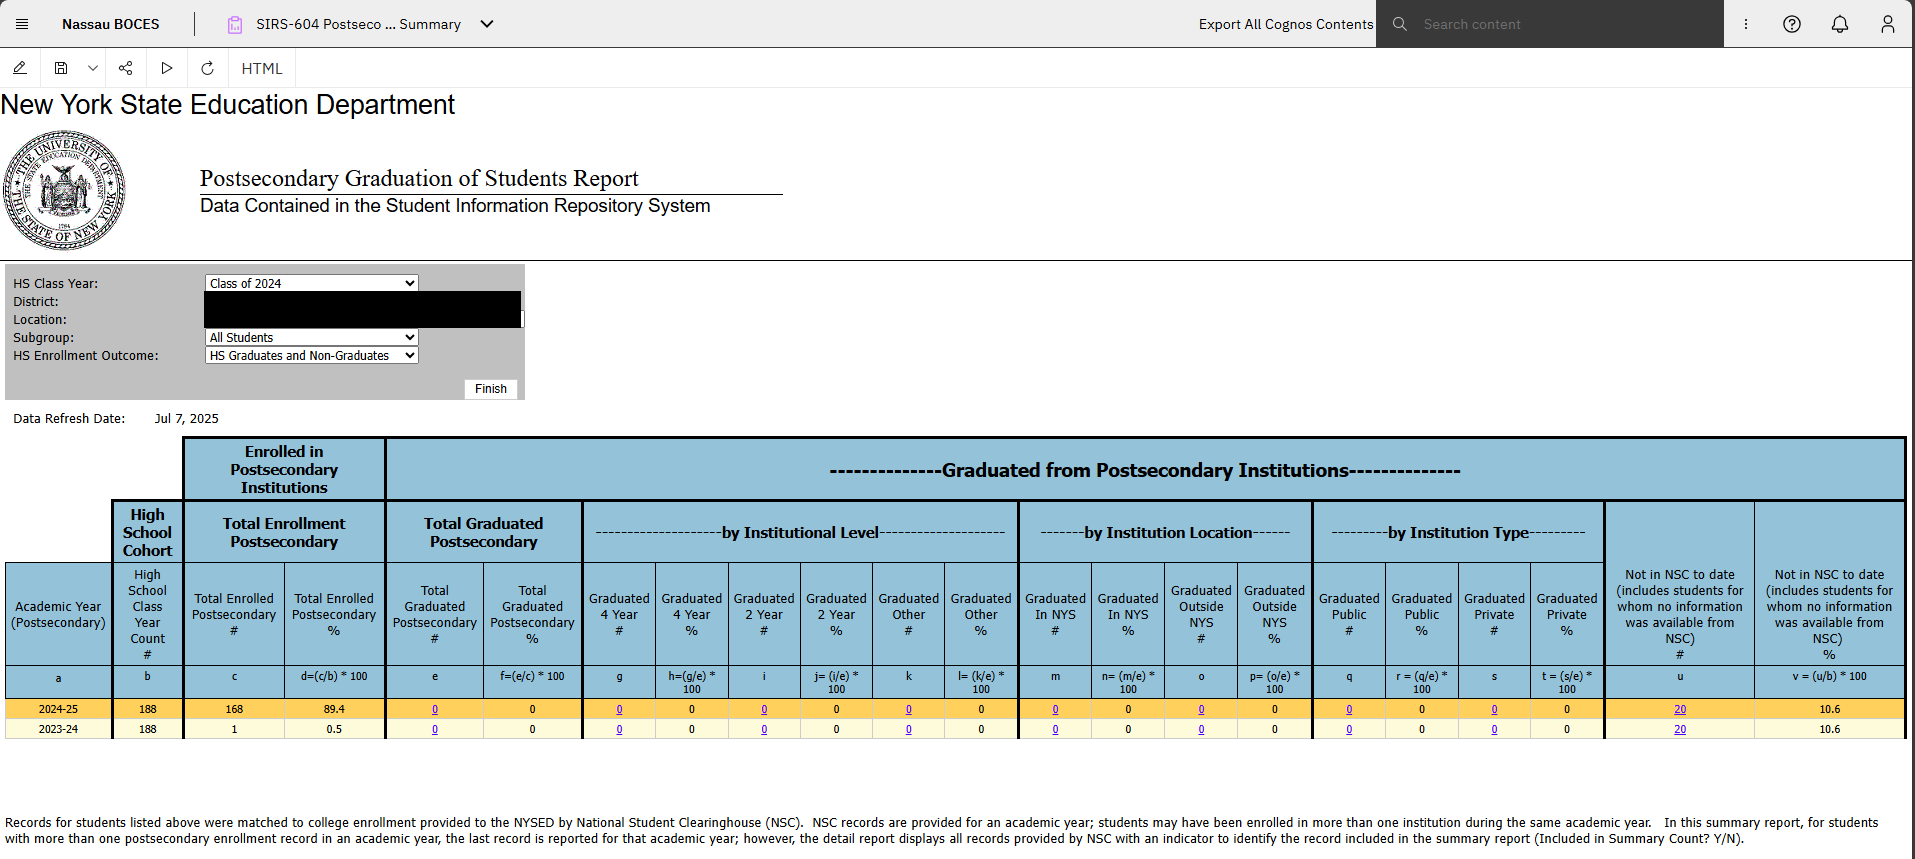
SIRS-604 Postsecondary Graduation Summary Report
|
Report containing postsecondary completion information from NSC for a 9th grade cohort (total cohort)
|
|
|
|
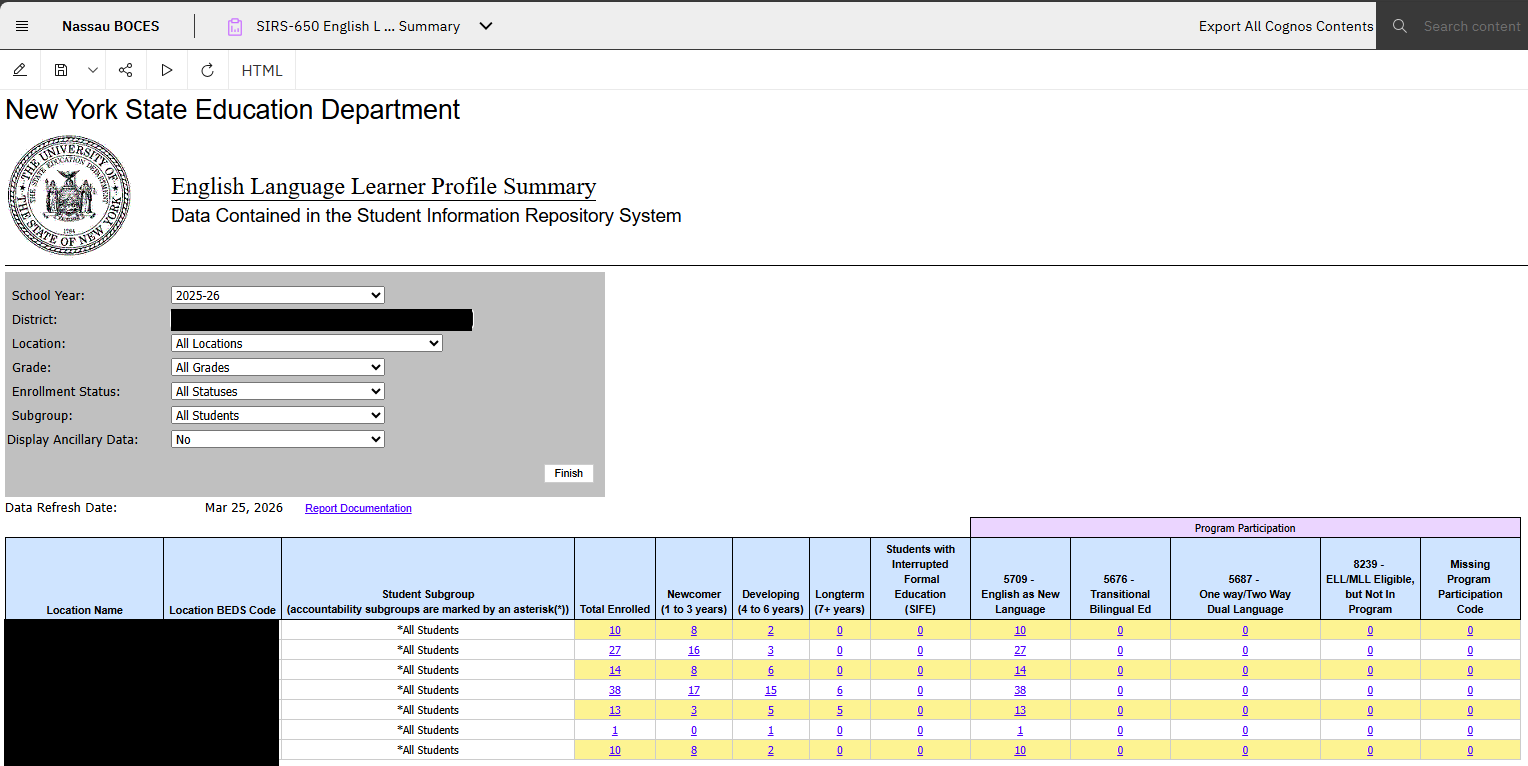
SIRS-650 English Language Learner Profile Summary
|
Students are included on the English Language Learner Profile report if they had a regular enrollment record contains Program Service Code 0231 – ELL Eligible, indicating the student is eligible for ELL services during the selected school year
|
|
|
|
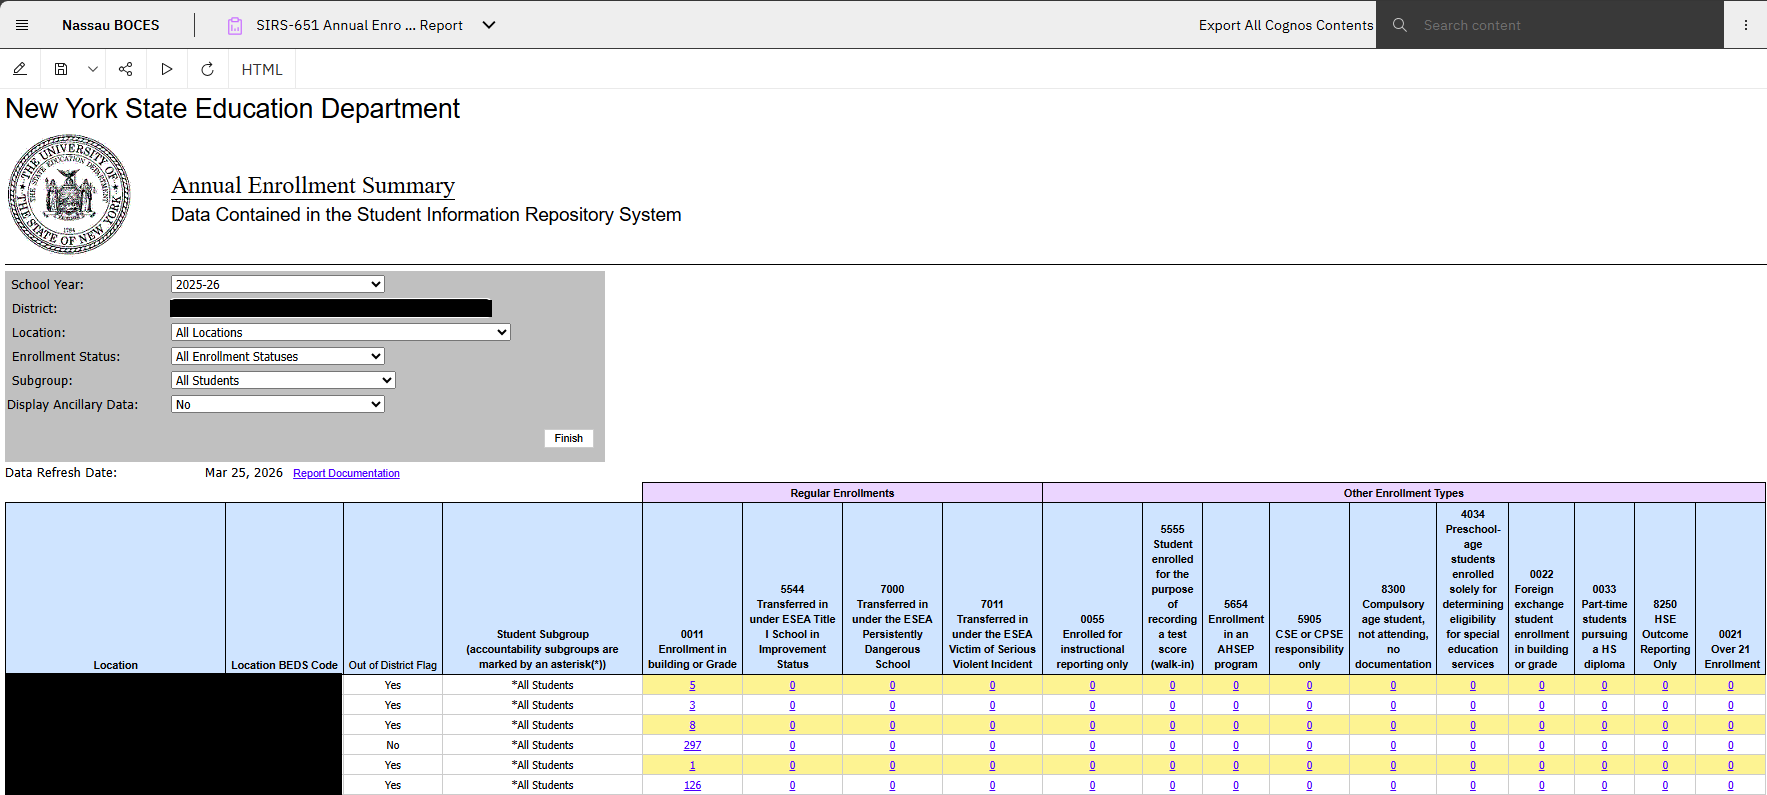
SIRS-651 Annual Enrollment Summary Report
|
The Annual Enrollment Summary report provides Local Educational Agencies (LEAs) with enrollment information by enrollment type grouped by location. This annual report will include any student who was enrolled in the LEA for one or more days during the school year (July 1 to June 30).
|
|
|
|
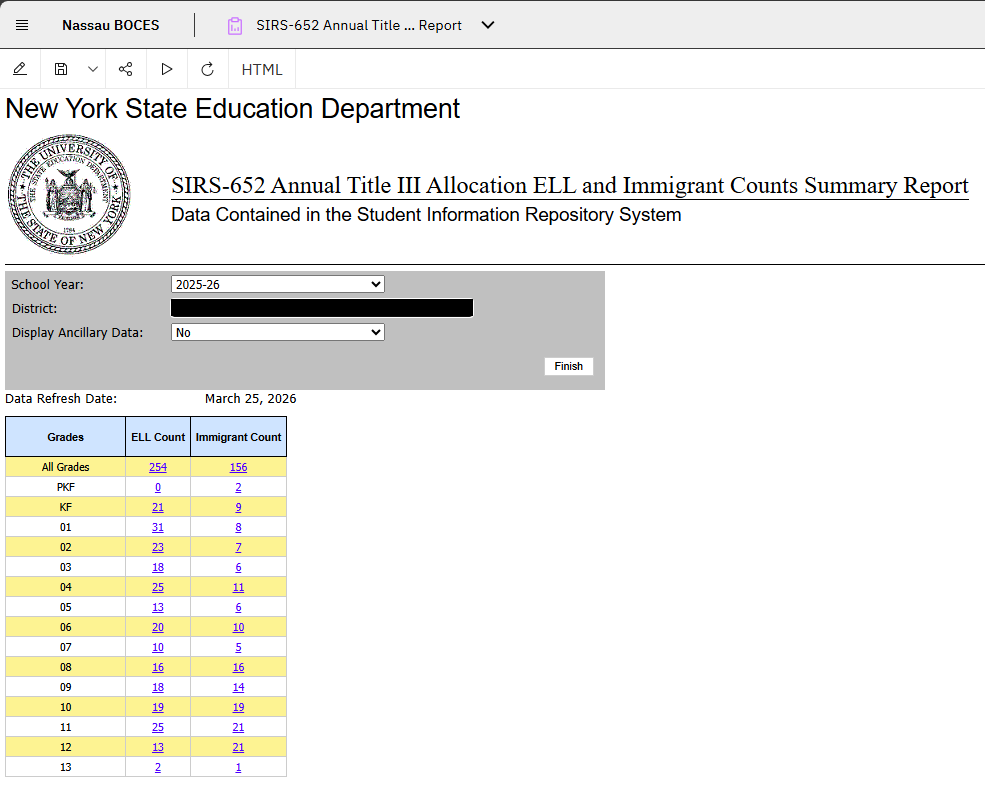
SIRS-652 Annual Title III Allocation ELL and Immigrant Counts Summary Report
|
Review ELL and Immigrant counts by grade level
|
|
|
|
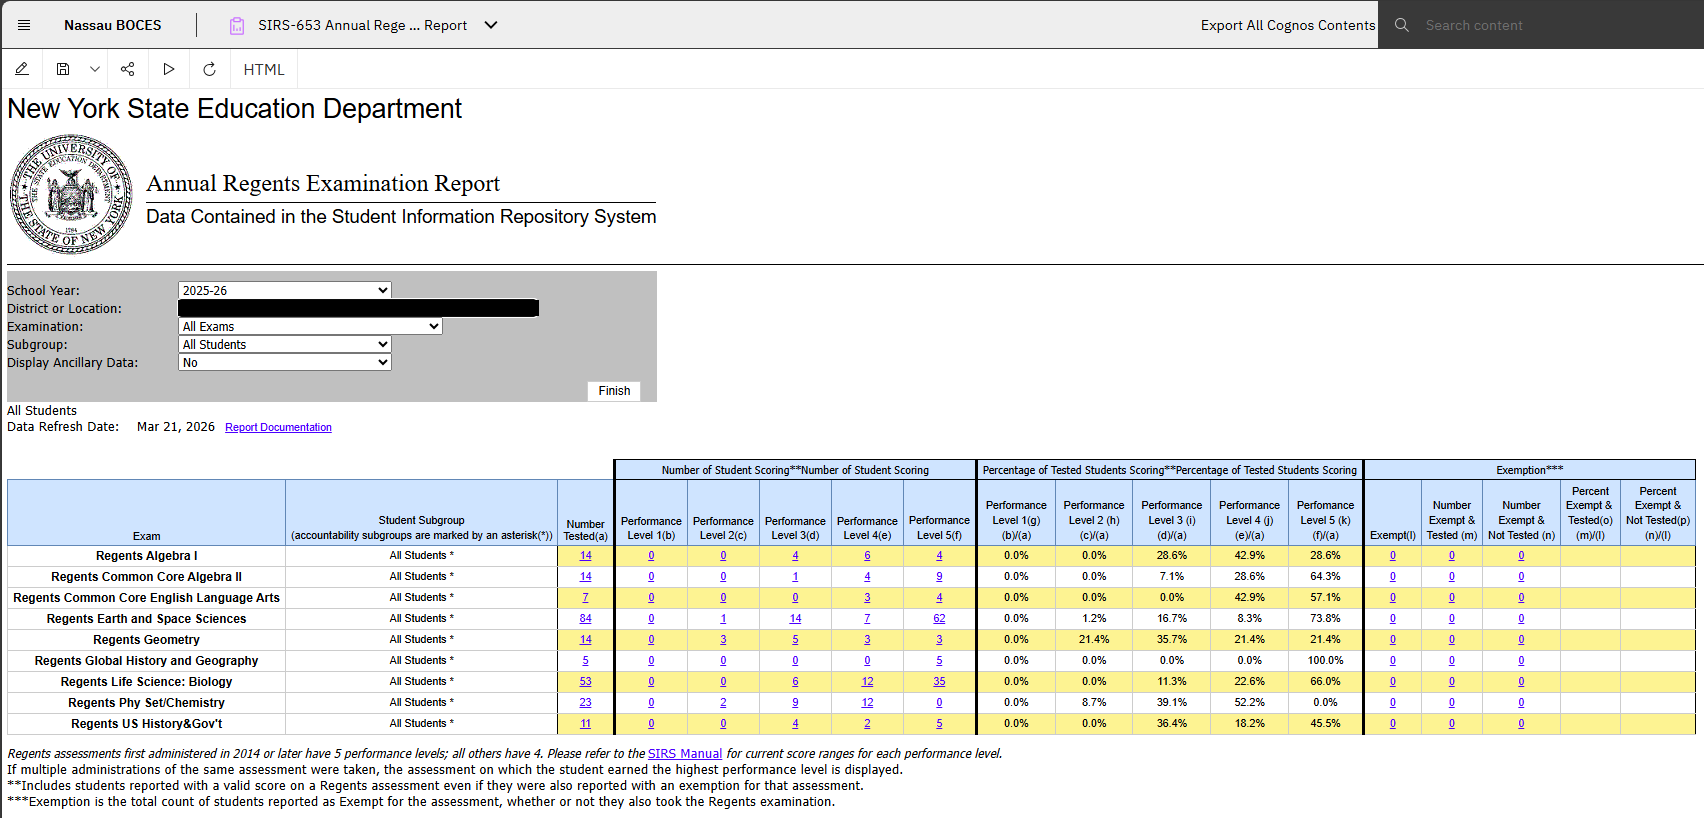
SIRS-653 Annual Regents Examination Report
|
The Annual Regents Examination Report shows district and school Regents examination results for all students in the reporting year (August 31st through June 30th), regardless of grade. Students are included in this report if during the reporting year they were reported with a valid score and/or an exemption on a Regents examination and were enrolled with a regular enrollment record at the time the assessment was administered.
|
|
|
|
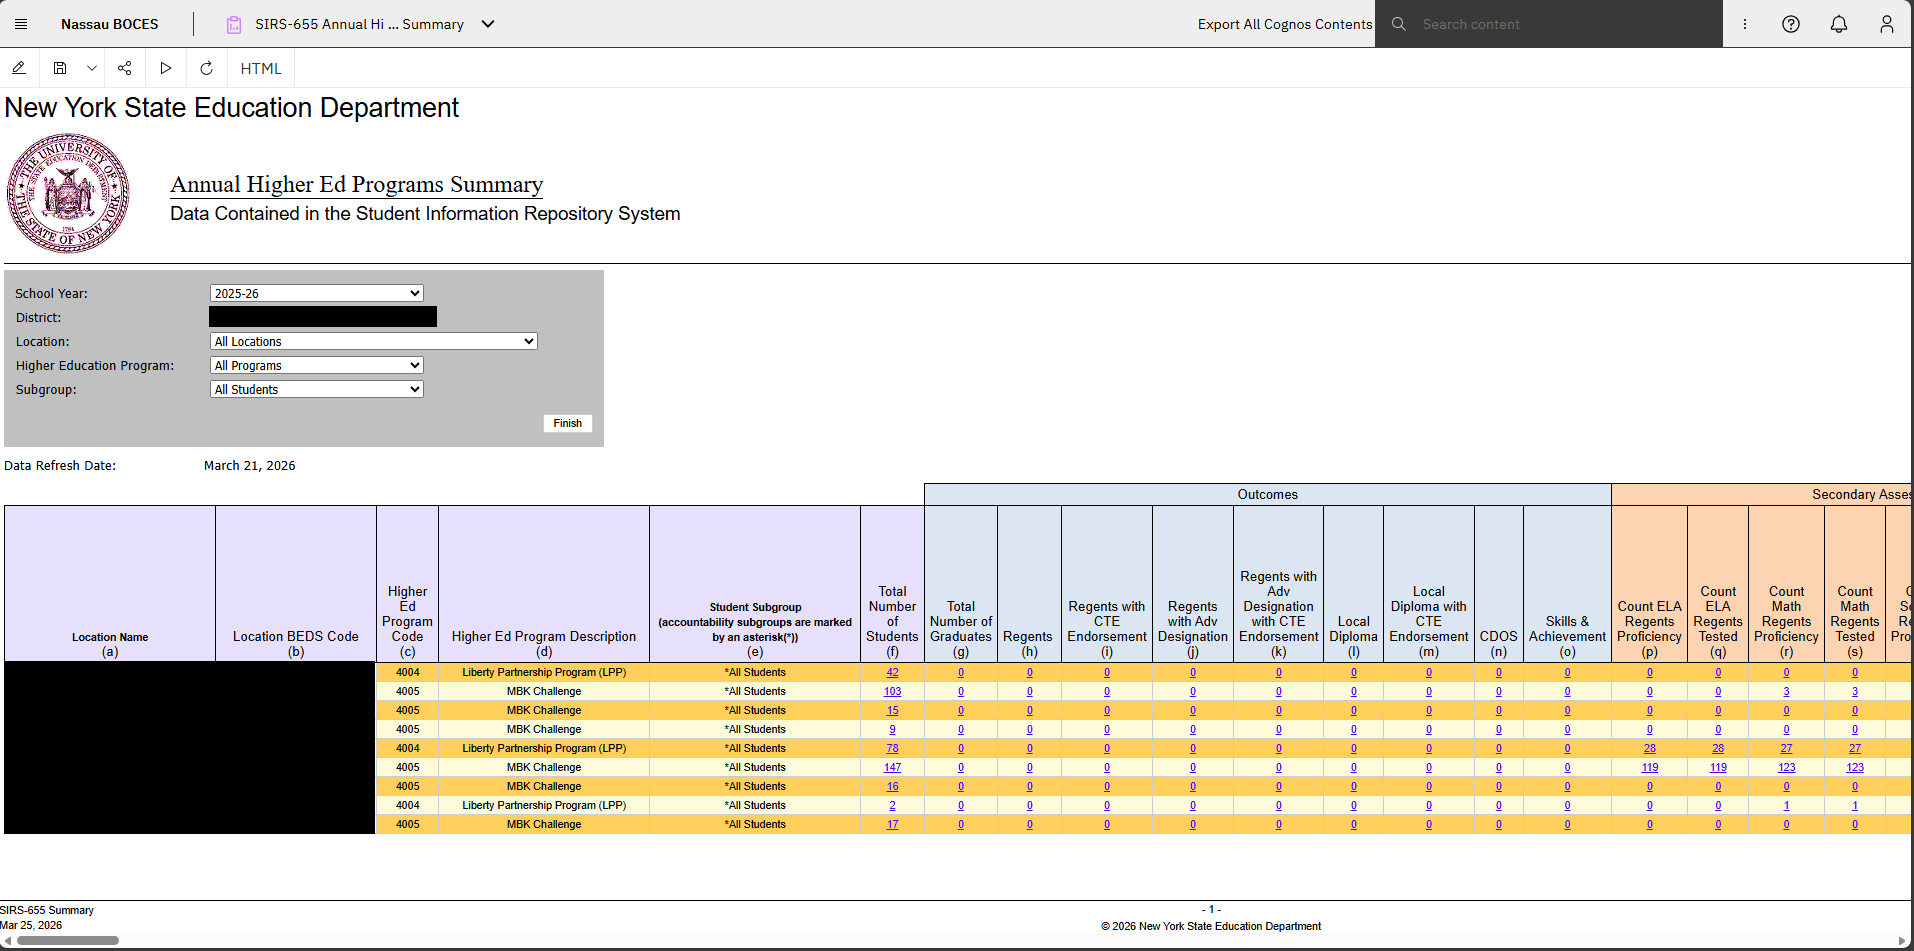
SIRS-655 Annual Higher Ed Programs Summary
|
The Annual Higher Ed Programs Report provides performance data on students enrolled in the following higher education programs: MBK Challenge, MBK Family and Community Engagement (FCEP), MBK Fellows (FP), MBK Exemplary School Models and Practices (ESMP), MBK Native American (NAP), Science and Technology Education Program (STEP), NYS P-Tech Program, NYC P�Tech Early Colleg
|
|
|
|
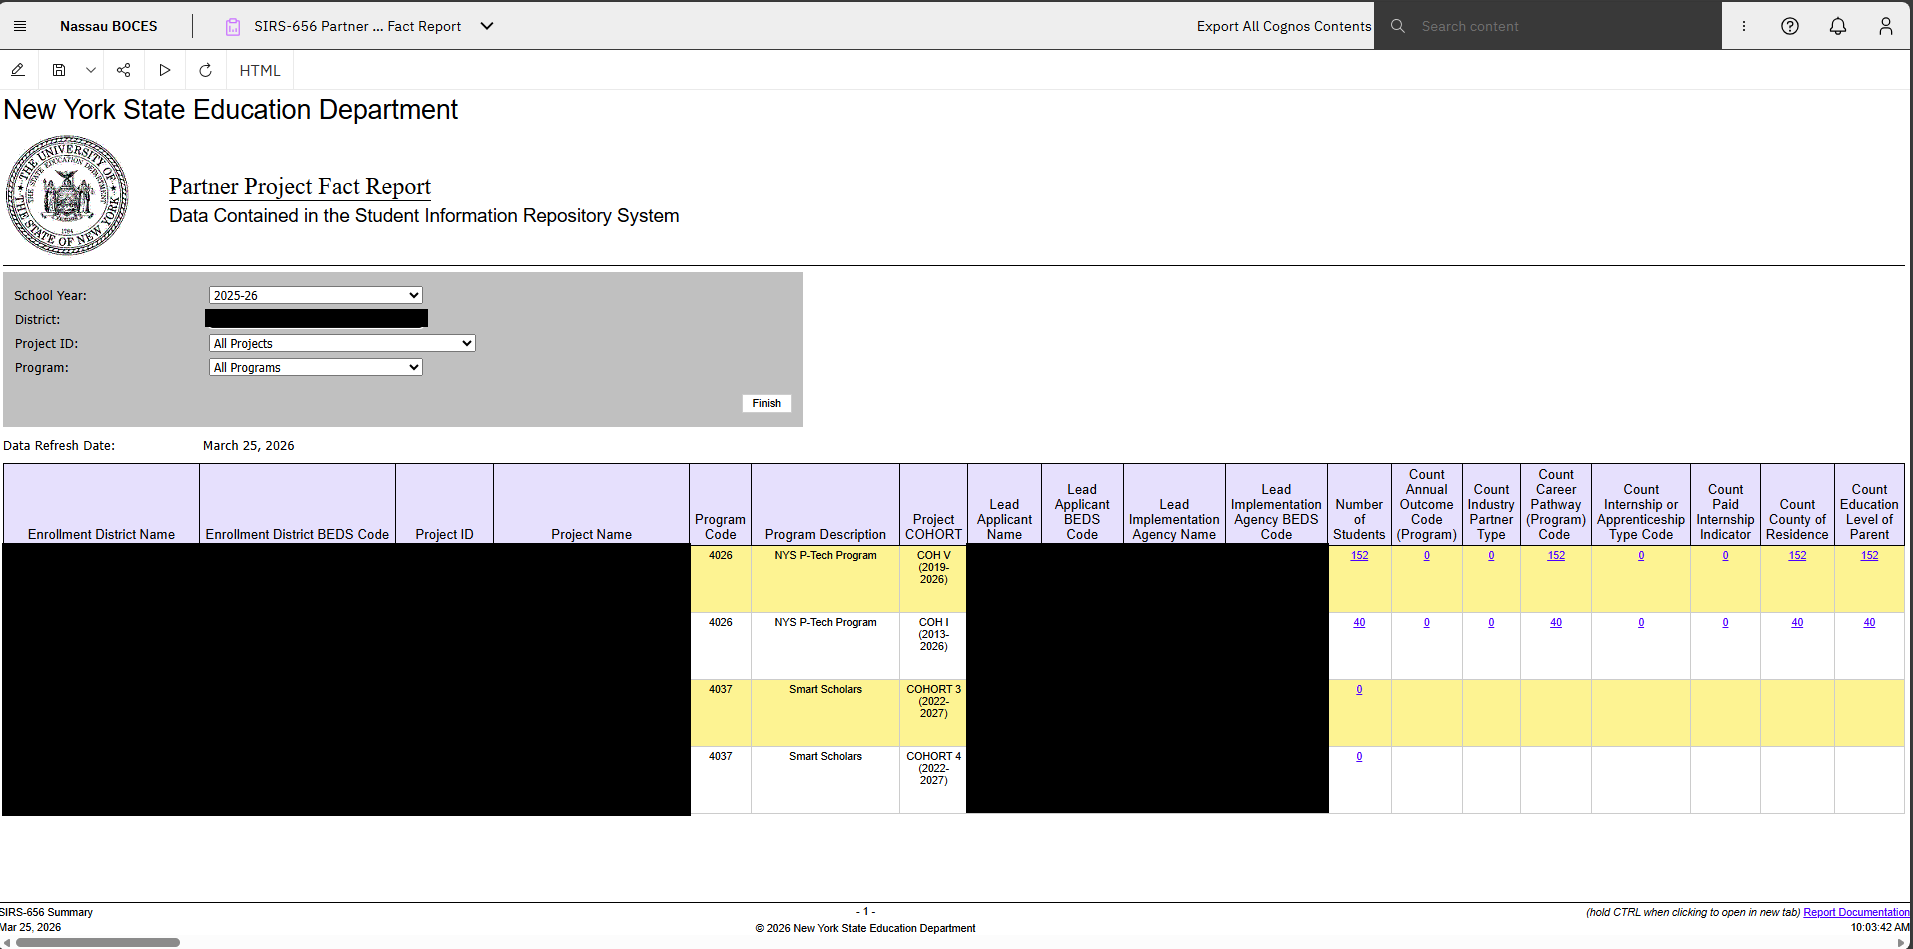
SIRS-656 Partner Project Fact Report
|
View counts of students in approved Partner Project Programs by cohort.
|
|
|
|
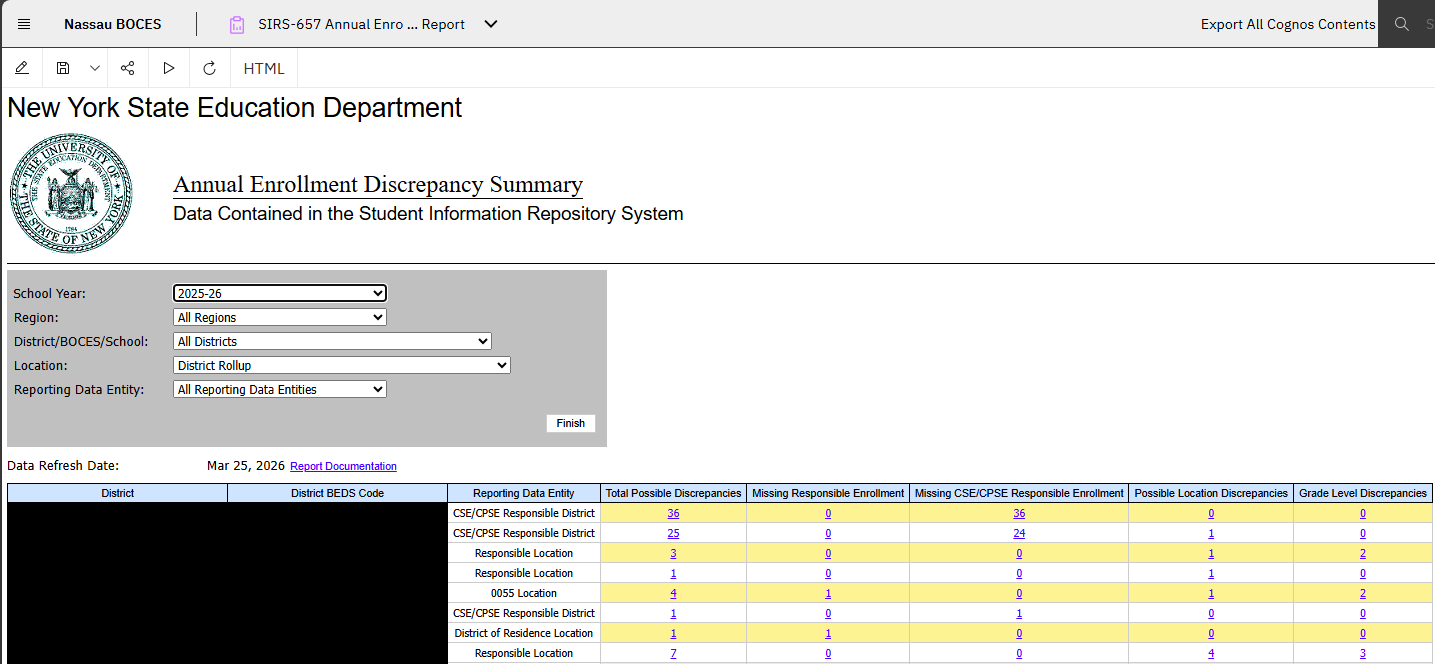
SIRS-657 Annual Enrollment Discrepancy Summary Report
|
This report can be used to assist with cleaning up testing location enrollments prior to the start of the testing window - specifically in relation to CBT records and 0055 enrollments.
|
|
|
|
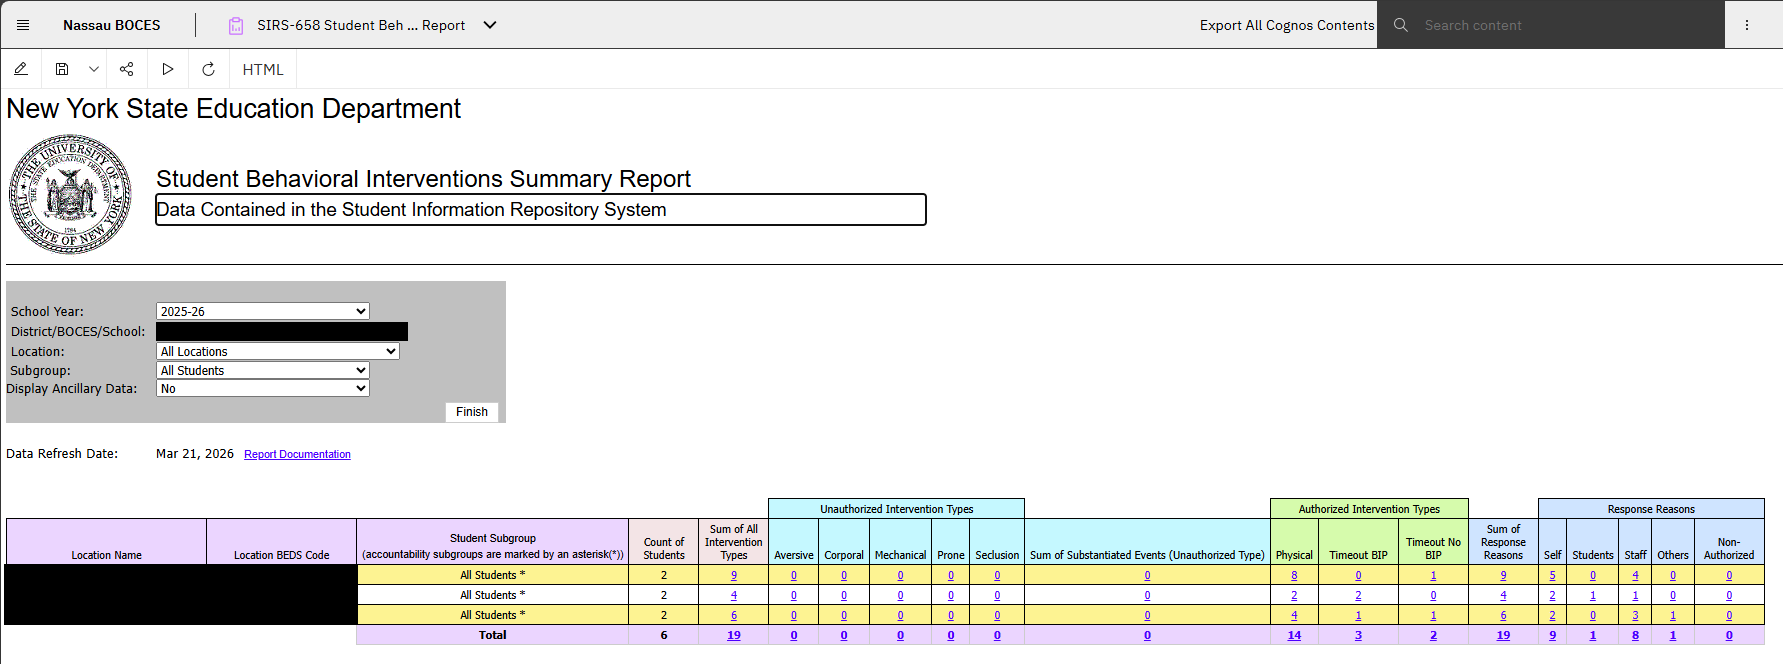
SIRS-658 Student Behavioral Interventions Summary Report
|
Starting in the 2024-25 school year, each public school district, Board of Cooperative Educational Services (BOCES), charter school, State-operated school pursuant to Articles 87 and 88 of the Education Law, and private residential school operated pursuant to Article 81 of the Education Law, must submit an annual report to the New York State Education Department on the use of physical restraint and timeout and substantiated and unsubstantiated allegations of use of prohibited interventions corporal punishment, mechanical restraint and other prohibited aversive interventions, prone physical restraint, and seclusion.
|
|
|
|
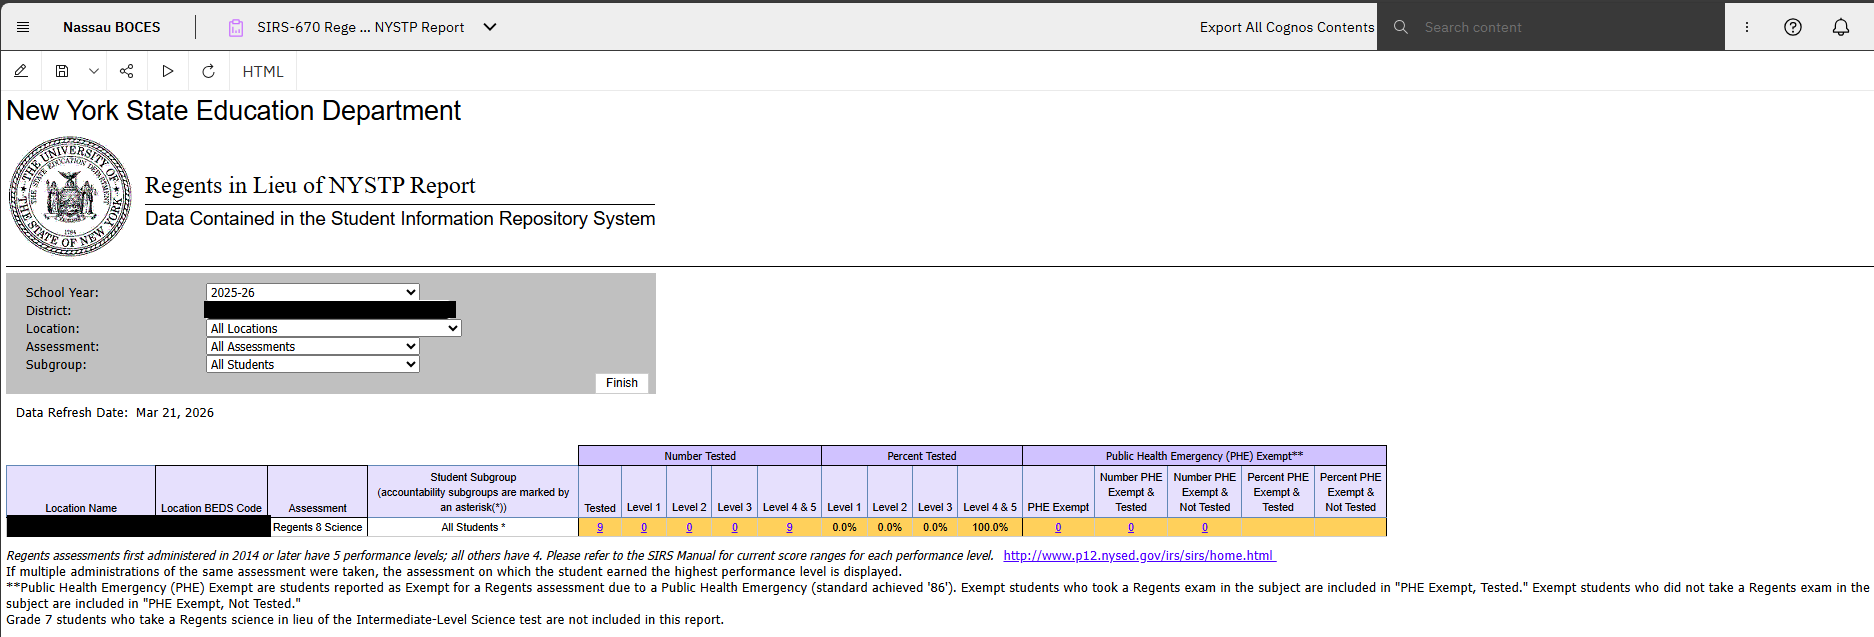
SIRS-670 Regents in Lieu of NYSTP Report
|
The SIRS-670 report presents Regents exam results for advanced 7th- and 8th-grade students who took Regents Math (grades 7 and 8) and Regents Science (grade 8) instead of the regular state tests, broken down by subject and grade. It also notes how many of these students were exempt from the exams because they passed the preparatory course but could not sit the test due to it not being offered or a Public Health Emergency.
|
|
|
|
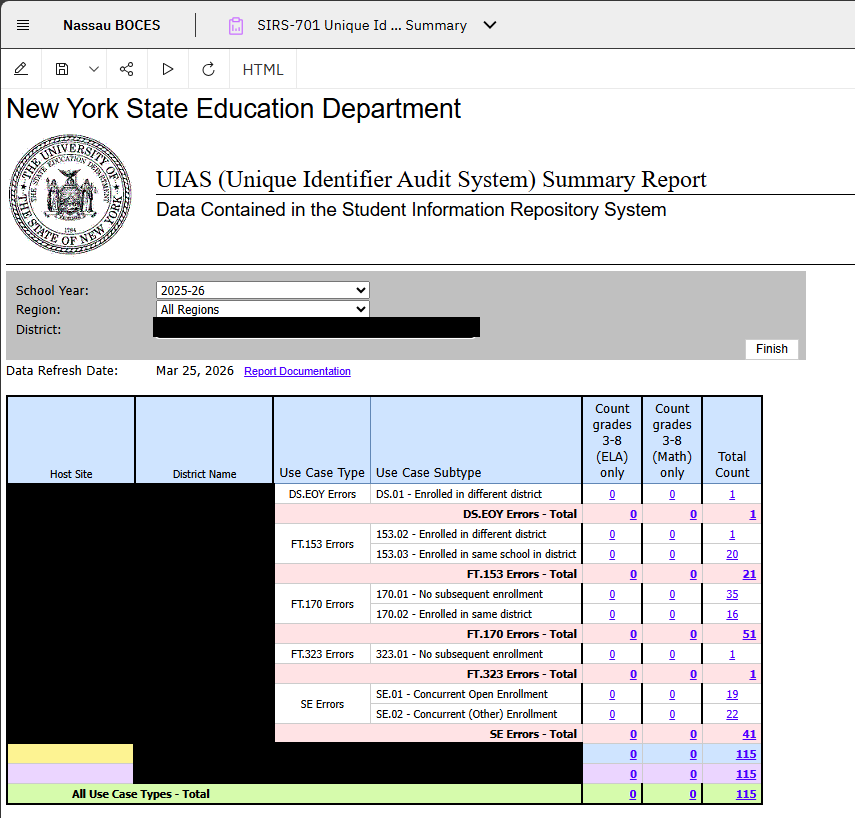
SIRS-701 Unique Identifier Audit System Summary
|
Review concurrent enrollment records across school districts
|
|
|
|
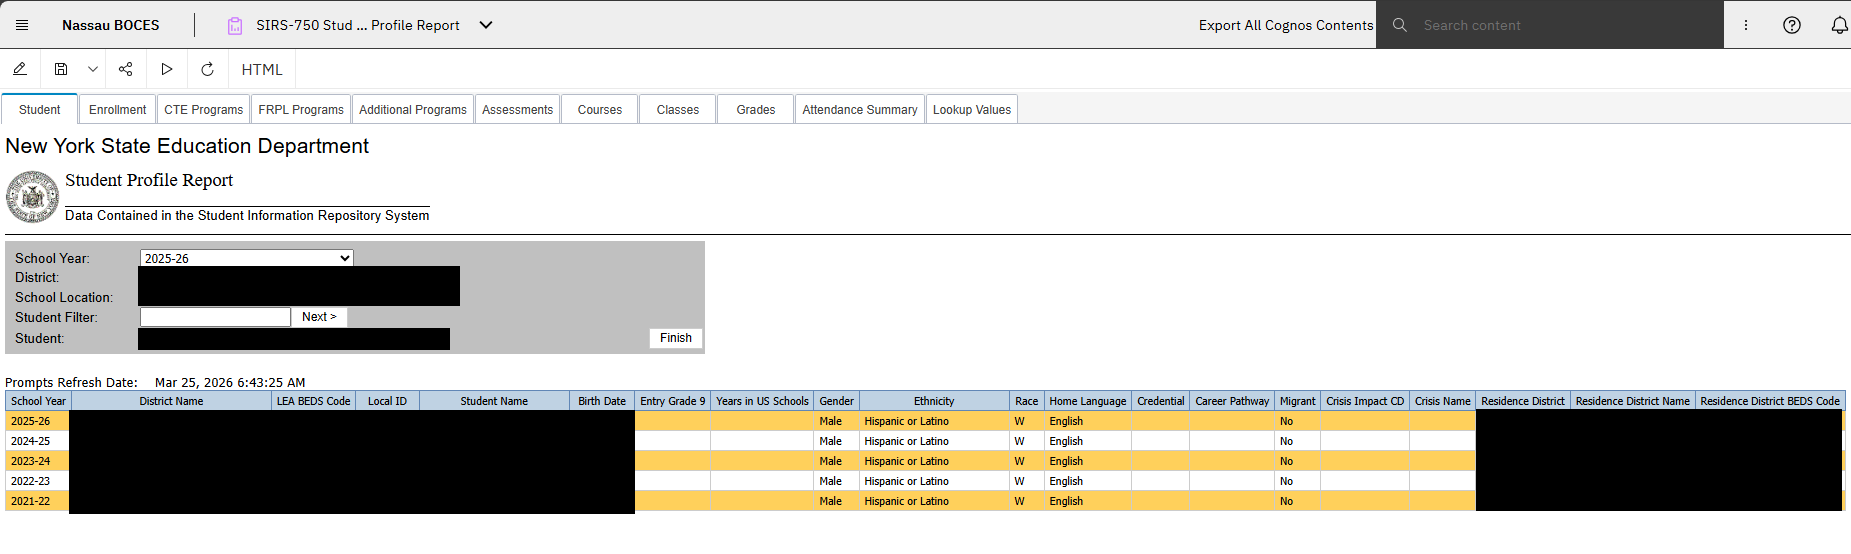
SIRS-750 Student Profile Report
|
View all information for all current students submitted through SIRS tied to NYSSIS ID regardless of historical district of submission
|
|
|
|
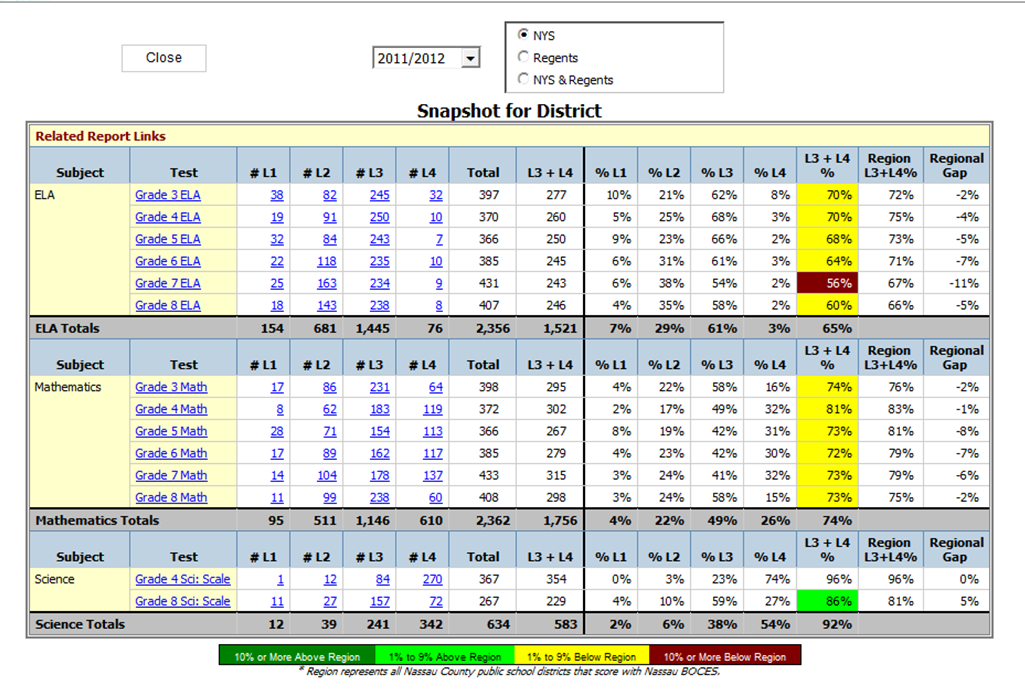
Snapshot
|
Number and percentage of students at each performance level in the district for multiple assessments in a single year.
|
|
|
|
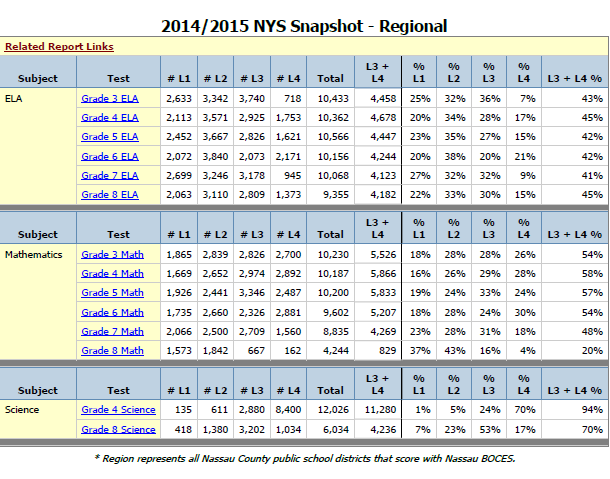
Snapshot - Regional
|
Total number and percentage of students at each performance level in Nassau County for multiple assessments in a single year.
|
|
|
|
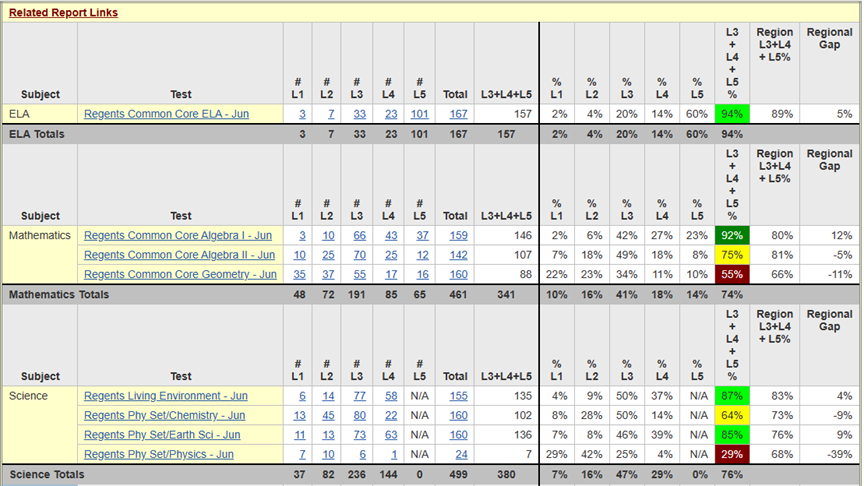
Snapshot for Regents First-Time Test Takers
|
This report displays a summary of Regents scores for first time test takers for all students enrolled in the selected school year.
|
|
|
|
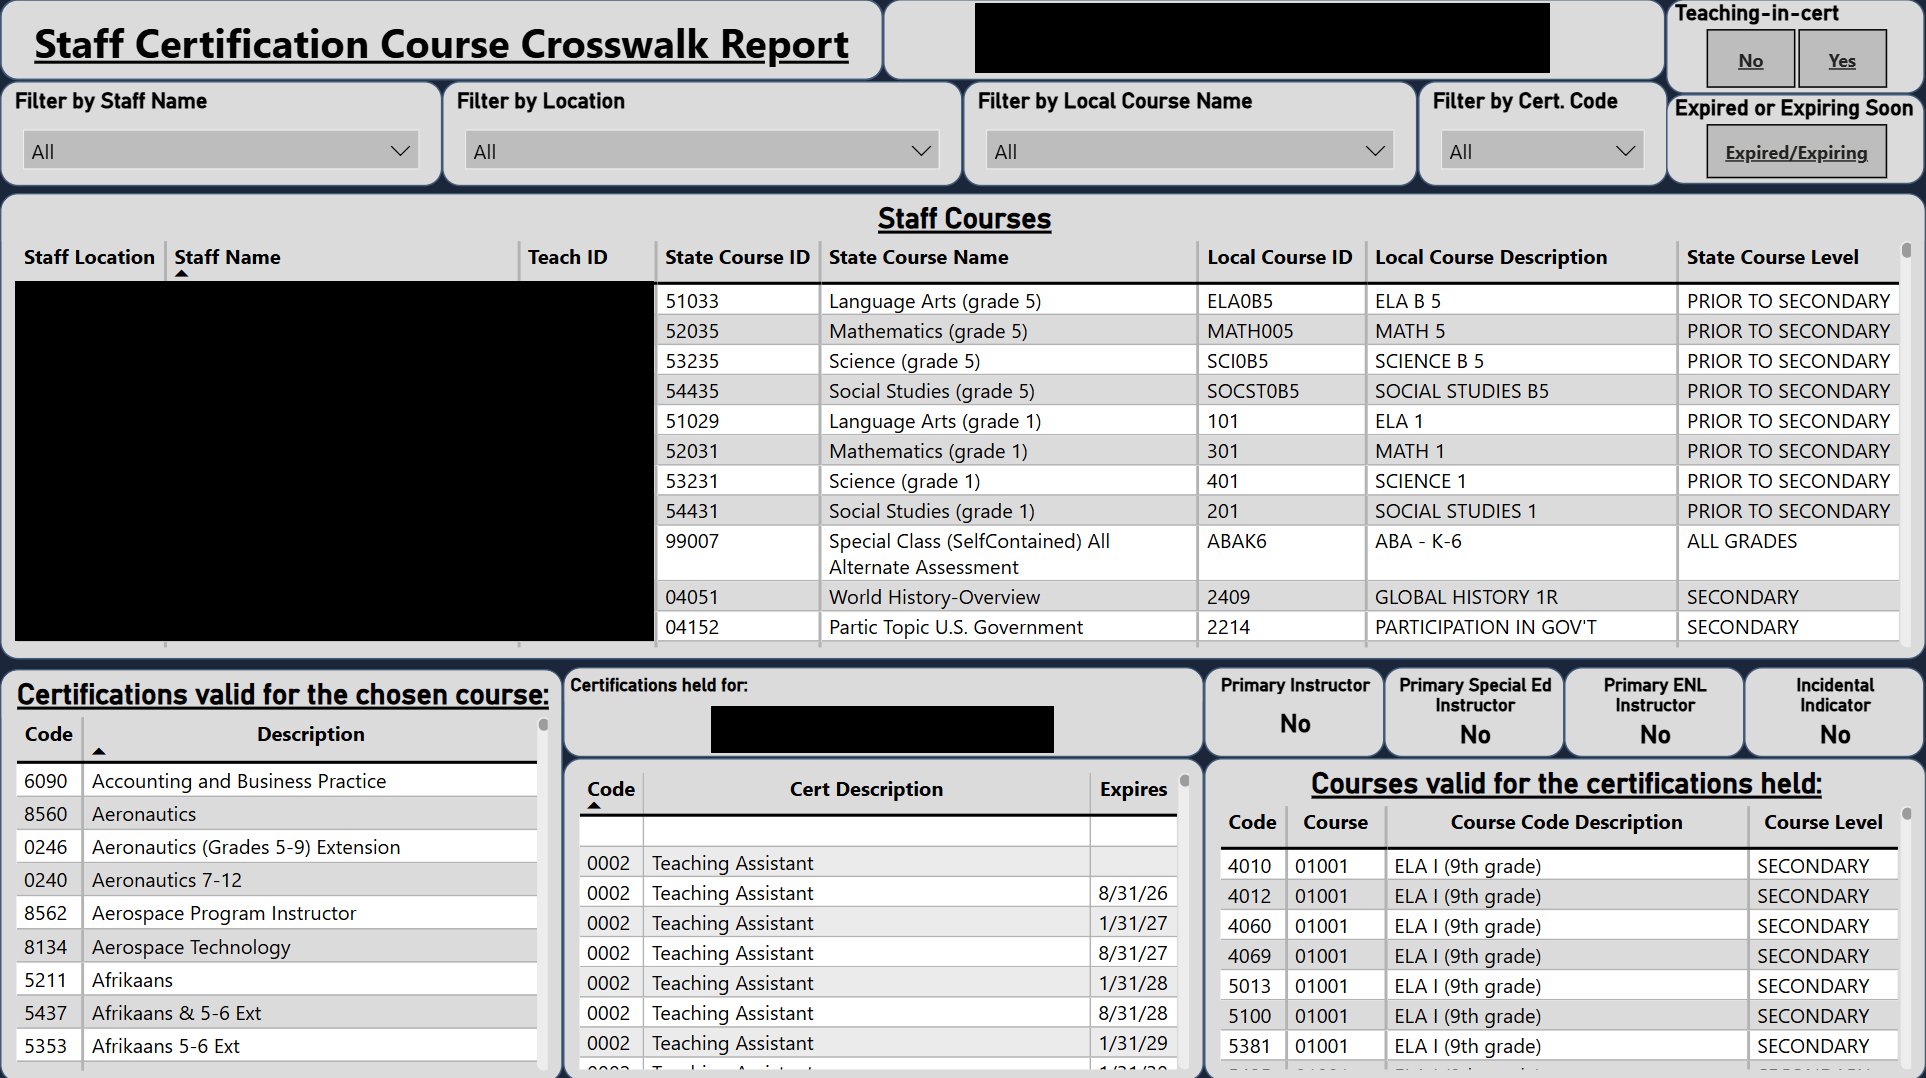
Staff Certification Crosswalk Verification Report
|
View the data from the SIRS-328, SIRS-329 and Course Crosswalk all in one place to troubleshoot staff certifications.
|
|
|
|
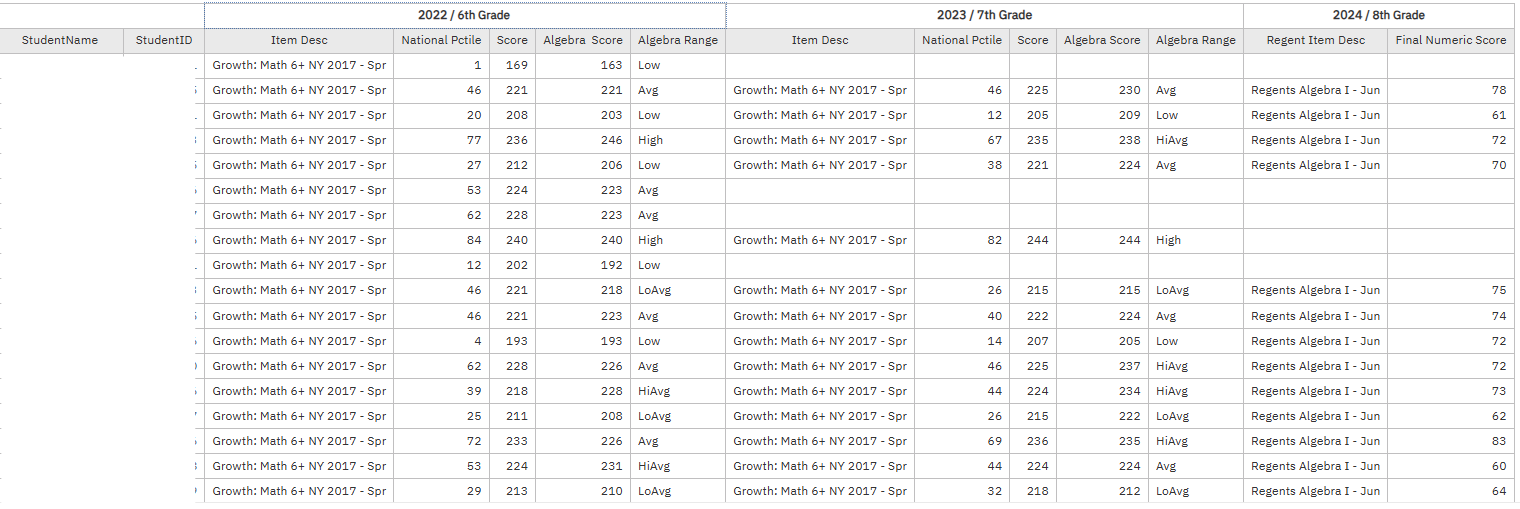
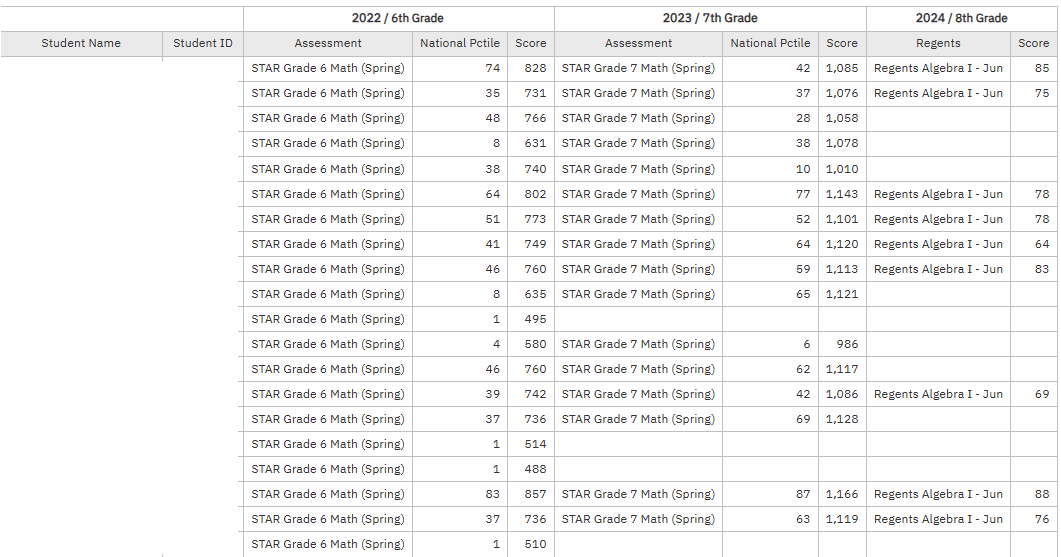
STAR Accelerated Algebra Student Longitudinal iReport
|
This report compares STAR math results for students in 6th and 7th grade with their 8th grade Algebra Regents results. Users can look back to see how students previously performed on all three assessments and use these results to predict which of their current students may succeed or struggle when placed in accelerated math in 8th grade. The STAR results displayed are from the spring administrations and include the overall score and national percentile. Final numeric score is displayed for the June Regents.
|
|
|
|
STAR and NYS Assessment Comparison
|
This report displays STAR Diagnostic data for all students and their available scores for any term (Fall, Winter, Spring) of an STAR Diagnostic
|
|
|
|
STAR and NYS Assessment Comparison Download
|
This report displays STAR Diagnostic data for all students and their available scores for any term (Fall, Winter, Spring) of an STAR Diagnostic in download version
|
|
|
|
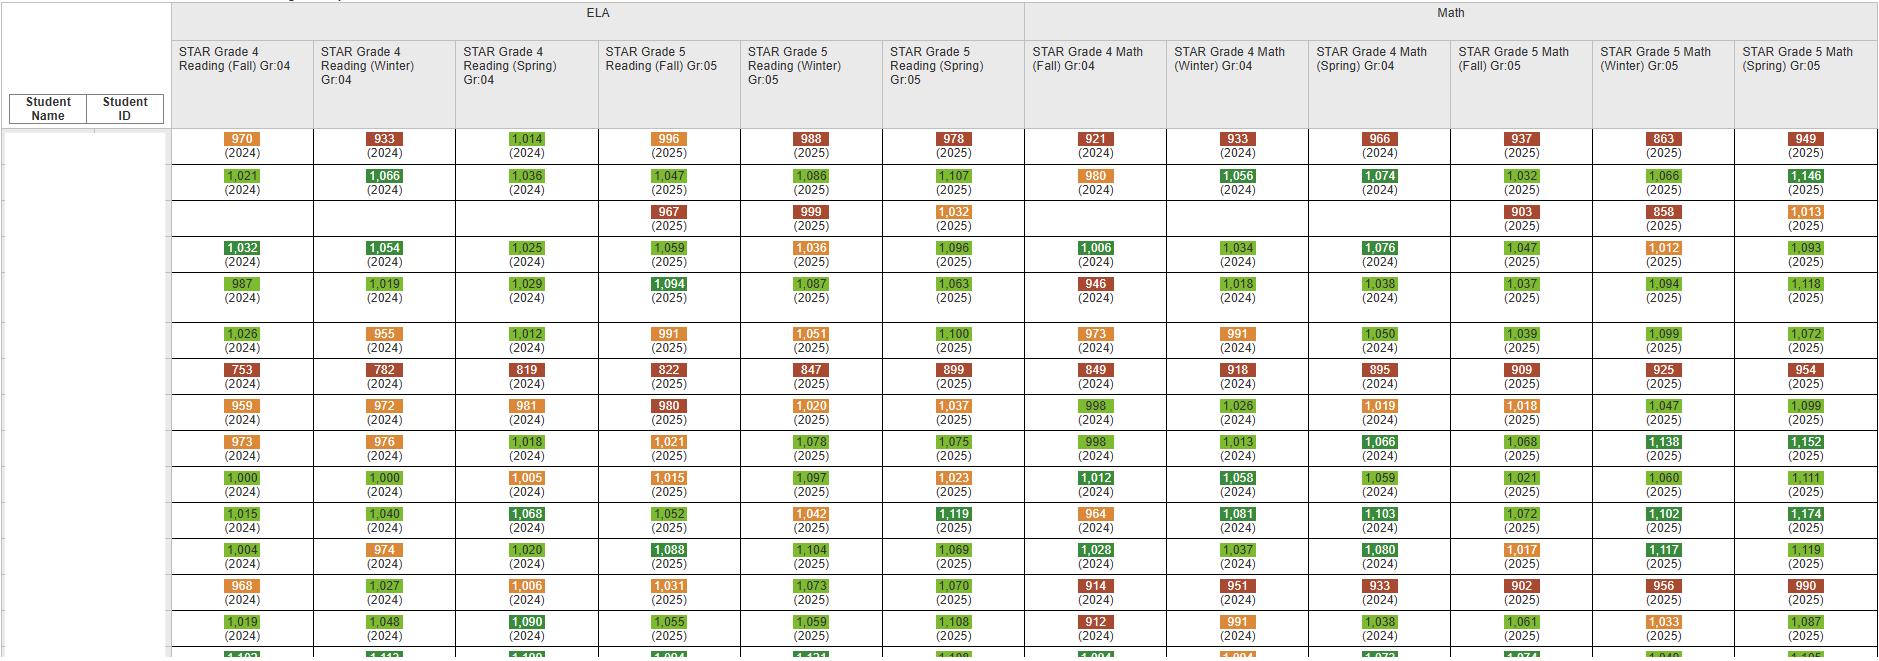
STAR Assessment Student Longitudinal
|
This report displays a list of all students and their complete historical STAR scores for the selected school year of enrollment. Data are grouped longitudinally by subject area.
|
|
|
|
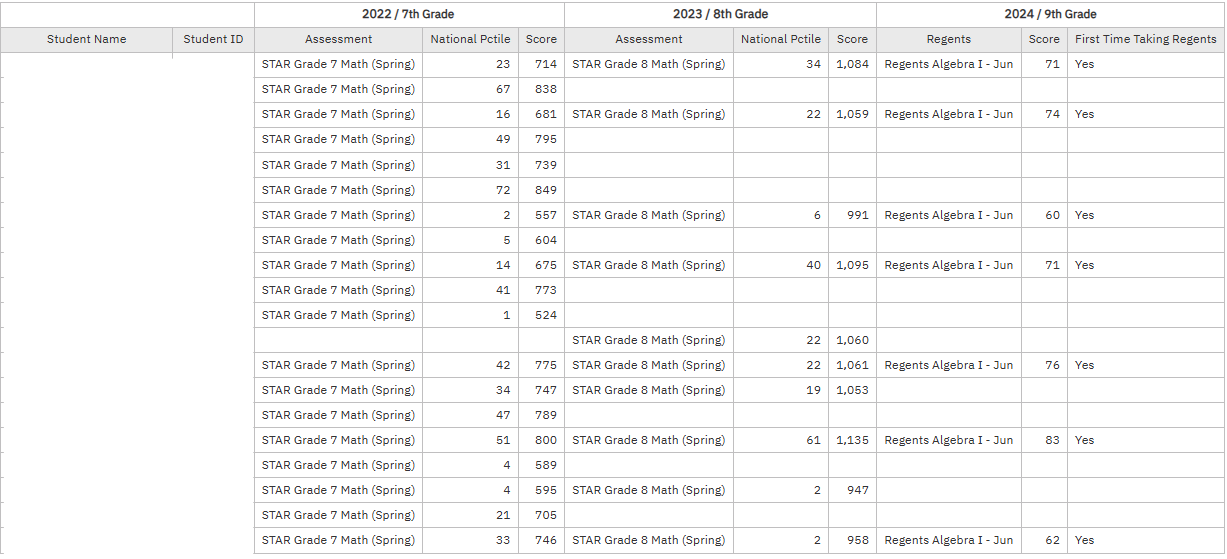
STAR Comparison to 9th Grade Algebra Regents iReport
|
This report comparers STAR math results for students in 7th and 8th grade with their 9th grade June Algebra Regents results.
|
|
|
|
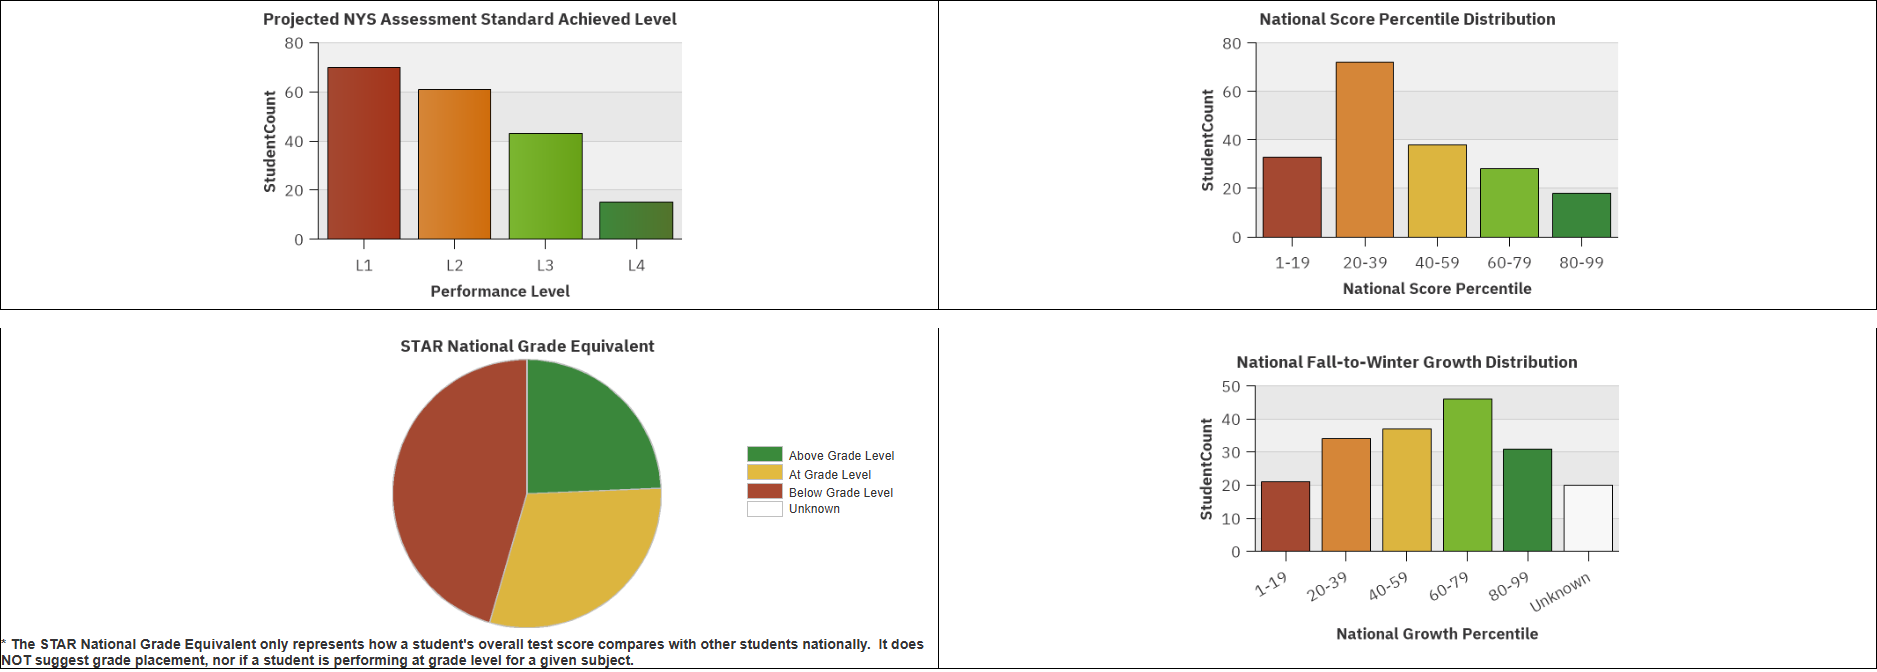
STAR Dashboard
|
This dashboard Consist 3 bar charts in all the STAR Students' Performance, National Score Percentile Distribution, Natinal growth Distribution and one Pie chart in national grade equivalent.
|
|
|
|
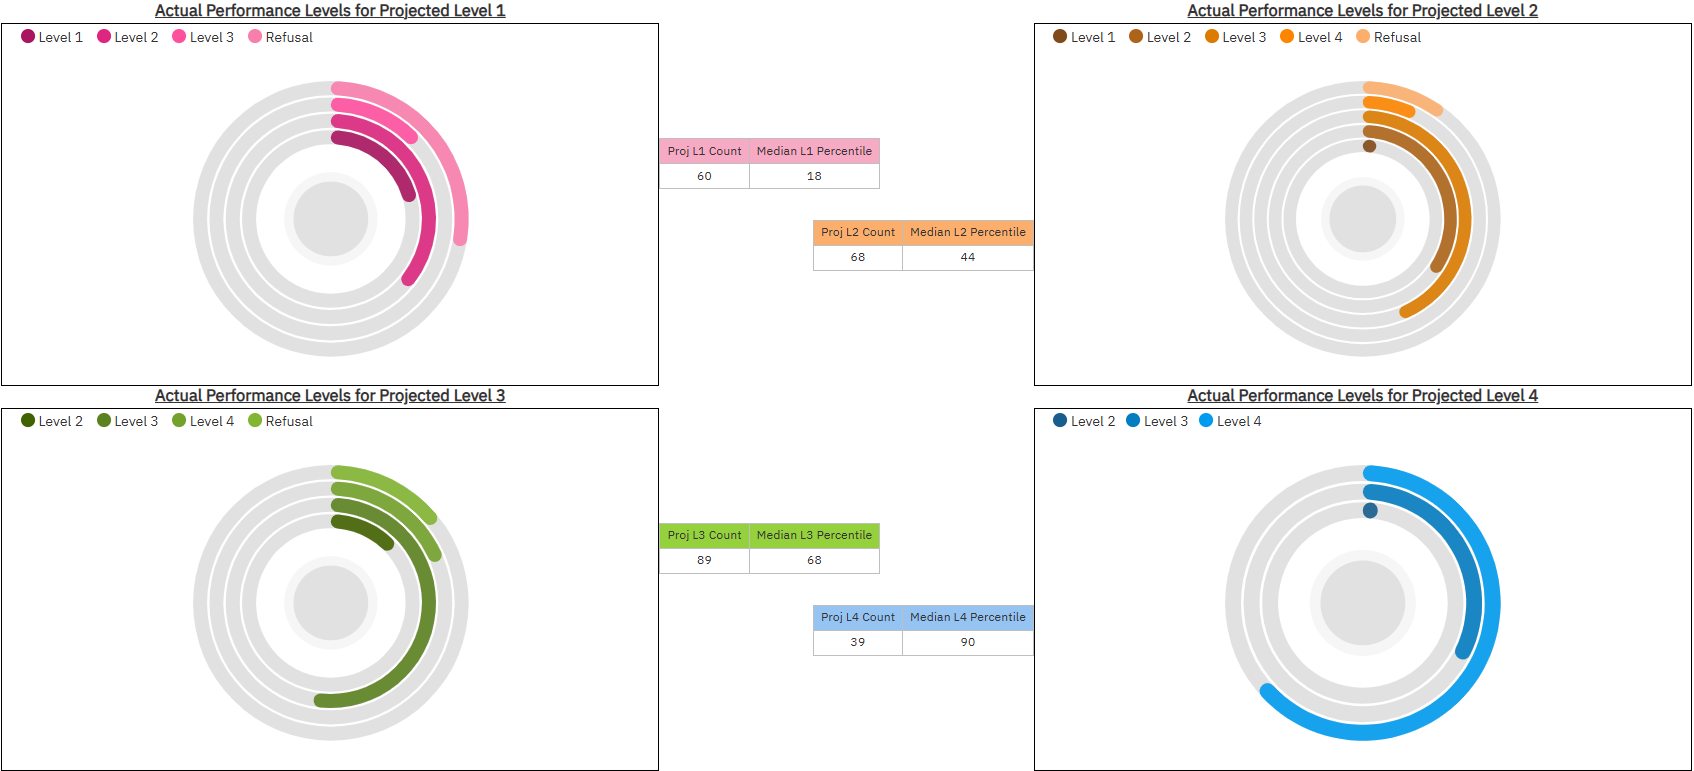
STAR NYS Projection Dashboard – Individual Level Summary
|
This dashboard list the percentage of actual NYS performance levels vs STAR projected level for individual levels
|
|
|
|
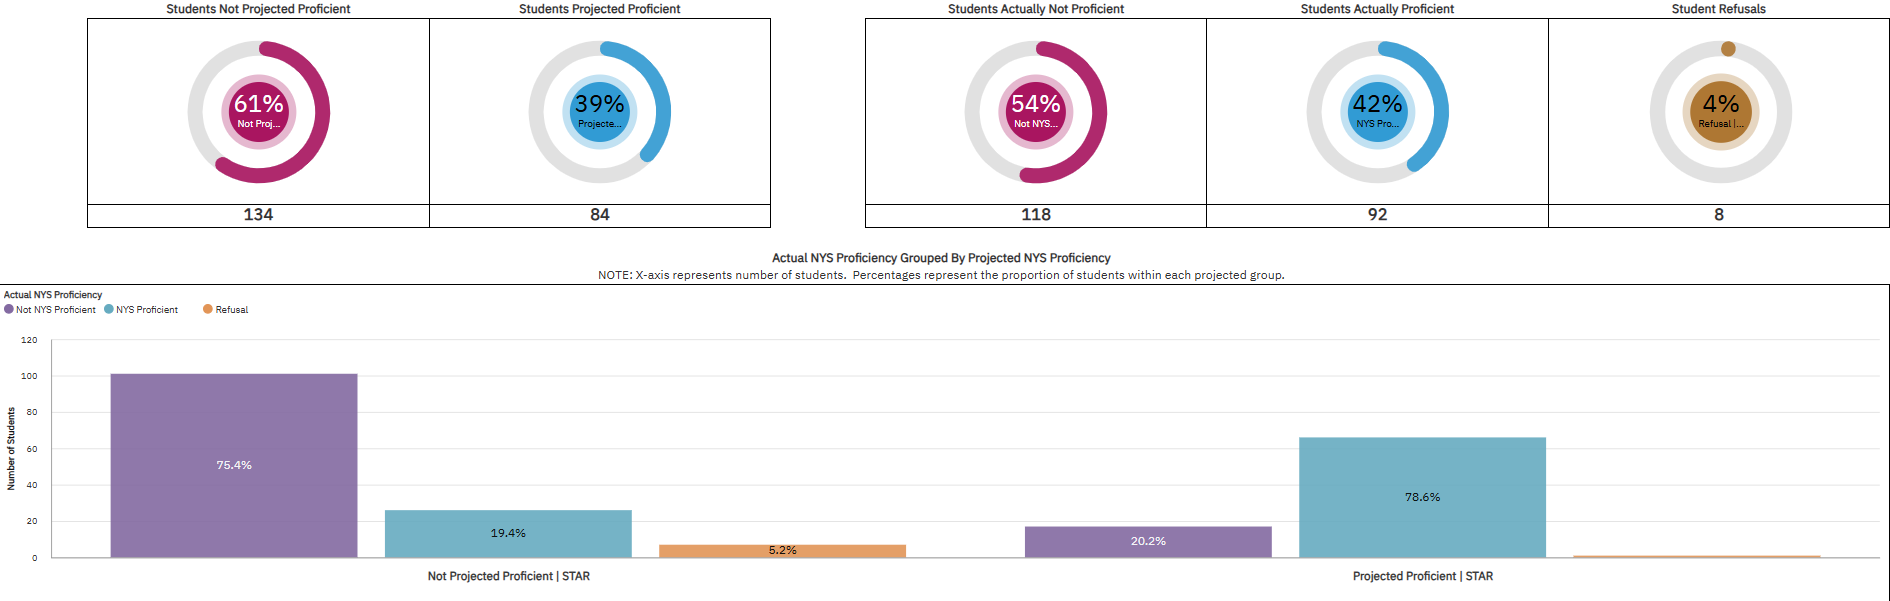
STAR NYS Projection Dashboard – Overall Proficiency Summary
|
This dashboard list the percentage of actual proficiency and STAR projected proficiency
|
|
|
|
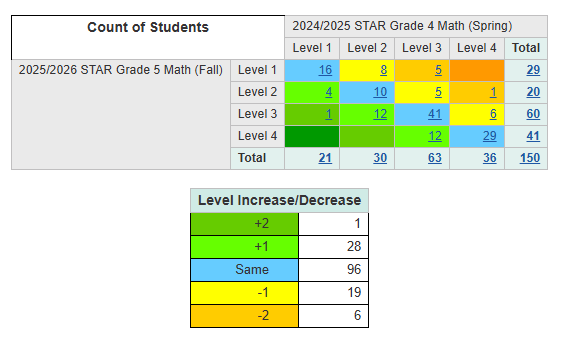
STAR Projected NYS Performance Level Change
|
This report examines changes in student projected NYS proficiency over two different administrations of the STAR assessment. Projected proficiency estimates how a student will perform on the NYS 3-8 ELA and Math assessments. Only students taking both selected STAR assessments will be included.
|
|
|
|
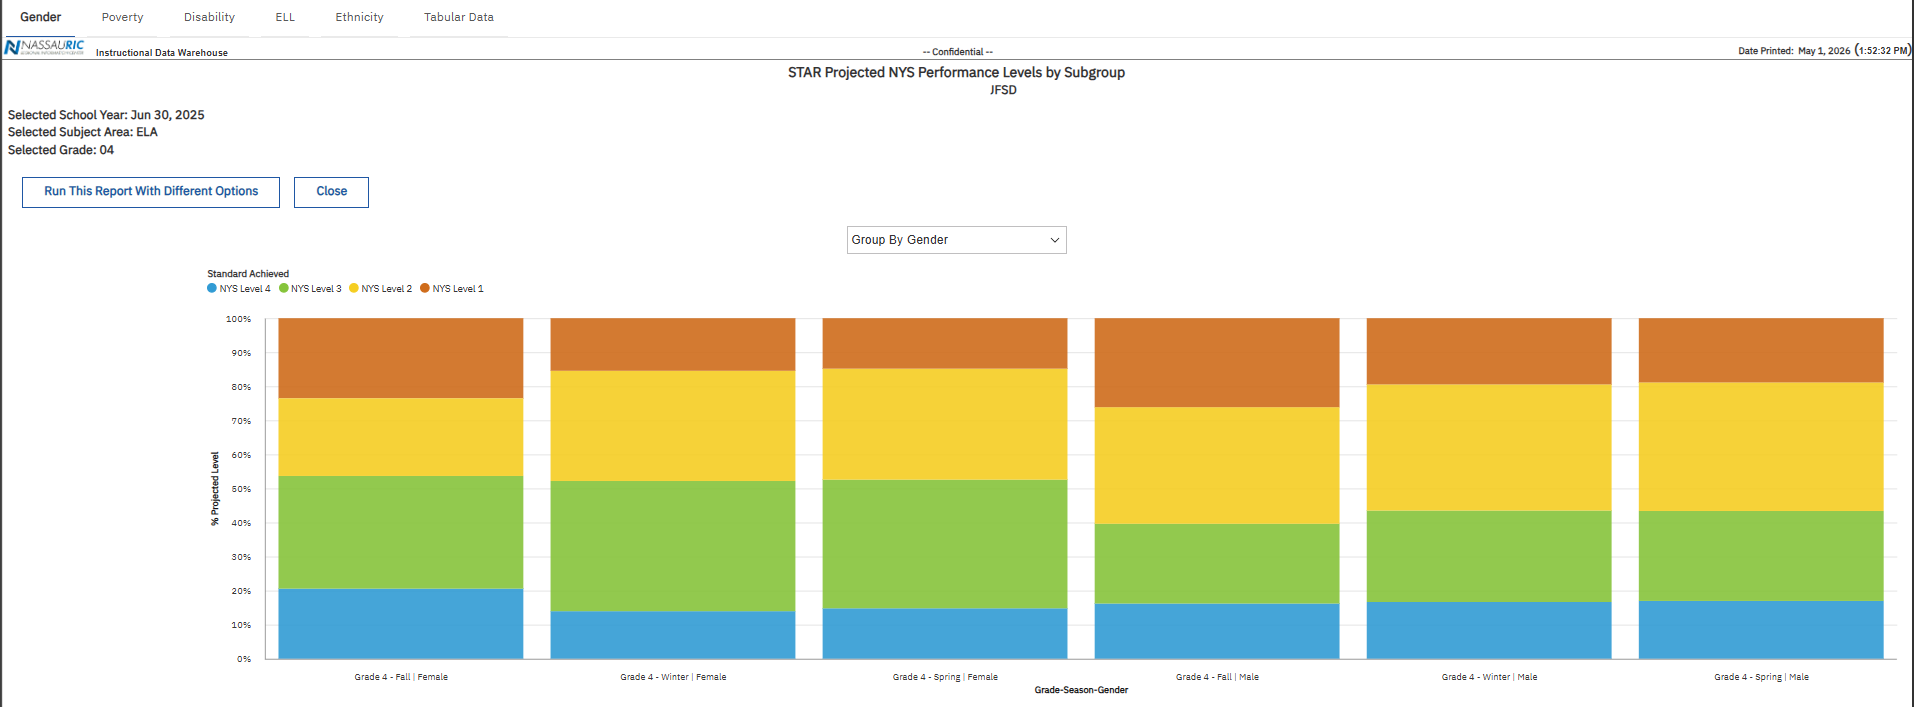
STAR Projected NYS Performance Levels by Subgroup
|
The STAR Projected NYS Performance Levels by Subgroup Report is a tabbed report that displays aggregated projections of NYS 3-8 proficiency based on student performance on the STAR assessments. Data are provided for each grade and season within a single year. Each tab, located at the top of the report page, provides a look at projected performance levels on the NYS assessments for each demographic category
|
|
|
|
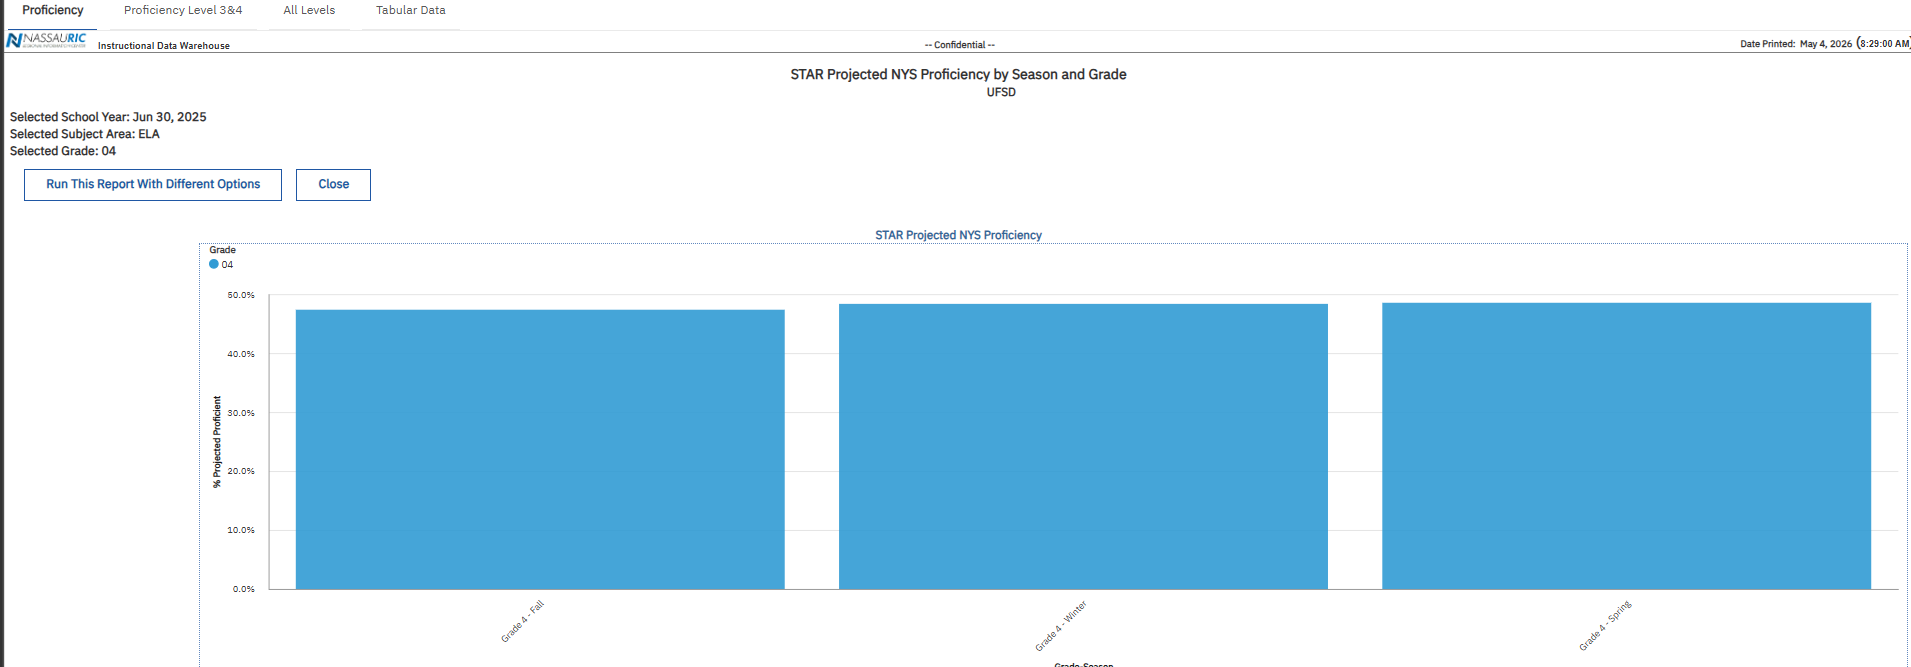
STAR Projected NYS Proficiency by Season and Grade
|
The STAR Projected NYS Proficiency by Season and Grade Report is a tabbed report that displays aggregated projections of NYS 3-8 proficiency based on student performance on the STAR assessments. Data are provided for each grade and season within a single year. Each tab, located at the top of the report page, provides a different look at projected proficiency/performance levels on the NYS assessments
|
|
|
|
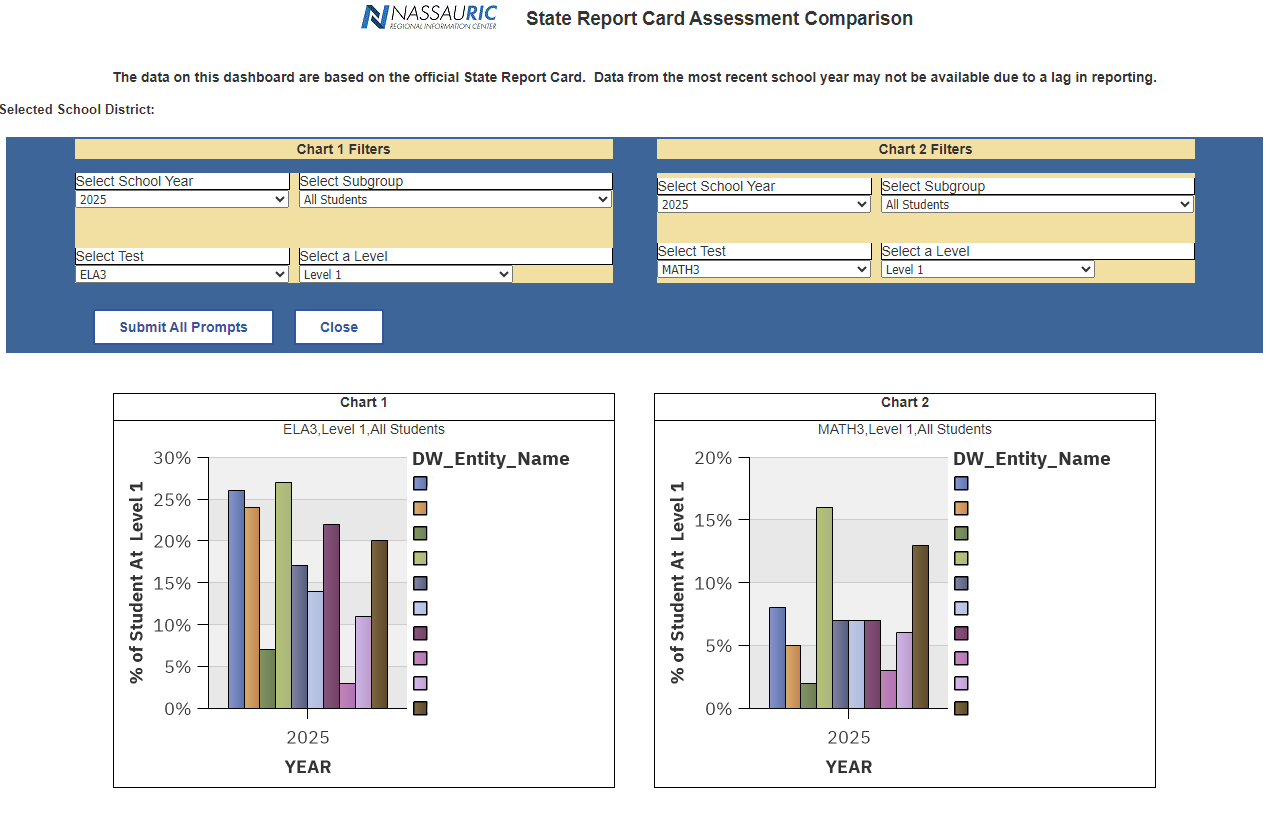
State Report Card Assessment Comparison
|
This dashboard consists of two bar charts. Each can be customized to show a specific year, student subgroup, NYS test, and the perfomance level. Each chart is aggregated by building within the district.
|
|
|
|
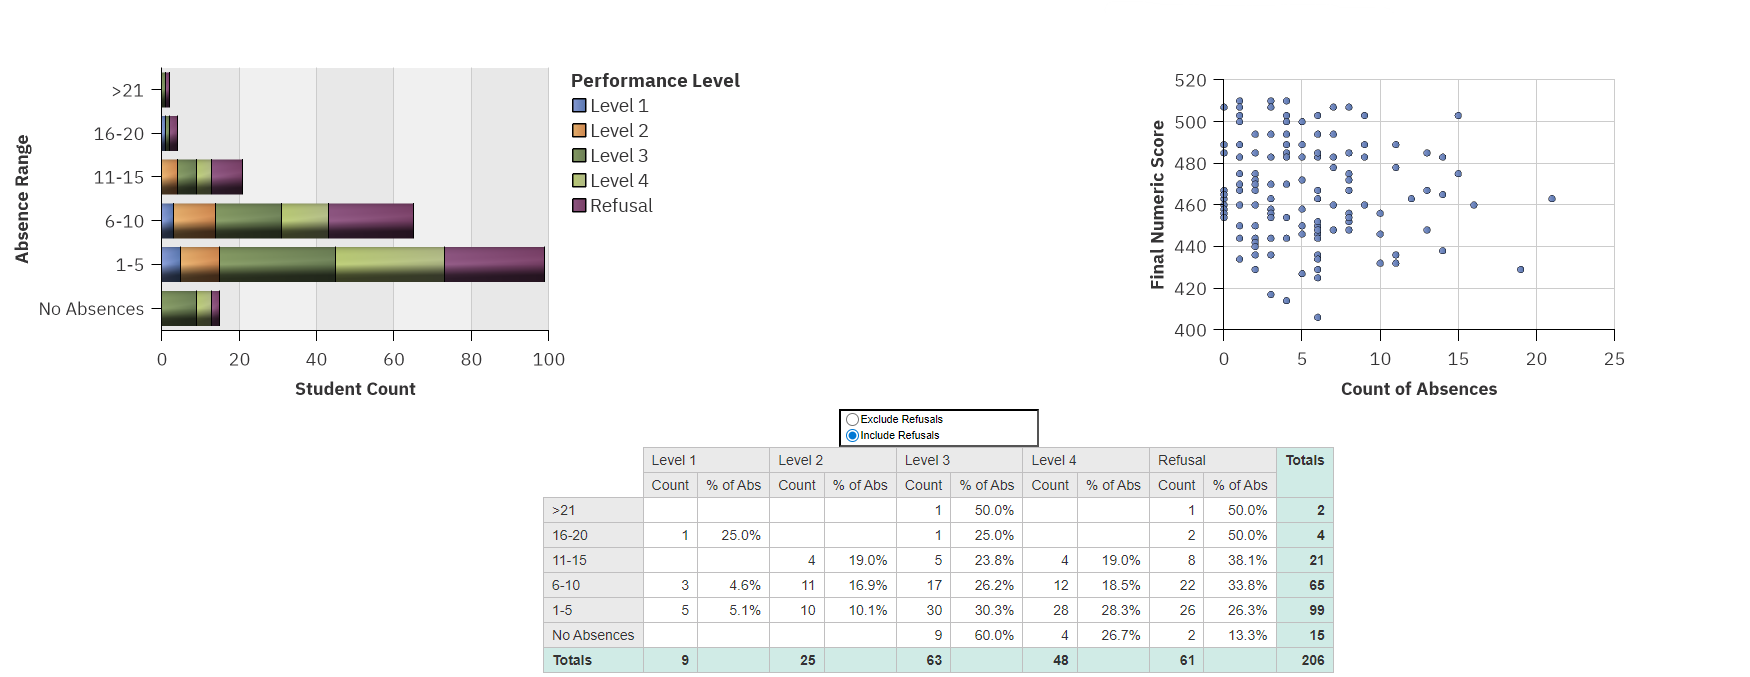
Student Assessment Results and Attendance Patterns
|
Compares student attendance to selected assessment scores.
|
|
|
|
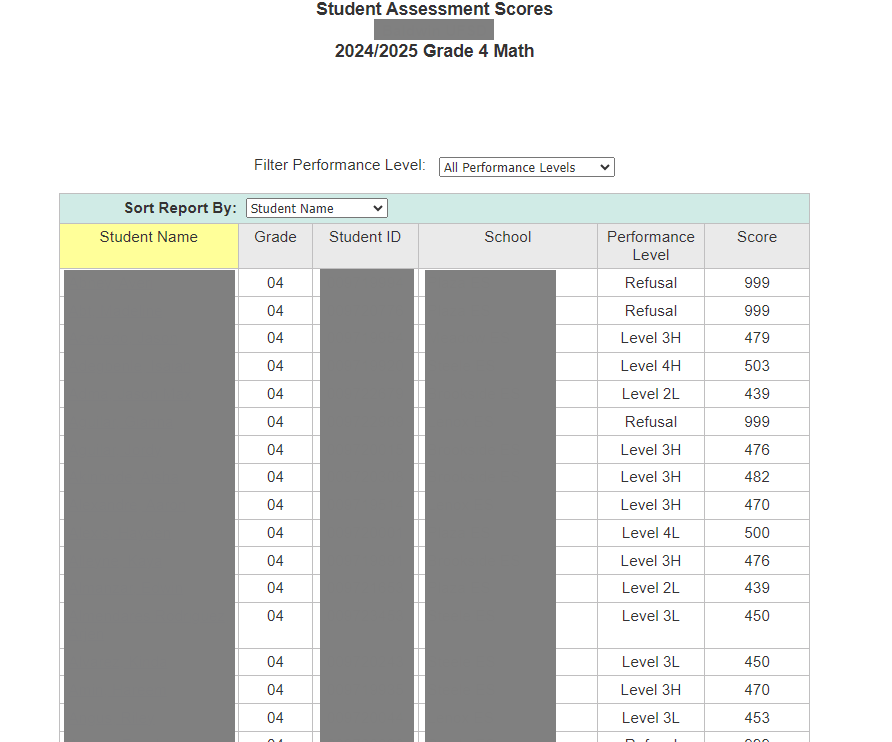
Student Assessment Scores
|
Displays individual student scores and performance levels by district, building or teacher.
|
|
|
|
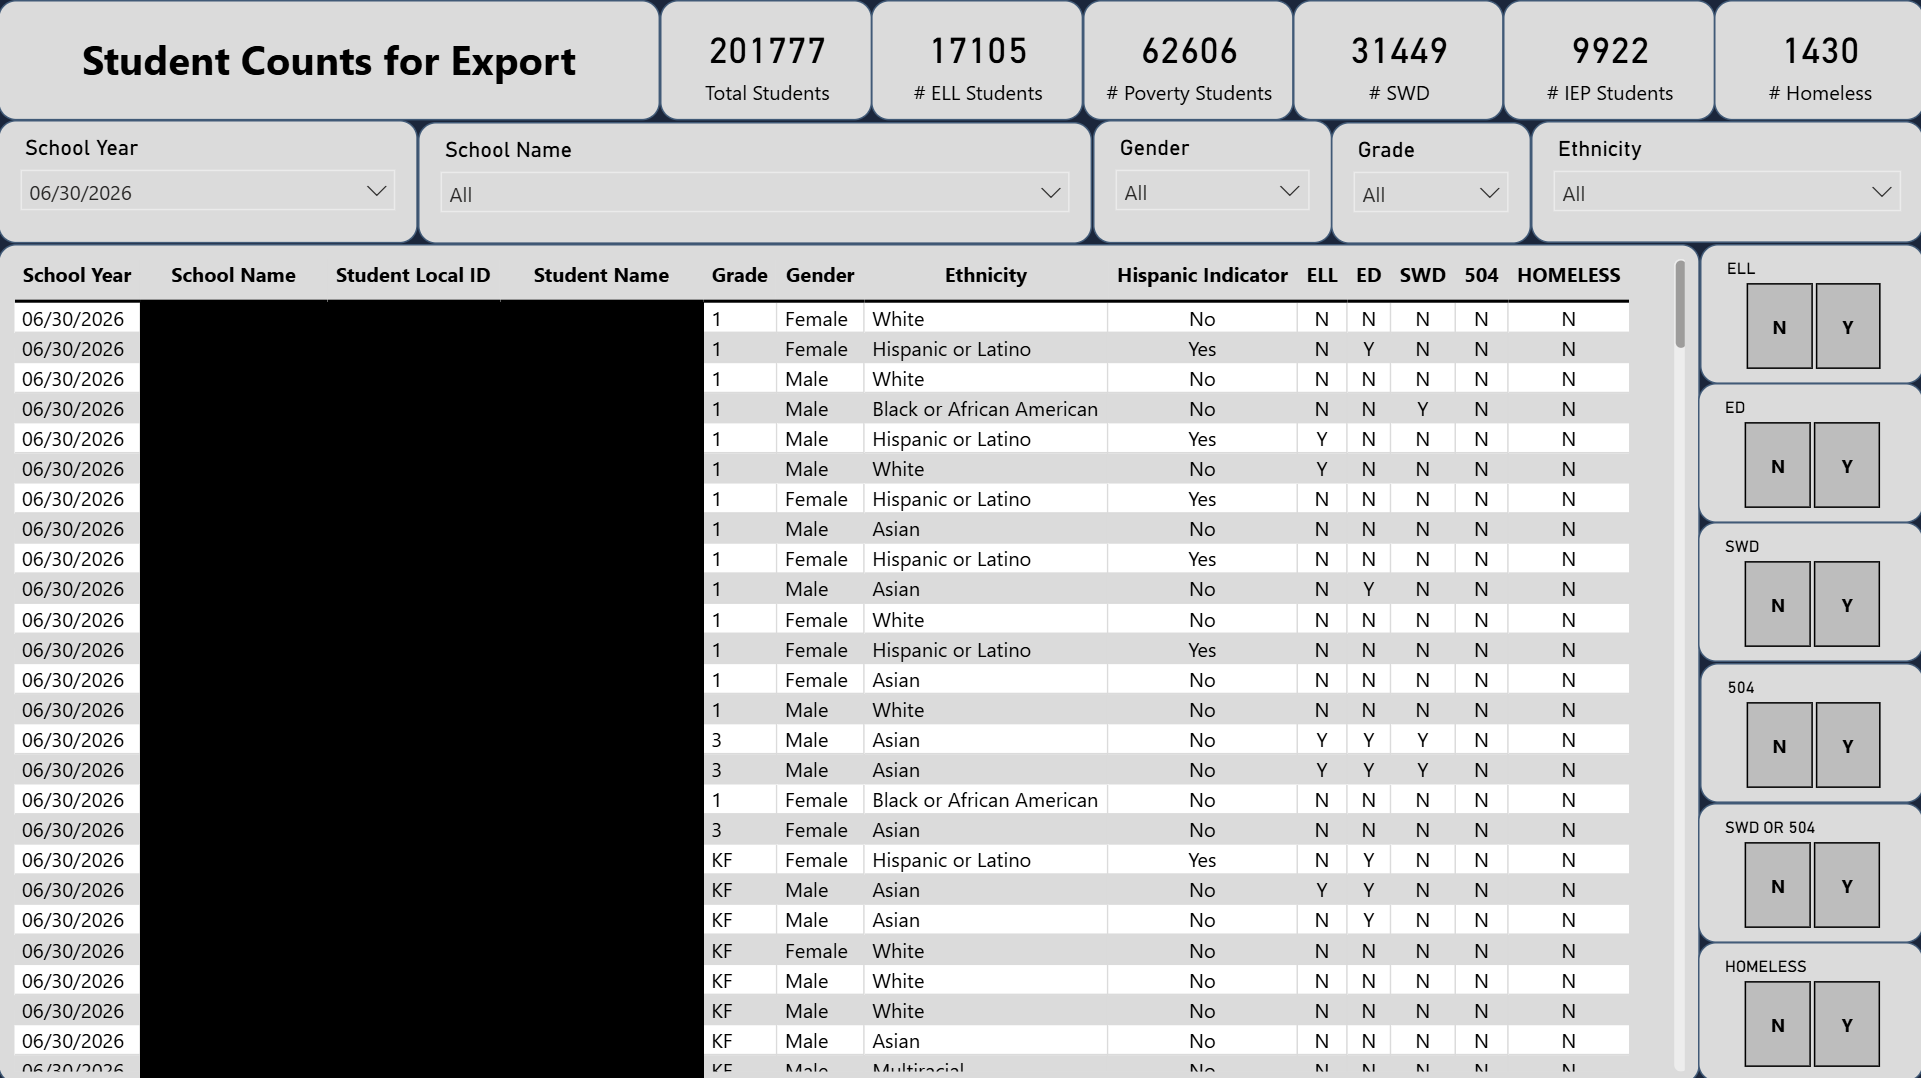
Student Counts Report
|
A report designed to pull extracts of students in different demographic or accountable subgroups.
|
|
|
|
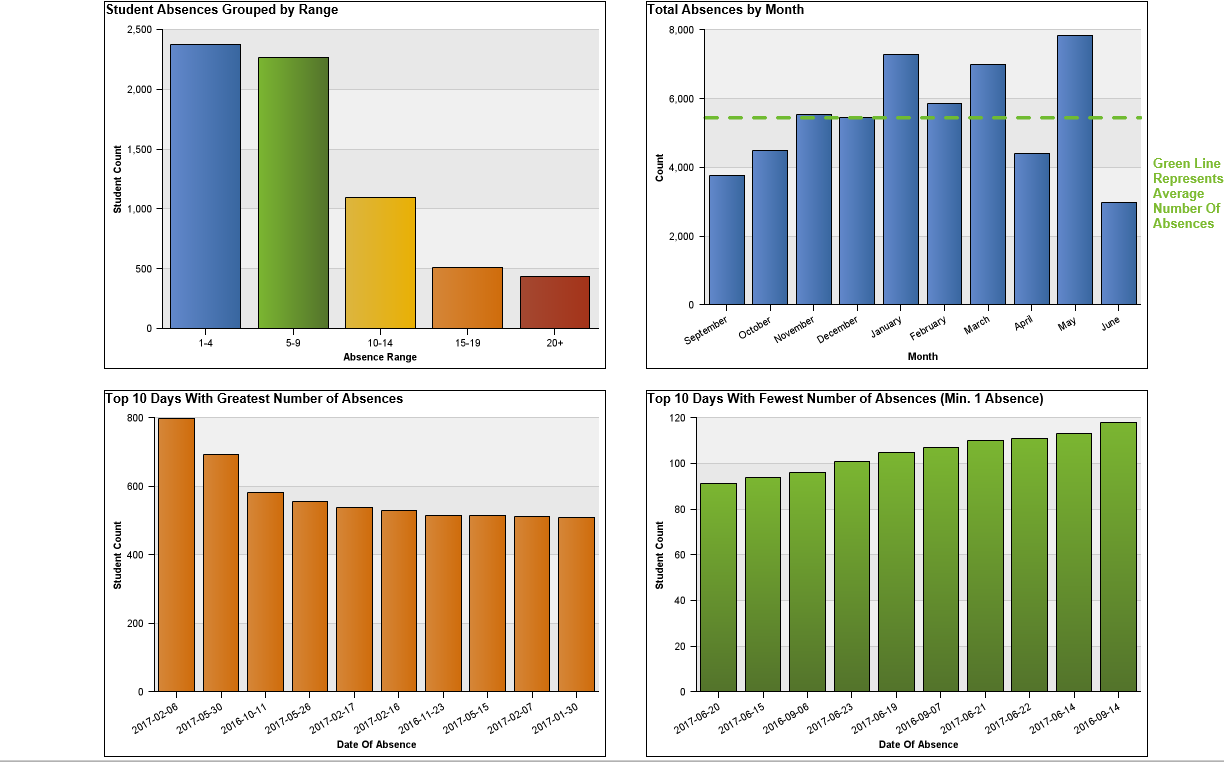
Student Daily Absence Dashboard
|
Chart visulization for student daily absence.Includes demographic filters.
|
|
|
|
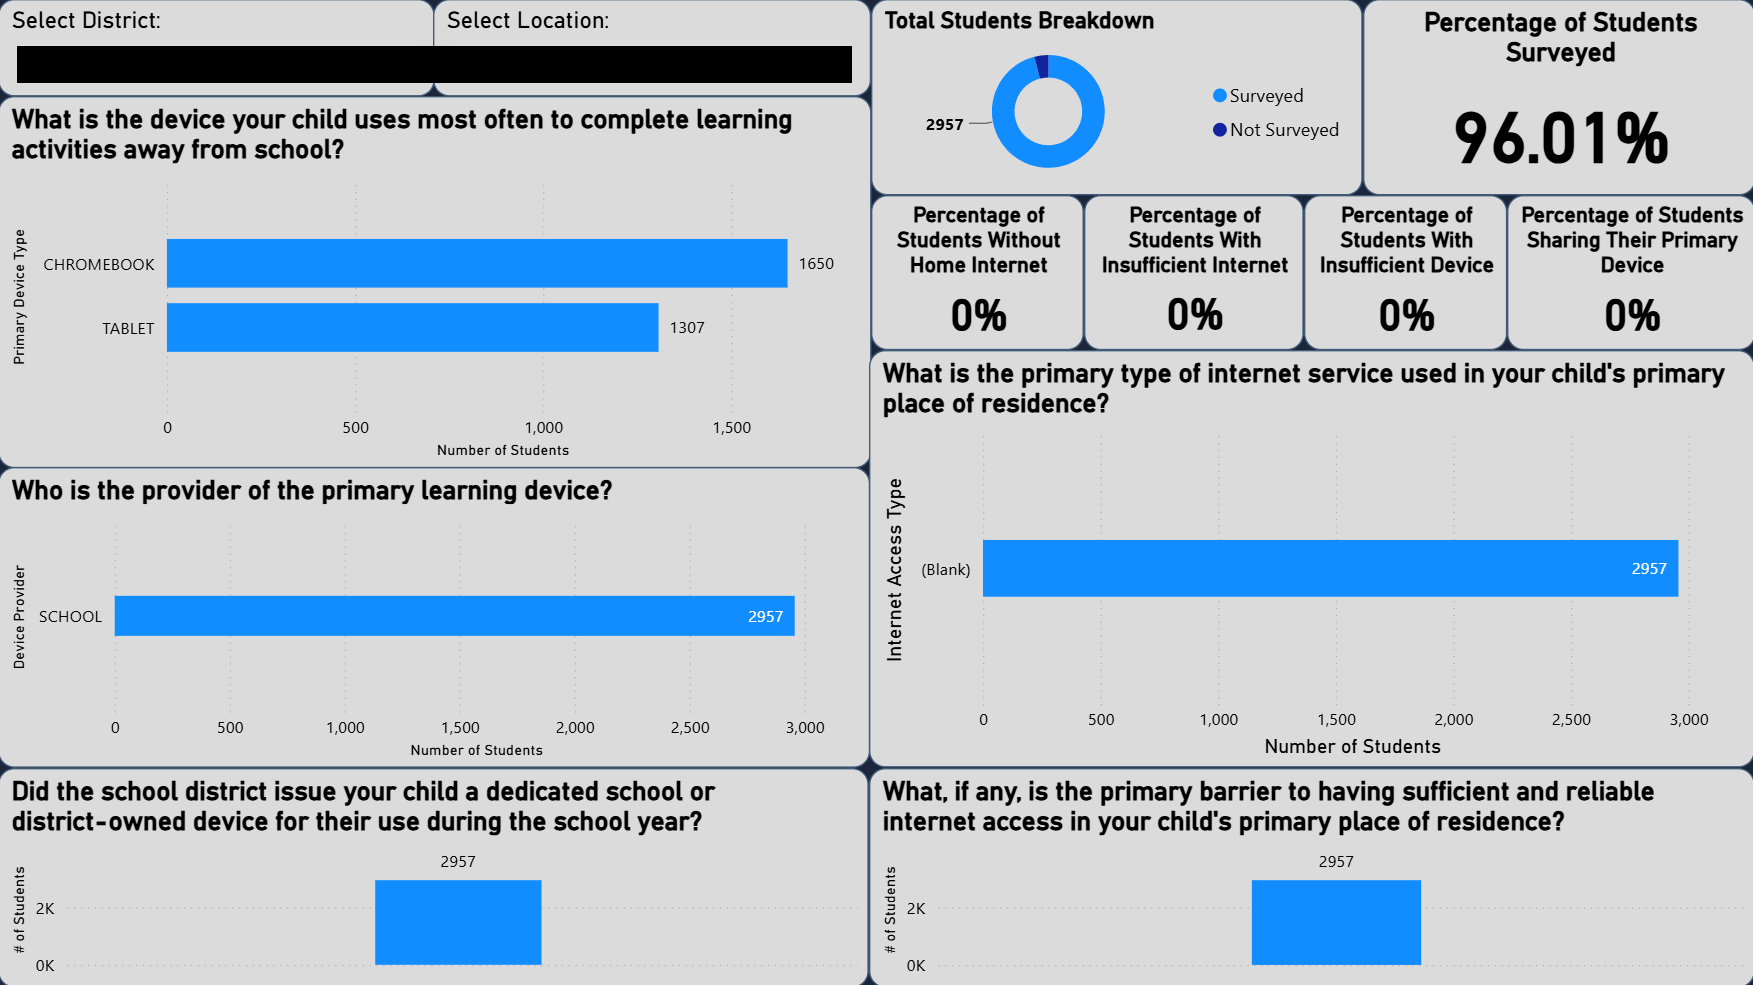
Student Digital Resources Analysis
|
Review the survey submissions and find inadequate or contradictory responses.
|
|
|
|
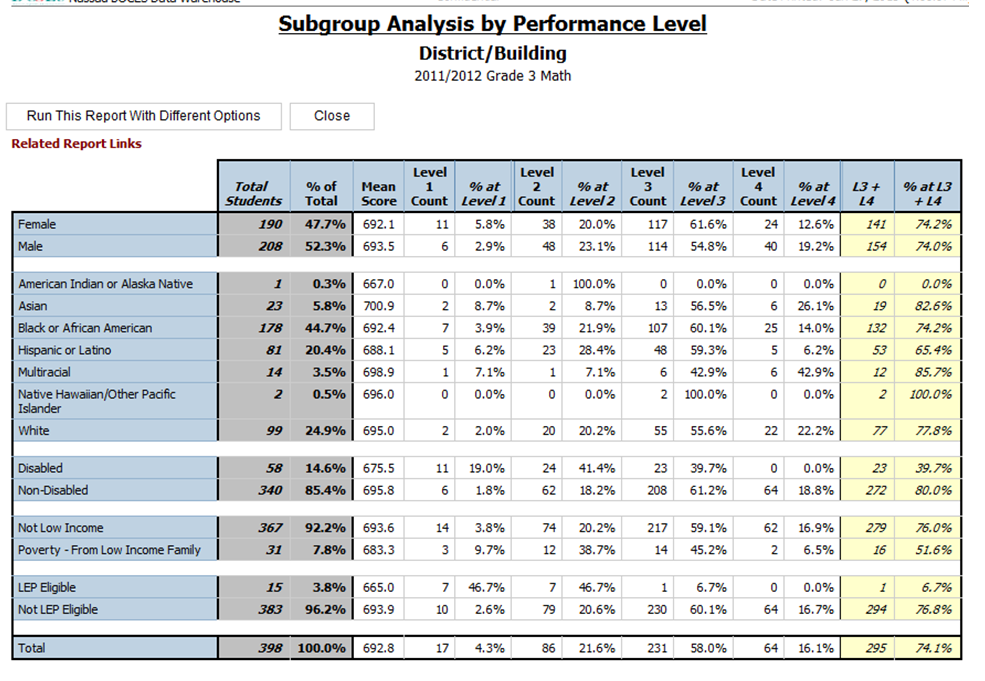
Subgroup Analysis by Performance Level
|
Performance level test results by district, building or teacher disaggregated by subgroups.
|
|
|
|
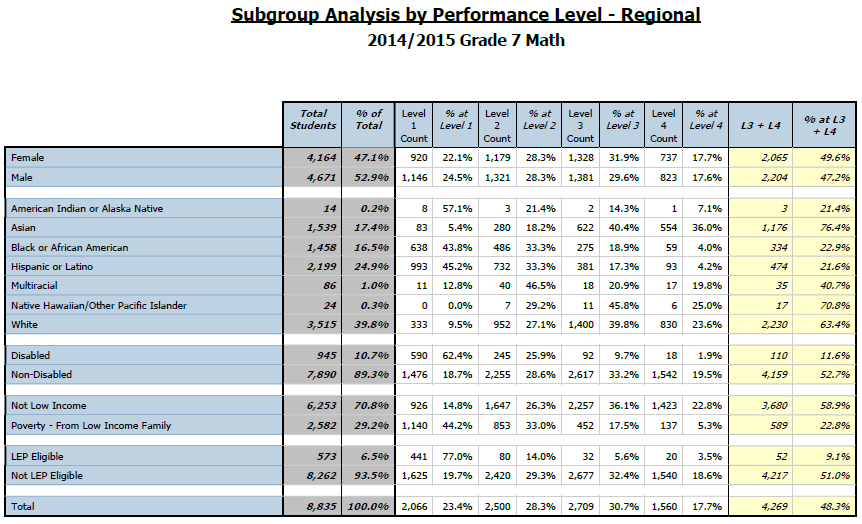
Subgroup Analysis by Performance Level - Regional
|
Performance level test results for Nassau County disaggregated by subgroups.
|
|
|
|
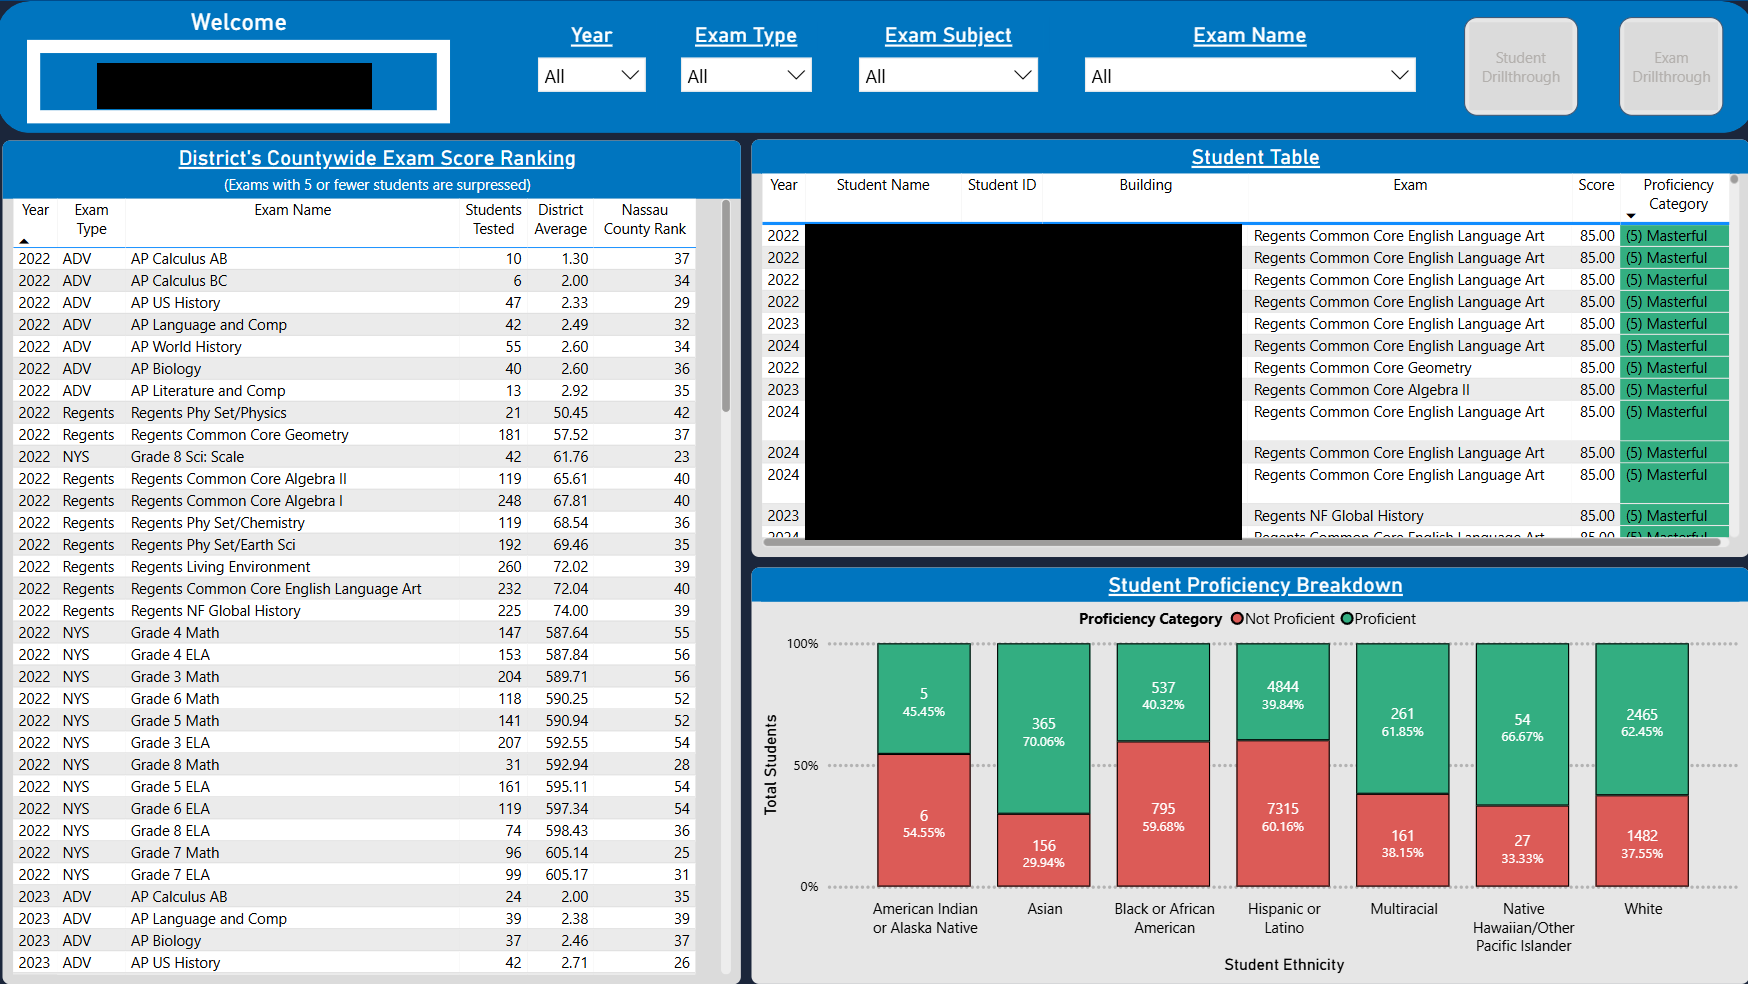
Superintendent's Dashboard
|
Superintendent's dashboard allows superintendents to view staff and student data from simple summarized visuals down to complete individual records.
|
|
|
|
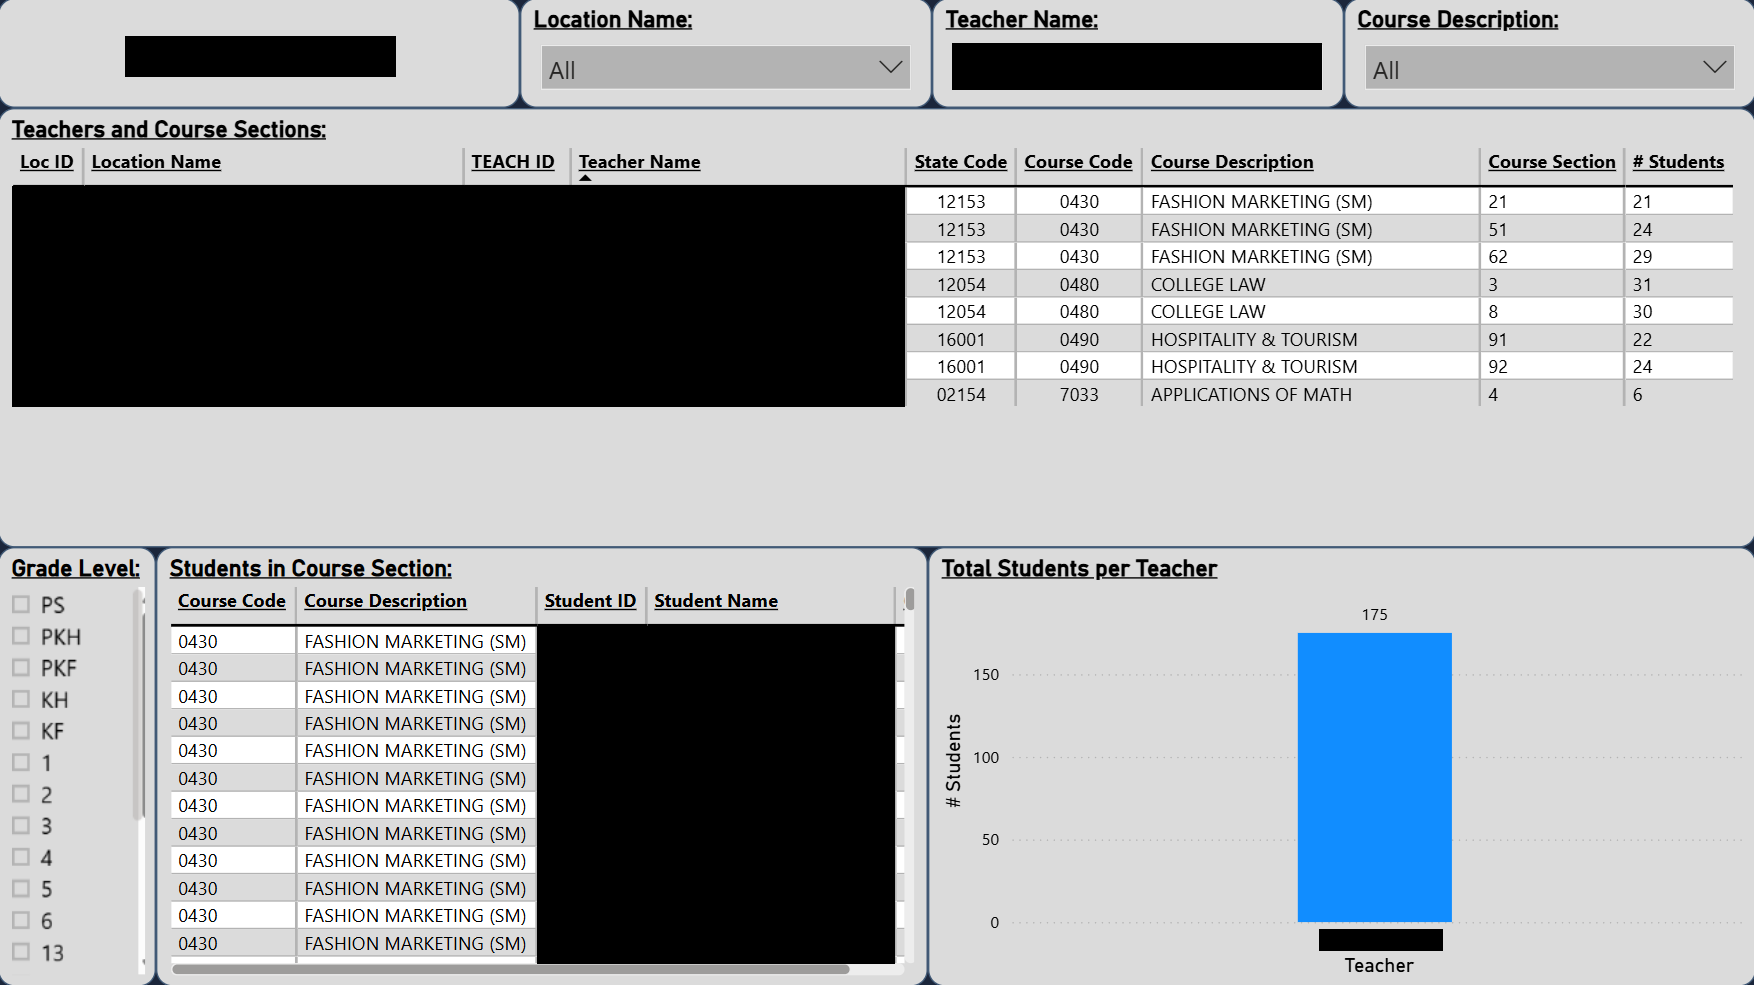
Teacher Class Report
|
Visualize the Student Class Entry Exit and Course Instructor Assignment link to verify student placement.
|
|
|
|
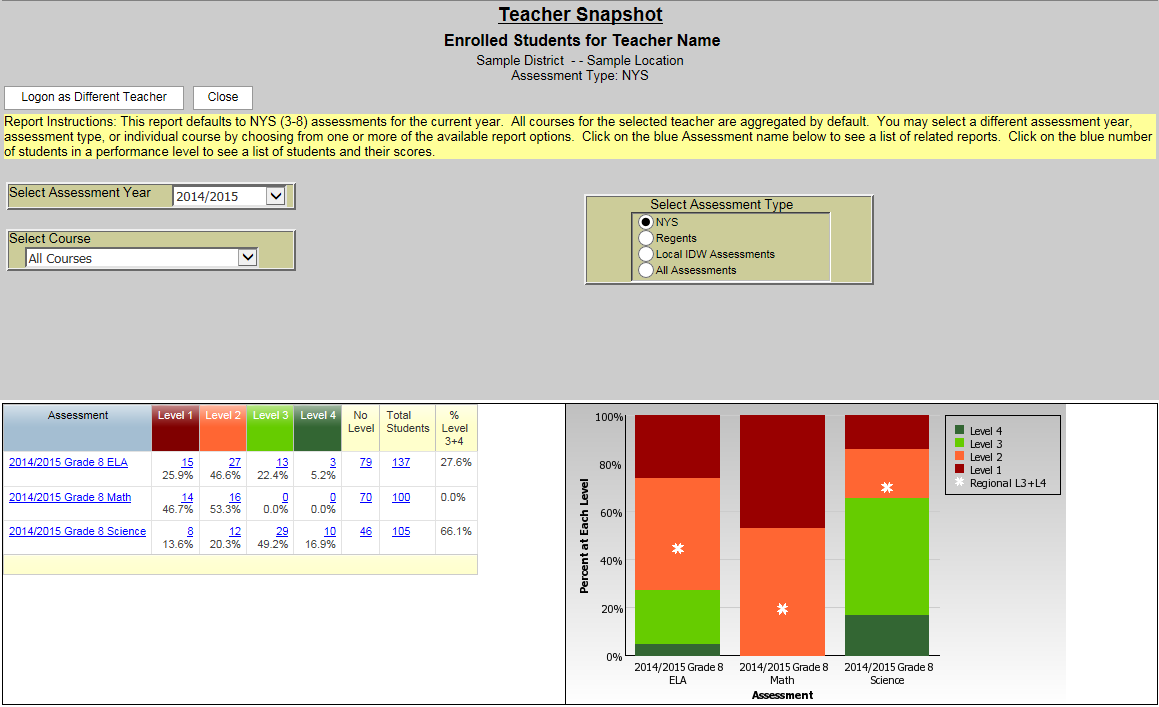
Teacher Snapshot
|
Portal page for the teacher interface. Contains drill-through links to additional report options
|
|
|
|
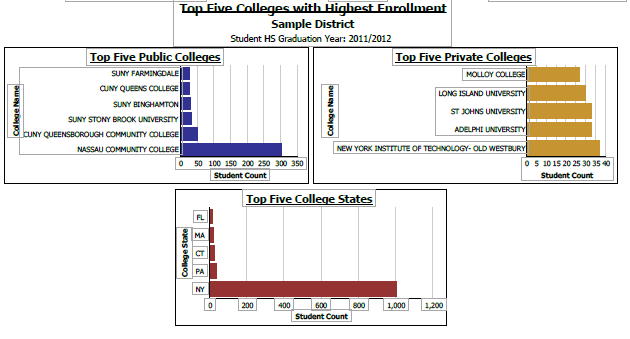
Top Five Colleges with Highest Enrollment
|
Ranking of top-five colleges/universities by largest initial enrollment for a selected high school graduation year.
|
|
|
|
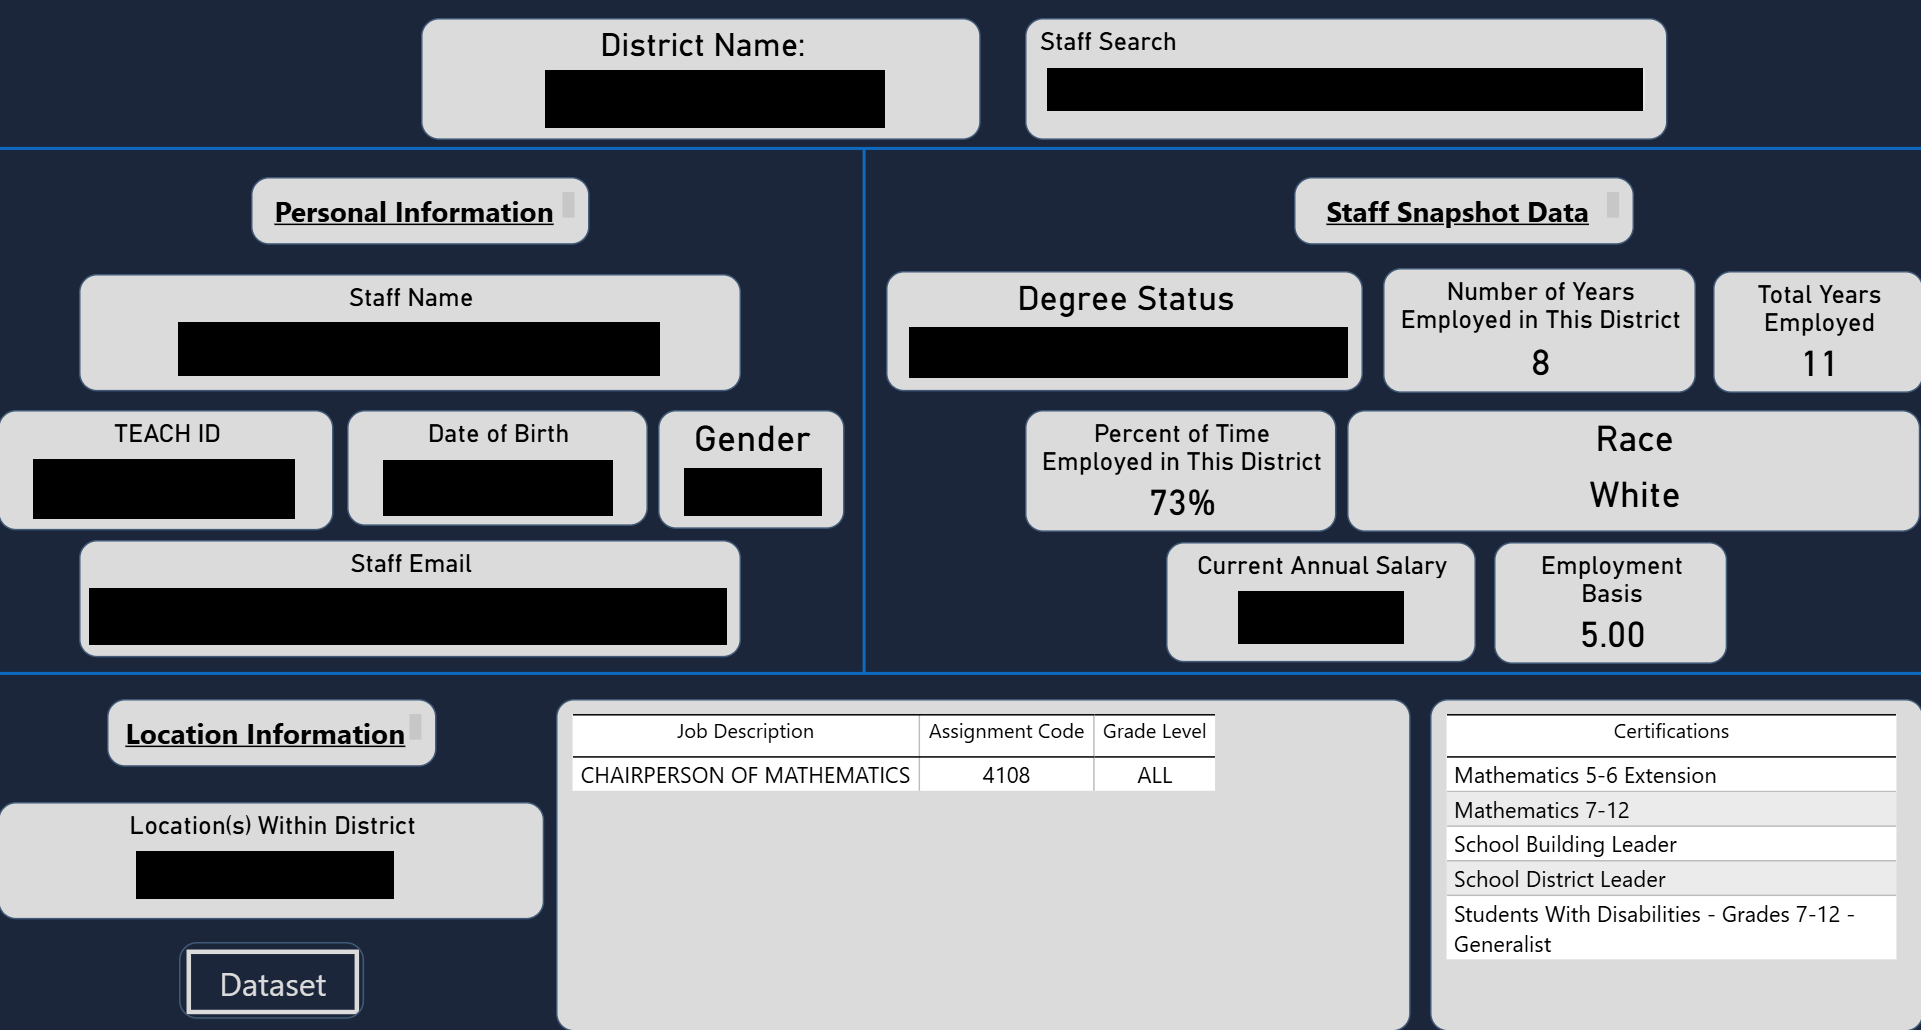
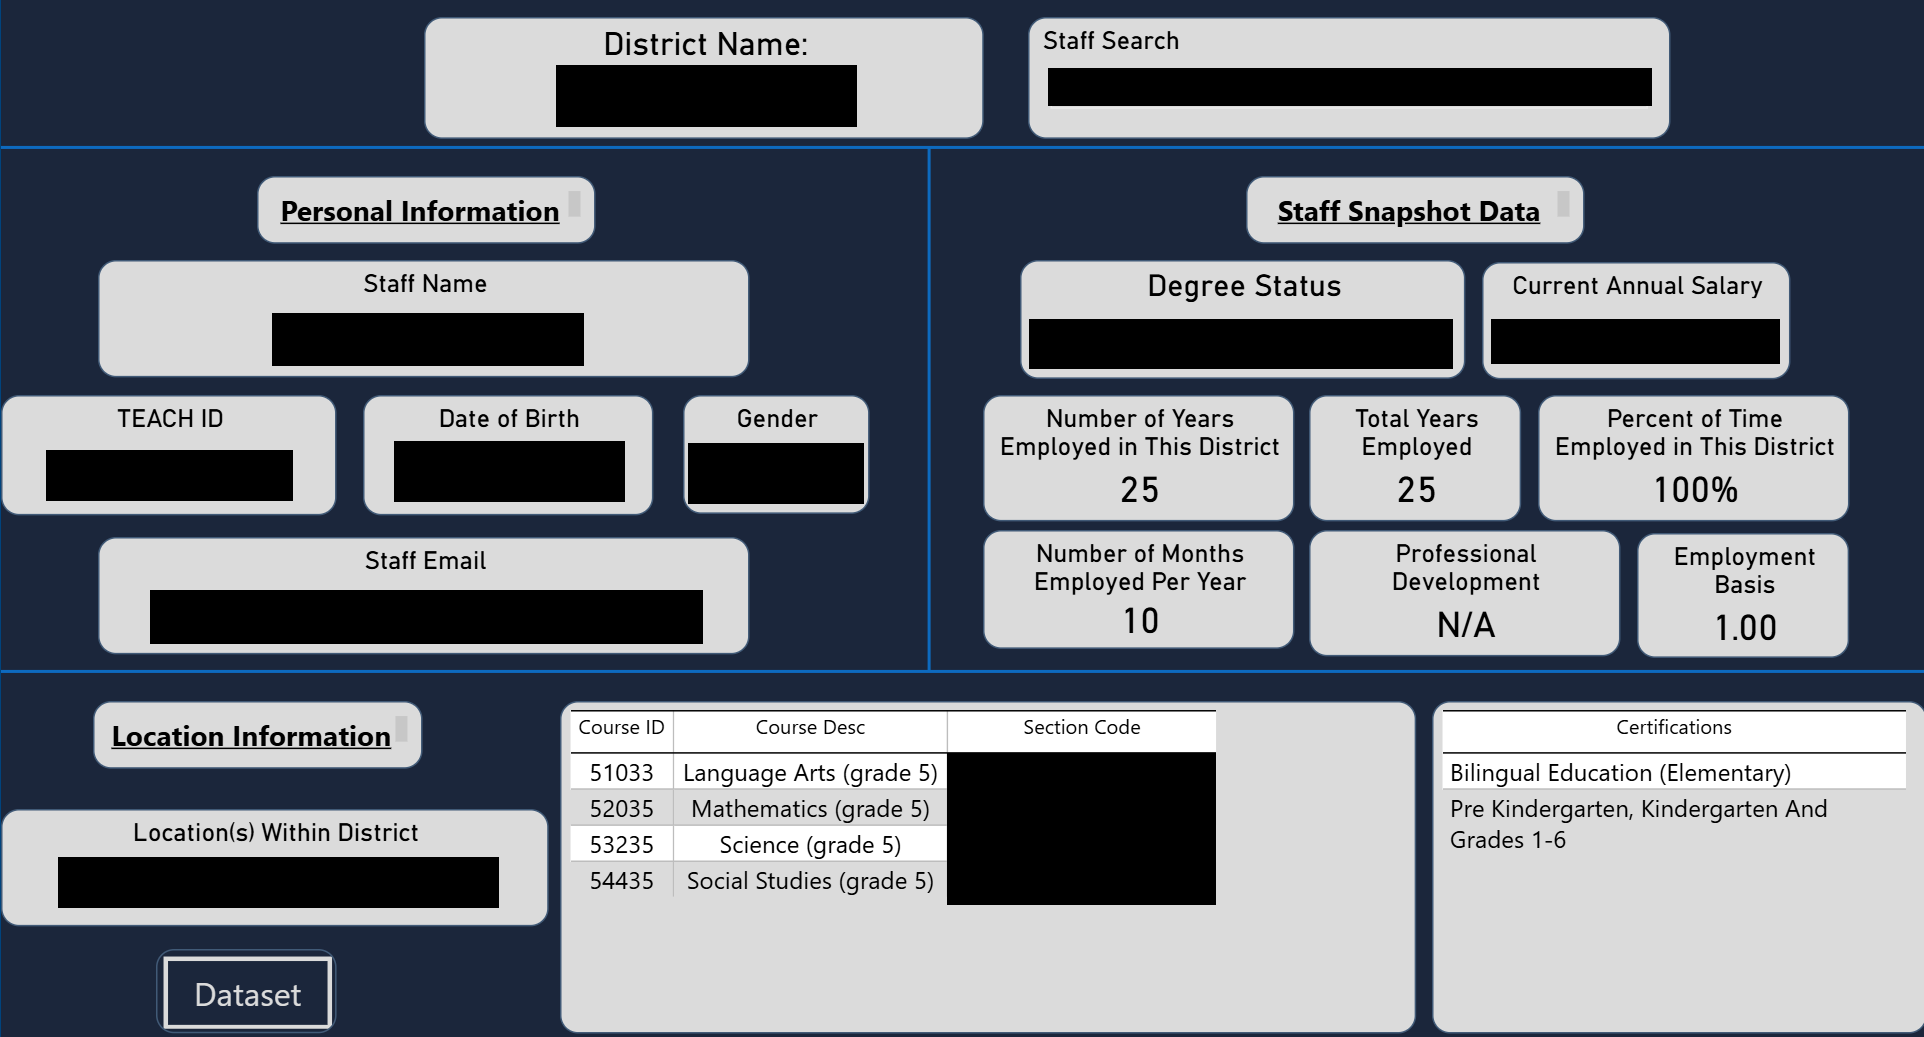
TPP Report
|
Teacher Professional Profile report - review Staff Snapshot, course and certification information by staff member.
|
|
|
|
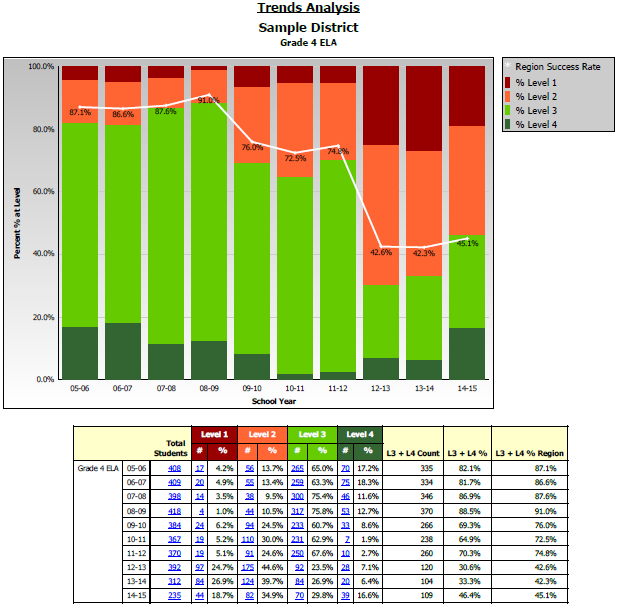
Trends Analysis
|
Historial trend of performance levels for a selected assessment.
|
|
|
|
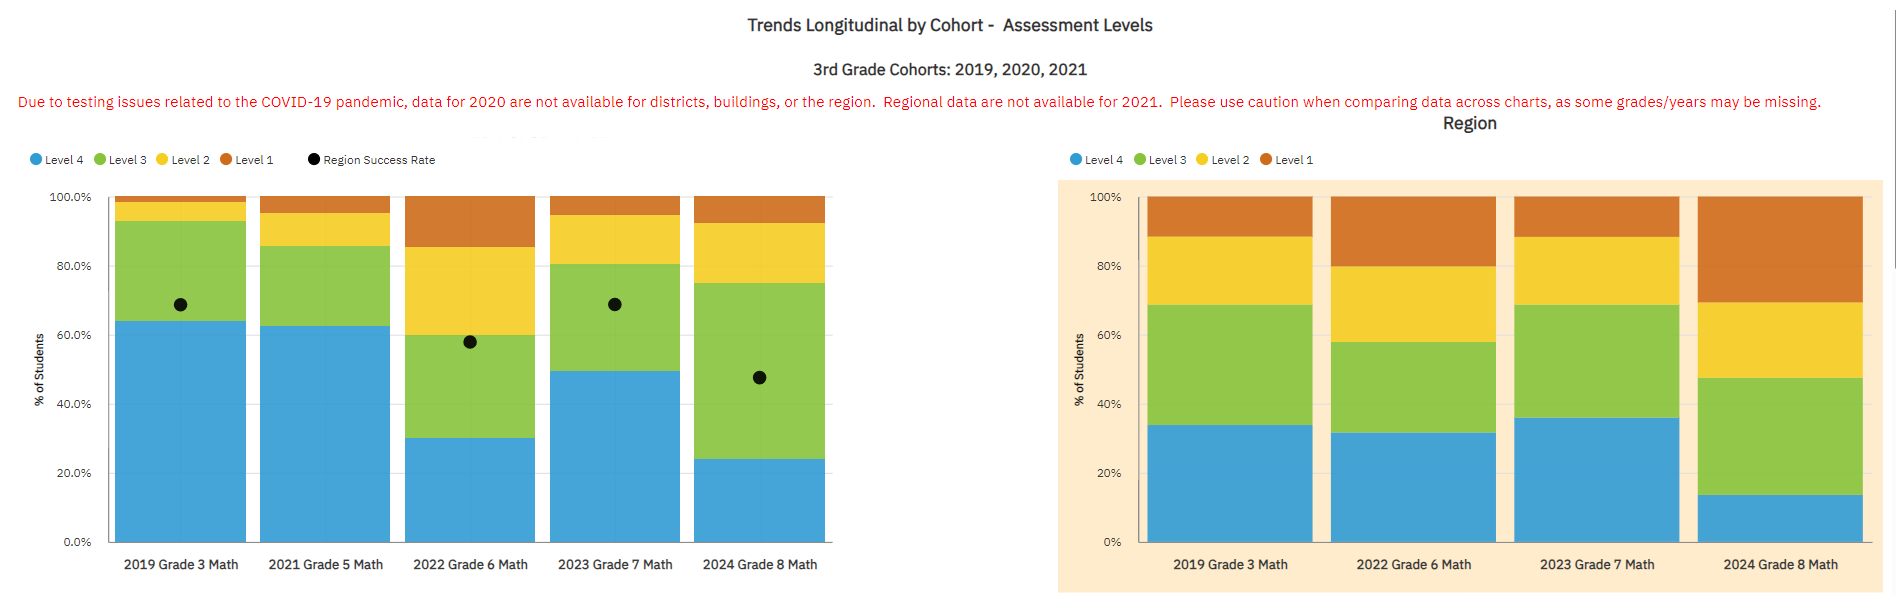
Trends Longitudinal by Cohort
|
This tabbed based report provides a look at the trends of the NYS ELA or Math Assessment for three groups of Grade 3 Cohorts. It provides a longitudinal view of each of these cohorts beginning with grade 3 up until grade 8 for the chosen subject area.
|
|
|
|
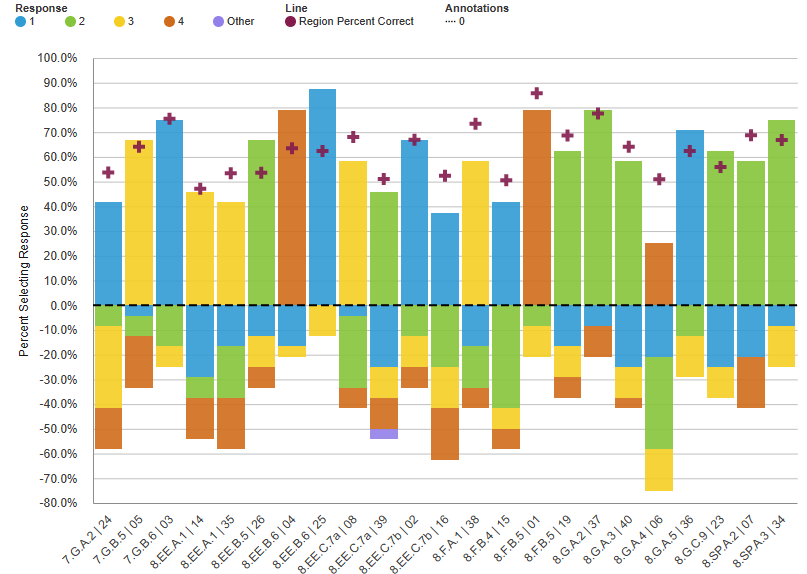
WASA Visual iReport
|
This Wrong Answer Summary Analysis (WASA) Visual iReport displays the distribution of all possible answer choices for each multiple-choice question.
|
|
|
|
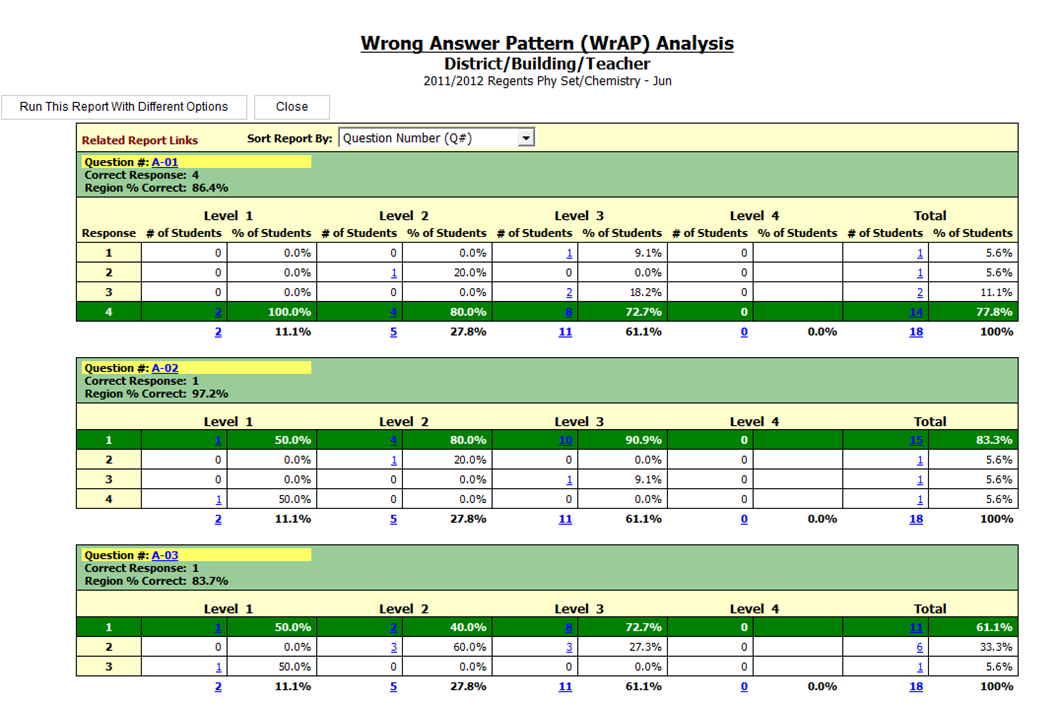
Wrong Answer Pattern (WrAP) Analysis
|
Frequency of correct and incorrect answer choices, by performance level, for each question on a selected assessment.
|
|
|
|
Wrong Answer Pattern (WrAP) Analysis - Regional
|
Frequency of correct and incorrect answer choices, by performance level, for each question on a selected assessment for Nassau County.
|
 Analysis - Regional.png)
|
|
|
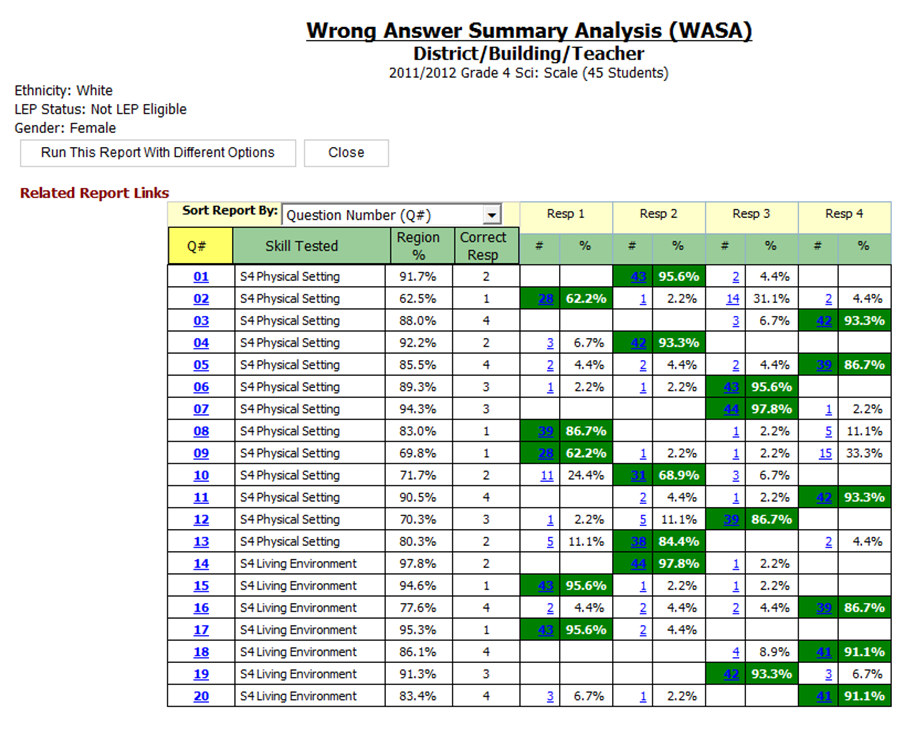
Wrong Answer Summary Analysis (WASA)
|
Frequency of correct and incorrect answer choices for each question on a selected assessment.
|
|
|
|
Wrong Answer Summary Analysis (WASA) - Regional
|
Frequency of correct and incorrect answer choices for each question on a selected assessment for Nassau County.
|
 - Regional.png)
|
|
|
Yearly Enrollment Summary Dashboard
|
Quickly identify major enrollment shifts in different demographic groups over time.
|
|